
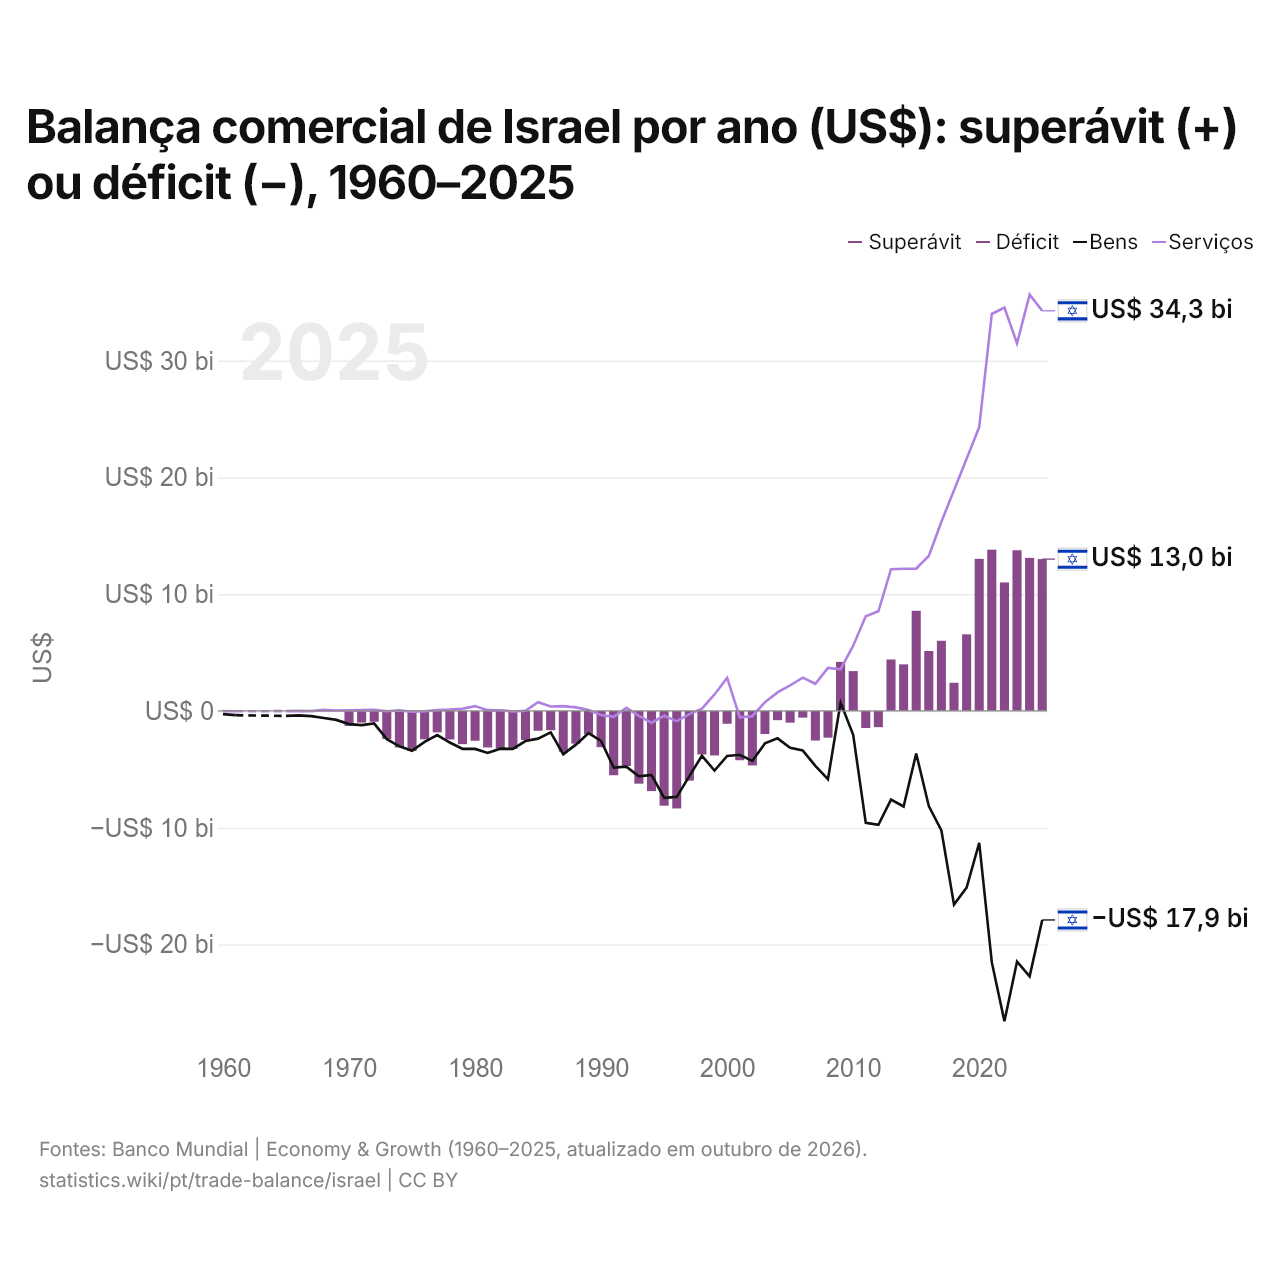
Balança comercial de Israel por ano (US$): superávit (+) ou déficit (−), 1960–2025
| Ano | US$ | ||
|---|---|---|---|
| Bens e serviços | Bens | Serviços | |
| 2025 | US$ 12.994.365.505 | US$ −17.900.900.000 | US$ 34.261.500.000 |
| 2024 | US$ 13.100.279.099 | US$ −22.727.800.000 | US$ 35.641.000.000 |
| 2023 | US$ 13.754.663.733 | US$ −21.463.200.000 | US$ 31.466.900.000 |
| 2022 | US$ 11.000.808.302 | US$ −26.580.800.000 | US$ 34.541.200.000 |
| 2021 | US$ 13.804.496.055 | US$ −21.519.900.000 | US$ 33.990.200.000 |
| 2020 | US$ 13.021.165.408 | US$ −11.300.500.000 | US$ 24.300.800.000 |
| 2019 | US$ 6.557.503.906 | US$ −15.132.000.000 | US$ 21.599.100.000 |
| 2018 | US$ 2.413.018.727 | US$ −16.591.300.000 | US$ 18.902.600.000 |
| 2017 | US$ 6.004.796.901 | US$ −10.237.700.000 | US$ 16.196.300.000 |
| 2016 | US$ 5.128.475.225 | US$ −8.143.300.000 | US$ 13.264.900.000 |
| 2015 | US$ 8.575.319.326 | US$ −3.651.600.000 | US$ 12.188.600.000 |
| 2014 | US$ 3.984.226.053 | US$ −8.188.300.000 | US$ 12.169.300.000 |
| 2013 | US$ 4.406.103.796 | US$ −7.588.000.000 | US$ 12.127.100.000 |
| 2012 | US$ −1.392.248.402 | US$ −9.759.100.000 | US$ 8.525.000.000 |
| 2011 | US$ −1.462.187.515 | US$ −9.592.100.000 | US$ 8.104.100.000 |
| 2010 | US$ 3.412.251.219 | US$ −2.040.700.000 | US$ 5.578.900.000 |
| 2009 | US$ 4.198.677.110 | US$ 715.400.000 | US$ 3.565.100.000 |
| 2008 | US$ −2.287.048.495 | US$ −5.848.200.000 | US$ 3.678.300.000 |
| 2007 | US$ −2.539.773.861 | US$ −4.703.200.000 | US$ 2.321.800.000 |
| 2006 | US$ −575.153.283 | US$ −3.391.100.000 | US$ 2.847.600.000 |
| 2005 | US$ −1.009.500.635 | US$ −3.161.600.000 | US$ 2.180.100.000 |
| 2004 | US$ −793.186.301 | US$ −2.349.700.000 | US$ 1.580.400.000 |
| 2003 | US$ −1.975.804.879 | US$ −2.779.000.000 | US$ 749.800.000 |
| 2002 | US$ −4.669.753.894 | US$ −4.278.200.000 | US$ −451.600.000 |
| 2001 | US$ −4.222.578.168 | US$ −3.755.100.000 | US$ −554.100.000 |
| 2000 | US$ −1.098.518.628 | US$ −3.857.000.000 | US$ 2.831.300.000 |
| 1999 | US$ −3.810.722.999 | US$ −5.109.300.000 | US$ 1.405.700.000 |
| 1998 | US$ −3.730.624.984 | US$ −3.839.600.000 | US$ 185.600.000 |
| 1997 | US$ −5.975.502.116 | US$ −5.583.100.000 | US$ −275.000.000 |
| 1996 | US$ −8.351.877.056 | US$ −7.365.000.000 | US$ −875.200.000 |
| 1995 | US$ −8.115.948.262 | US$ −7.438.200.000 | US$ −418.400.000 |
| 1994 | US$ −6.867.235.894 | US$ −5.485.800.000 | US$ −1.011.000.000 |
| 1993 | US$ −6.232.770.220 | US$ −5.606.700.000 | US$ −430.600.000 |
| 1992 | US$ −4.720.523.362 | US$ −4.768.600.000 | US$ 266.700.000 |
| 1991 | US$ −5.509.077.267 | US$ −4.860.600.000 | US$ −507.200.000 |
| 1990 | US$ −3.103.552.723 | US$ −2.563.500.000 | US$ −352.500.000 |
| 1989 | US$ −2.010.870.382 | US$ −1.904.800.000 | US$ 71.900.000 |
| 1988 | US$ −2.800.375.258 | US$ −2.890.200.000 | US$ 297.100.000 |
| 1987 | US$ −3.498.185.125 | US$ −3.706.800.000 | US$ 408.100.000 |
| 1986 | US$ −1.649.481.113 | US$ −1.840.600.000 | US$ 380.600.000 |
| 1985 | US$ −1.698.280.601 | US$ −2.376.200.000 | US$ 747.700.000 |
| 1984 | US$ −2.488.666.439 | US$ −2.578.600.000 | US$ 11.600.000 |
| 1983 | US$ −3.259.483.986 | US$ −3.249.700.000 | US$ −48.400.000 |
| 1982 | US$ −3.188.683.128 | US$ −3.236.700.000 | US$ 56.500.000 |
| 1981 | US$ −3.131.228.070 | US$ −3.599.200.000 | US$ 60.900.000 |
| 1980 | US$ −2.559.607.843 | US$ −3.255.000.000 | US$ 412.000.000 |
| 1979 | US$ −2.851.200.000 | US$ −3.247.000.000 | US$ 185.000.000 |
| 1978 | US$ −2.447.647.059 | US$ −2.710.000.000 | US$ 103.000.000 |
| 1977 | US$ −1.834.000.000 | US$ −2.062.000.000 | US$ 68.000.000 |
| 1976 | US$ −2.433.750.000 | US$ −2.657.000.000 | US$ −27.000.000 |
| 1975 | US$ −3.438.333.333 | US$ −3.408.000.000 | US$ −72.000.000 |
| 1974 | US$ −3.132.500.000 | US$ −3.031.000.000 | US$ 48.000.000 |
| 1973 | US$ −2.412.500.000 | US$ −2.416.000.000 | US$ −32.000.000 |
| 1972 | US$ −925.000.000 | US$ −1.080.000.000 | US$ 93.000.000 |
| 1971 | US$ −1.000.000.000 | US$ −1.212.000.000 | US$ 70.000.000 |
| 1970 | US$ −1.283.333.333 | US$ −1.130.000.000 | US$ 43.000.000 |
| 1969 | - | US$ −770.000.000 | US$ 32.000.000 |
| 1968 | - | US$ −608.000.000 | US$ 83.000.000 |
| 1967 | - | US$ −442.000.000 | US$ −23.000.000 |
| 1966 | - | US$ −385.000.000 | US$ −4.000.000 |
| 1965 | - | US$ −432.000.000 | US$ −24.000.000 |
| 1964 | - | - | - |
| 1963 | - | - | - |
| 1962 | - | - | - |
| 1961 | - | US$ −366.000.000 | US$ −30.000.000 |
| 1960 | - | US$ −280.000.000 | US$ −25.000.000 |
Em 2025, a balança comercial de Israel teve um superávit de US$ 13 bilhões, ante um déficit de US$ 1,28 bilhão em 1970. O maior déficit foi de US$ 8,35 bilhões, em 1996, e o maior superávit, de US$ 13,8 bilhões, em 2021. A balança comercial de Israel teve superávit em todos os anos desde 2013.
Em 2025, o saldo comercial de Israel foi o 14º mais alto de 44 países da Ásia, onde os saldos iam de um déficit de US$ 68,9 bilhões na Índia a um superávit de US$ 816 bilhões na China. De 2016 a 2025, os saldos comerciais de Israel somaram um superávit de US$ 97,8 bilhões, ante um superávit de US$ 16,3 bilhões de 2006 a 2015. Em 2025, a conta corrente de Israel teve um superávit de 2,0% do PIB.
Comércio de bens de Israel com os seus 10 maiores parceiros comerciais, segundo Israel, 2025
| País | Exportações para | Importações de | Saldo | |
|---|---|---|---|---|
 Estados Unidos |
US$ 16,1 bi | US$ 9,99 bi | +US$ 6,12 bi | vs EUA |
 China |
US$ 2,79 bi | US$ 20,8 bi | -US$ 18,0 bi | vs China |
 Alemanha |
US$ 3,03 bi | US$ 5,92 bi | -US$ 2,88 bi | vs Alemanha |
 Itália |
US$ 1,29 bi | US$ 4,05 bi | -US$ 2,76 bi | vs Itália |
 Índia |
US$ 2,47 bi | US$ 2,20 bi | +US$ 269 mi | vs Índia |
 Países Baixos |
US$ 2,64 bi | US$ 1,56 bi | +US$ 1,08 bi | vs Países Baixos |
 França |
US$ 1,41 bi | US$ 2,43 bi | -US$ 1,01 bi | vs França |
 Reino Unido |
US$ 1,52 bi | US$ 2,12 bi | -US$ 597 mi | vs RU |
 Coreia do Sul |
US$ 1,12 bi | US$ 2,52 bi | -US$ 1,40 bi | vs Coreia do Sul |
 Espanha |
US$ 1,00 bi | US$ 1,91 bi | -US$ 908 mi | vs Espanha |
Balança comercial de Israel: superávit (+) ou déficit (−)
| Bens e serviços, US$, 2025 | +US$ 13,0 bi |
|---|---|
| % do PIB, 2025 | +2,1% |
| Anos com superávit, 2000–2025 | 15 |
| Bens, US$, 2025 | -US$ 17,9 bi |
| Serviços, US$, 2025 | +US$ 34,3 bi |
| Maior superávit em bens, 2025 | Estados Unidos +US$ 6,12 bi |
| Maior déficit em bens, 2025 | China -US$ 18,0 bi |
Comparar a balança comercial de Israel com a de outros países
Fontes:
- TradeMap (2025, atualizado em outubro de 2026)
- Banco Mundial | Economy & Growth (1960–2025, atualizado em outubro de 2026)
Creative Commons Atribuição (CC BY): você pode copiar, compartilhar, adaptar e reutilizar este conteúdo, inclusive para fins comerciais, desde que cite o statistics.wiki e indique as alterações que fizer. As fontes listadas acima podem ter suas próprias condições de licença.