
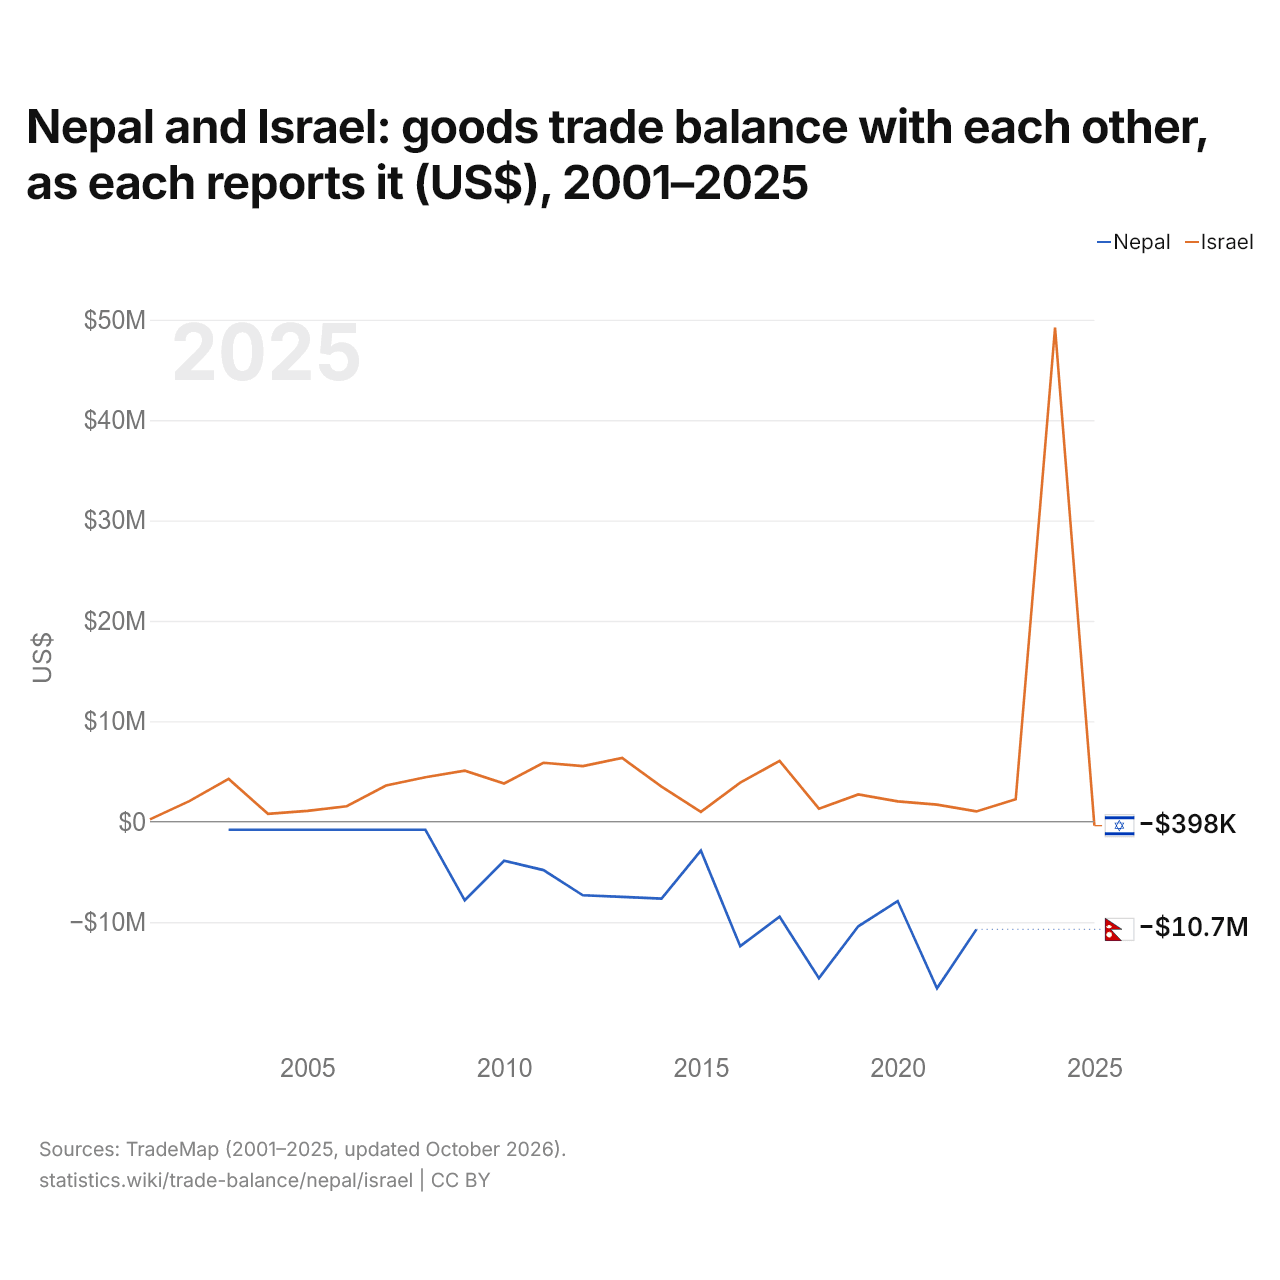
O Nepal e Israel: saldo do comércio de bens entre os dois, segundo cada um (US$), 2001–2025
| Ano | US$ | |
|---|---|---|
| Nepal | Israel | |
| 2025 | - | US$ −398.000 |
| 2024 | - | US$ 49.201.000 |
| 2023 | - | US$ 2.226.000 |
| 2022 | US$ −10.730.000 | US$ 1.019.000 |
| 2021 | US$ −16.598.000 | US$ 1.699.000 |
| 2020 | US$ −7.908.000 | US$ 2.025.000 |
| 2019 | US$ −10.419.000 | US$ 2.714.000 |
| 2018 | US$ −15.589.000 | US$ 1.295.000 |
| 2017 | US$ −9.464.000 | US$ 6.056.000 |
| 2016 | US$ −12.401.000 | US$ 3.882.000 |
| 2015 | US$ −2.883.000 | US$ 982.000 |
| 2014 | US$ −7.663.000 | US$ 3.499.000 |
| 2013 | US$ −7.486.000 | US$ 6.340.000 |
| 2012 | US$ −7.332.000 | US$ 5.538.000 |
| 2011 | US$ −4.823.000 | US$ 5.865.000 |
| 2010 | US$ −3.893.000 | US$ 3.802.000 |
| 2009 | US$ −7.834.000 | US$ 5.083.000 |
| 2008 | US$ −806.000 | US$ 4.428.000 |
| 2007 | US$ −806.000 | US$ 3.602.000 |
| 2006 | US$ −806.000 | US$ 1.536.000 |
| 2005 | US$ −806.000 | US$ 1.074.000 |
| 2004 | US$ −806.000 | US$ 779.000 |
| 2003 | US$ −806.000 | US$ 4.255.000 |
| 2002 | - | US$ 2.044.000 |
| 2001 | - | US$ 231.000 |
Segundo o Nepal, o seu comércio de bens com Israel teve um déficit de US$ 10,7 milhões; segundo Israel, o seu comércio de bens com o Nepal teve um superávit de US$ 1,02 milhão. Em 2003, os valores foram um déficit de US$ 806.000 do Nepal e um superávit de US$ 4,26 milhões de Israel.
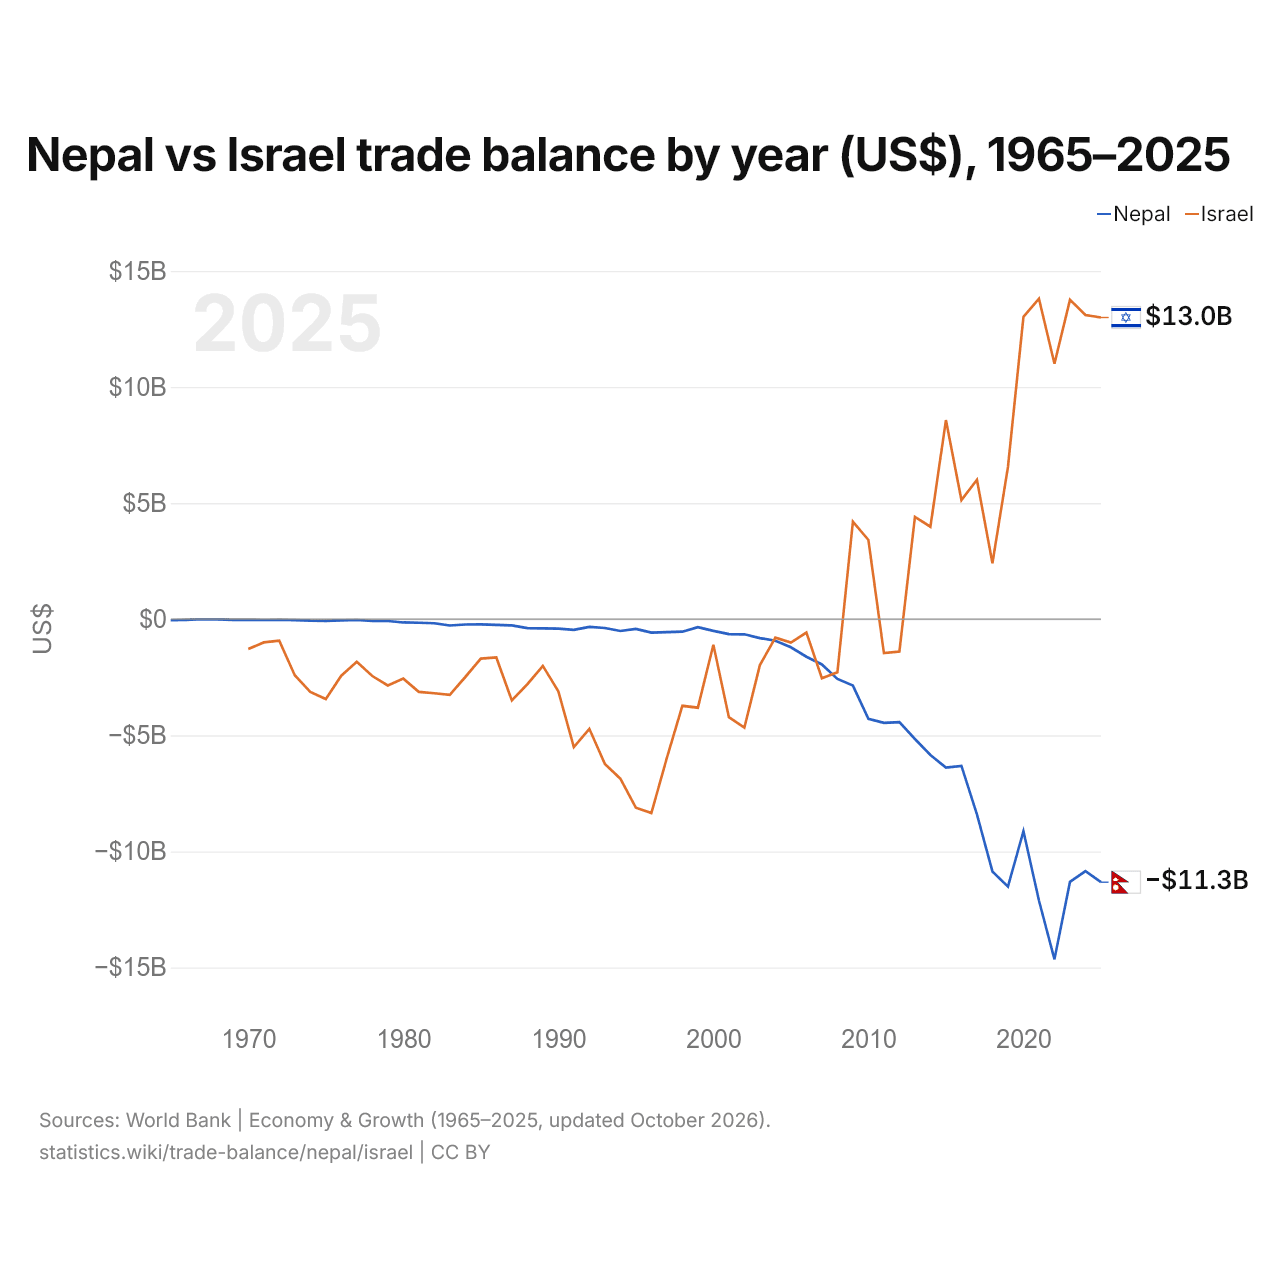
Nepal vs Israel: balança comercial por ano (US$), 1965–2025
| Ano | US$ | |
|---|---|---|
 Nepal |
 Israel |
|
| 2025 | US$ −11.325.496.917 | US$ 12.994.365.505 |
| 2024 | US$ −10.851.375.469 | US$ 13.100.279.099 |
| 2023 | US$ −11.312.462.877 | US$ 13.754.663.733 |
| 2022 | US$ −14.648.203.159 | US$ 11.000.808.302 |
| 2021 | US$ −12.117.057.230 | US$ 13.804.496.055 |
| 2020 | US$ −9.130.156.432 | US$ 13.021.165.408 |
| 2019 | US$ −11.517.205.870 | US$ 6.557.503.906 |
| 2018 | US$ −10.865.912.856 | US$ 2.413.018.727 |
| 2017 | US$ −8.406.985.329 | US$ 6.004.796.901 |
| 2016 | US$ −6.316.510.579 | US$ 5.128.475.225 |
| 2015 | US$ −6.391.434.590 | US$ 8.575.319.326 |
| 2014 | US$ −5.849.879.970 | US$ 3.984.226.053 |
| 2013 | US$ −5.158.487.757 | US$ 4.406.103.796 |
| 2012 | US$ −4.432.060.436 | US$ −1.392.248.402 |
| 2011 | US$ −4.462.444.951 | US$ −1.462.187.515 |
| 2010 | US$ −4.291.885.800 | US$ 3.412.251.219 |
| 2009 | US$ −2.859.043.816 | US$ 4.198.677.110 |
| 2008 | US$ −2.569.878.630 | US$ −2.287.048.495 |
| 2007 | US$ −1.948.231.956 | US$ −2.539.773.861 |
| 2006 | US$ −1.616.003.938 | US$ −575.153.283 |
| 2005 | US$ −1.211.048.644 | US$ −1.009.500.635 |
| 2004 | US$ −929.747.245 | US$ −793.186.301 |
| 2003 | US$ −813.348.972 | US$ −1.975.804.879 |
| 2002 | US$ −650.860.003 | US$ −4.669.753.894 |
| 2001 | US$ −641.455.782 | US$ −4.222.578.168 |
| 2000 | US$ −502.316.491 | US$ −1.098.518.628 |
| 1999 | US$ −345.813.098 | US$ −3.810.722.999 |
| 1998 | US$ −537.368.846 | US$ −3.730.624.984 |
| 1997 | US$ −559.740.487 | US$ −5.975.502.116 |
| 1996 | US$ −579.784.999 | US$ −8.351.877.056 |
| 1995 | US$ −420.050.227 | US$ −8.115.948.262 |
| 1994 | US$ −506.077.551 | US$ −6.867.235.894 |
| 1993 | US$ −377.850.000 | US$ −6.232.770.220 |
| 1992 | US$ −332.501.114 | US$ −4.720.523.362 |
| 1991 | US$ −458.559.867 | US$ −5.509.077.267 |
| 1990 | US$ −403.897.488 | US$ −3.103.552.723 |
| 1989 | US$ −395.379.411 | US$ −2.010.870.382 |
| 1988 | US$ −381.294.038 | US$ −2.800.375.258 |
| 1987 | US$ −268.913.256 | US$ −3.498.185.125 |
| 1986 | US$ −246.320.174 | US$ −1.649.481.113 |
| 1985 | US$ −221.916.059 | US$ −1.698.280.601 |
| 1984 | US$ −227.059.769 | US$ −2.488.666.439 |
| 1983 | US$ −271.247.885 | US$ −3.259.483.986 |
| 1982 | US$ −172.846.486 | US$ −3.188.683.128 |
| 1981 | US$ −152.833.342 | US$ −3.131.228.070 |
| 1980 | US$ −139.916.667 | US$ −2.559.607.843 |
| 1979 | US$ −77.416.683 | US$ −2.851.200.000 |
| 1978 | US$ −78.614.682 | US$ −2.447.647.059 |
| 1977 | US$ −34.960.000 | US$ −1.834.000.000 |
| 1976 | US$ −49.445.265 | US$ −2.433.750.000 |
| 1975 | US$ −70.368.962 | US$ −3.438.333.333 |
| 1974 | US$ −62.095.863 | US$ −3.132.500.000 |
| 1973 | US$ −36.567.171 | US$ −2.412.500.000 |
| 1972 | US$ −23.111.102 | US$ −925.000.000 |
| 1971 | US$ −32.888.889 | US$ −1.000.000.000 |
| 1970 | US$ −29.432.099 | US$ −1.283.333.333 |
| 1969 | US$ −25.283.951 | - |
| 1968 | US$ −5.059.929 | - |
| 1967 | US$ −656.254 | - |
| 1966 | US$ −28.218.926 | - |
| 1965 | US$ −45.281.533 | - |
Em 2025, a balança comercial do Nepal teve um déficit de US$ 11,3 bilhões e a de Israel, um superávit de US$ 13 bilhões. Em 1970, a balança comercial do Nepal teve um déficit de US$ 29,4 milhões e a de Israel, um déficit de US$ 1,28 bilhão.
De 1970 a 2025, a balança comercial do Nepal teve superávit em nenhum dos 56 anos, e a de Israel, em 15. As balanças comerciais do Nepal e de Israel tiveram déficit ao mesmo tempo em 41 desses anos, o mais recente em 2012.
Nepal vs Israel: dados da balança comercial
|
Nepal
|
Israel
|
|
|---|---|---|
| Bens e serviços, US$ | -US$ 11,3 bi (2025) | +US$ 13,0 bi (2025) |
| % do PIB | −24,9% (2025) | +2,1% (2025) |
| Anos com superávit desde 2000 | 0 de 26 | 15 de 26 |
| Saldo de bens entre os dois, dados próprios | -US$ 10,7 mi (2022) | -US$ 398 mil (2025) |
| Maior superávit em bens com | Dinamarca (+US$ 3,63 mi, 2022) | Estados Unidos (+US$ 6,12 bi, 2025) |
| Maior déficit em bens com | Índia (-US$ 7,73 bi, 2022) | China (-US$ 18,0 bi, 2025) |
Comparar a balança comercial de 2 países quaisquer
Fontes:
- Banco Mundial | Economy & Growth (1965–2025, atualizado em outubro de 2026)
- TradeMap (2001–2025, atualizado em outubro de 2026)
Creative Commons Atribuição (CC BY): você pode copiar, compartilhar, adaptar e reutilizar este conteúdo, inclusive para fins comerciais, desde que cite o statistics.wiki e indique as alterações que fizer. As fontes listadas acima podem ter suas próprias condições de licença.