
Nepal vs Israel: importações de bens e serviços por ano (US$), 1965–2025
1x
| Ano | US$ | |
|---|---|---|
 Nepal |
 Israel |
|
| 2025 | US$ 15.341.170.694 | US$ 155.326.013.611 |
| 2024 | US$ 14.122.276.350 | US$ 140.903.132.496 |
| 2023 | US$ 14.188.365.495 | US$ 141.949.720.798 |
| 2022 | US$ 17.408.444.736 | US$ 153.716.570.794 |
| 2021 | US$ 14.007.303.182 | US$ 127.330.211.936 |
| 2020 | US$ 11.405.416.698 | US$ 98.559.641.596 |
| 2019 | US$ 14.176.869.011 | US$ 109.553.655.514 |
| 2018 | US$ 13.453.790.806 | US$ 109.319.594.929 |
| 2017 | US$ 10.670.300.514 | US$ 97.866.153.832 |
| 2016 | US$ 8.322.479.252 | US$ 90.475.144.467 |
| 2015 | US$ 8.879.790.220 | US$ 85.081.011.363 |
| 2014 | US$ 8.151.238.036 | US$ 95.211.692.531 |
| 2013 | US$ 7.218.389.060 | US$ 93.509.987.330 |
| 2012 | US$ 6.331.144.981 | US$ 92.906.239.603 |
| 2011 | US$ 6.146.530.703 | US$ 93.102.471.848 |
| 2010 | US$ 5.825.346.141 | US$ 76.948.241.162 |
| 2009 | US$ 4.455.549.991 | US$ 63.709.559.037 |
| 2008 | US$ 4.172.661.317 | US$ 84.526.756.689 |
| 2007 | US$ 3.275.658.805 | US$ 74.068.549.938 |
| 2006 | US$ 2.832.075.349 | US$ 62.604.628.574 |
| 2005 | US$ 2.396.740.062 | US$ 58.276.695.189 |
| 2004 | US$ 2.143.236.207 | US$ 52.895.820.616 |
| 2003 | US$ 1.807.224.670 | US$ 44.932.193.847 |
| 2002 | US$ 1.724.111.682 | US$ 43.363.108.827 |
| 2001 | US$ 1.996.693.878 | US$ 44.056.142.854 |
| 2000 | US$ 1.781.598.378 | US$ 47.200.194.491 |
| 1999 | US$ 1.495.923.473 | US$ 41.207.853.226 |
| 1998 | US$ 1.645.665.860 | US$ 36.163.743.059 |
| 1997 | US$ 1.854.725.583 | US$ 37.372.736.708 |
| 1996 | US$ 1.611.500.000 | US$ 37.635.231.381 |
| 1995 | US$ 1.519.145.030 | US$ 35.385.120.380 |
| 1994 | US$ 1.278.518.367 | US$ 30.559.356.049 |
| 1993 | US$ 1.052.504.167 | US$ 27.078.766.828 |
| 1992 | US$ 875.325.167 | US$ 24.174.277.988 |
| 1991 | US$ 909.166.931 | US$ 22.534.110.833 |
| 1990 | US$ 785.781.967 | US$ 20.435.071.421 |
| 1989 | US$ 785.537.464 | US$ 17.498.729.910 |
| 1988 | US$ 780.457.946 | US$ 17.261.772.469 |
| 1987 | US$ 618.261.969 | US$ 16.608.825.411 |
| 1986 | US$ 578.786.926 | US$ 12.705.184.837 |
| 1985 | US$ 523.971.555 | US$ 11.785.377.046 |
| 1984 | US$ 502.021.599 | US$ 12.012.629.604 |
| 1983 | US$ 521.619.390 | US$ 12.014.412.811 |
| 1982 | US$ 450.514.044 | US$ 11.726.255.144 |
| 1981 | US$ 446.416.683 | US$ 12.228.947.368 |
| 1980 | US$ 364.500.008 | US$ 11.434.705.882 |
| 1979 | US$ 295.583.342 | US$ 10.380.400.000 |
| 1978 | US$ 248.201.285 | US$ 8.833.529.412 |
| 1977 | US$ 197.919.992 | US$ 7.348.000.000 |
| 1976 | US$ 205.966.282 | US$ 6.588.750.000 |
| 1975 | US$ 210.631.428 | US$ 7.091.666.667 |
| 1974 | US$ 128.470.911 | US$ 6.822.500.000 |
| 1973 | US$ 100.827.881 | US$ 5.057.500.000 |
| 1972 | US$ 81.086.388 | US$ 3.042.500.000 |
| 1971 | US$ 80.592.593 | US$ 2.580.000.000 |
| 1970 | US$ 71.901.235 | US$ 2.800.000.000 |
| 1969 | US$ 80.592.593 | - |
| 1968 | US$ 57.920.044 | - |
| 1967 | US$ 58.537.866 | - |
| 1966 | US$ 79.406.746 | - |
| 1965 | US$ 102.375.640 | - |
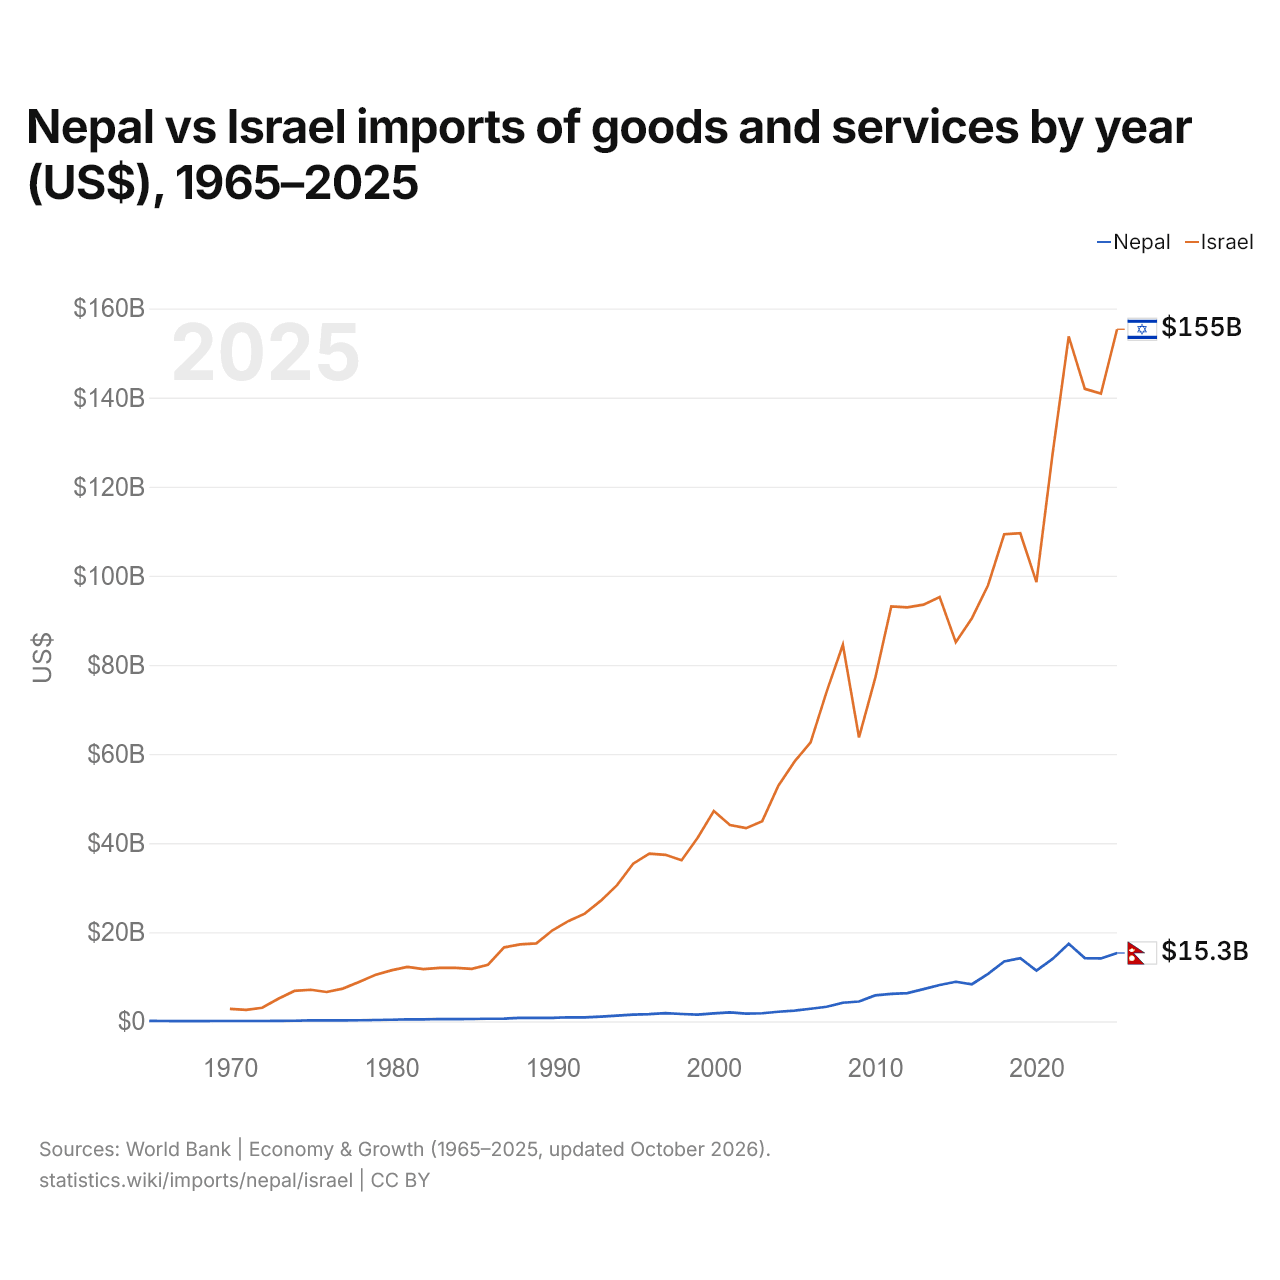
Em 2025, as importações de bens e serviços do Nepal foram de US$ 15,3 bilhões e as de Israel, de US$ 155 bilhões: as de Israel foram 10 vezes maiores. Em 1970, as importações de Israel foram 39 vezes maiores: US$ 71,9 milhões do Nepal e US$ 2,8 bilhões de Israel.
As importações de bens e serviços de Israel têm sido maiores que as do Nepal todos os anos desde 1970.
Nepal vs Israel: dados de importações
|
Nepal
|
Israel
|
|
|---|---|---|
| Importações | US$ 15,3 bi (2025) | US$ 155 bi (2025) |
| Posição mundial | 102/174 | 39/174 |
| Participação mundial | 0,05% | 0,46% |
| % do PIB | 33,7% | 25,4% |
| Maior categoria de bens | Petróleo, gás, minérios e outras matérias-primas (26,9%, 2022) | Máquinas, eletrônicos e veículos (40,1%, 2025) |
| Principal origem dos bens | Índia (63,2%, 2022) | China (21,8%, 2025) |
Comparar as importações de 2 países quaisquer
Fontes:
- Banco Mundial | Economy & Growth (1965–2025, atualizado em outubro de 2026)
- TradeMap (2001–2025, atualizado em outubro de 2026)
Creative Commons Atribuição (CC BY): você pode copiar, compartilhar, adaptar e reutilizar este conteúdo, inclusive para fins comerciais, desde que cite o statistics.wiki e indique as alterações que fizer. As fontes listadas acima podem ter suas próprias condições de licença.