
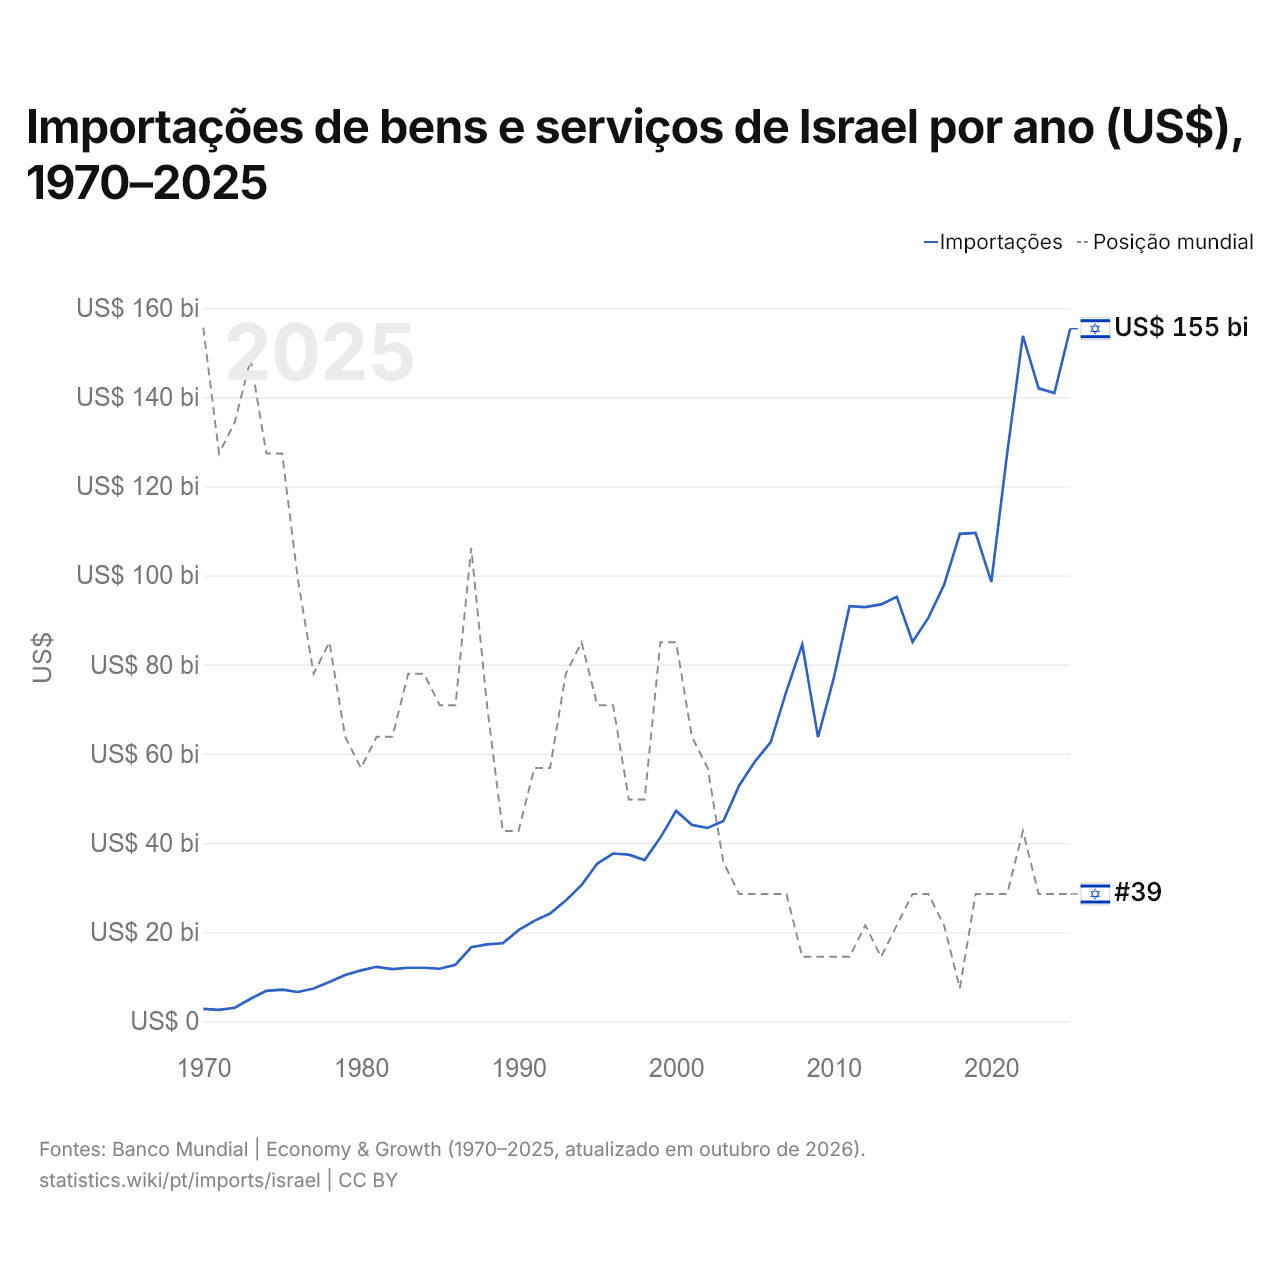
Importações de bens e serviços de Israel por ano (US$), 1970–2025
| Ano | US$ | Posição mundial |
|---|---|---|
| Importações | Posição mundial | |
| 2025 | US$ 155.326.013.611 | #39 |
| 2024 | US$ 140.903.132.496 | #39 |
| 2023 | US$ 141.949.720.798 | #39 |
| 2022 | US$ 153.716.570.794 | #37 |
| 2021 | US$ 127.330.211.936 | #39 |
| 2020 | US$ 98.559.641.596 | #39 |
| 2019 | US$ 109.553.655.514 | #39 |
| 2018 | US$ 109.319.594.929 | #42 |
| 2017 | US$ 97.866.153.832 | #40 |
| 2016 | US$ 90.475.144.467 | #39 |
| 2015 | US$ 85.081.011.363 | #39 |
| 2014 | US$ 95.211.692.531 | #40 |
| 2013 | US$ 93.509.987.330 | #41 |
| 2012 | US$ 92.906.239.603 | #40 |
| 2011 | US$ 93.102.471.848 | #41 |
| 2010 | US$ 76.948.241.162 | #41 |
| 2009 | US$ 63.709.559.037 | #41 |
| 2008 | US$ 84.526.756.689 | #41 |
| 2007 | US$ 74.068.549.938 | #39 |
| 2006 | US$ 62.604.628.574 | #39 |
| 2005 | US$ 58.276.695.189 | #39 |
| 2004 | US$ 52.895.820.616 | #39 |
| 2003 | US$ 44.932.193.847 | #38 |
| 2002 | US$ 43.363.108.827 | #35 |
| 2001 | US$ 44.056.142.854 | #34 |
| 2000 | US$ 47.200.194.491 | #31 |
| 1999 | US$ 41.207.853.226 | #31 |
| 1998 | US$ 36.163.743.059 | #36 |
| 1997 | US$ 37.372.736.708 | #36 |
| 1996 | US$ 37.635.231.381 | #33 |
| 1995 | US$ 35.385.120.380 | #33 |
| 1994 | US$ 30.559.356.049 | #31 |
| 1993 | US$ 27.078.766.828 | #32 |
| 1992 | US$ 24.174.277.988 | #35 |
| 1991 | US$ 22.534.110.833 | #35 |
| 1990 | US$ 20.435.071.421 | #37 |
| 1989 | US$ 17.498.729.910 | #37 |
| 1988 | US$ 17.261.772.469 | #33 |
| 1987 | US$ 16.608.825.411 | #28 |
| 1986 | US$ 12.705.184.837 | #33 |
| 1985 | US$ 11.785.377.046 | #33 |
| 1984 | US$ 12.012.629.604 | #32 |
| 1983 | US$ 12.014.412.811 | #32 |
| 1982 | US$ 11.726.255.144 | #34 |
| 1981 | US$ 12.228.947.368 | #34 |
| 1980 | US$ 11.434.705.882 | #35 |
| 1979 | US$ 10.380.400.000 | #34 |
| 1978 | US$ 8.833.529.412 | #31 |
| 1977 | US$ 7.348.000.000 | #32 |
| 1976 | US$ 6.588.750.000 | #29 |
| 1975 | US$ 7.091.666.667 | #25 |
| 1974 | US$ 6.822.500.000 | #25 |
| 1973 | US$ 5.057.500.000 | #22 |
| 1972 | US$ 3.042.500.000 | #24 |
| 1971 | US$ 2.580.000.000 | #25 |
| 1970 | US$ 2.800.000.000 | #21 |
Em 2025, as importações de bens e serviços de Israel foram de US$ 155 bilhões, ante US$ 2,8 bilhões em 1970. O mínimo foi de US$ 2,58 bilhões, em 1971. Foram as 39ª maiores do mundo, posição que mantêm desde 2023. Sua melhor posição foi o 21º lugar, ocupado pela última vez em 1970.
Em 2025, as importações de bens e serviços de Israel foram as 15ª maiores de 44 países da Ásia. Em 2025, as exportações de Israel superaram as importações em US$ 13 bilhões, um superávit comercial. O comércio de Israel, exportações e importações somadas, equivaleu a 53,0% do seu PIB em 2025, o 128º lugar do mundo.
Importações de bens de Israel por categoria, 2025
Importações de bens, 2025: US$ 95,5 bi
Em 2025, a maior categoria das importações de bens de Israel foi máquinas, eletrônicos e veículos, com 40,1%, seguida de produtos químicos, farmacêuticos e plásticos, com 12,5%.
Origens das importações de bens de Israel: as 10 principais, 2025
| Posição | País | Importações de bens | Participação | |
|---|---|---|---|---|
| 1 |
 China |
US$ 20,8 bi | 21,8% | vs China |
| 2 |
 Estados Unidos |
US$ 9,99 bi | 10,5% | vs EUA |
| 3 |
 Alemanha |
US$ 5,92 bi | 6,2% | vs Alemanha |
| 4 |
 Itália |
US$ 4,05 bi | 4,24% | vs Itália |
| 5 |
 Coreia do Sul |
US$ 2,52 bi | 2,64% | vs Coreia do Sul |
| 6 |
 França |
US$ 2,43 bi | 2,54% | vs França |
| 7 |
 Rússia |
US$ 2,36 bi | 2,47% | vs Rússia |
| 8 |
 Índia |
US$ 2,20 bi | 2,31% | vs Índia |
| 9 |
 Reino Unido |
US$ 2,12 bi | 2,22% | vs RU |
| 10 |
 Turquia |
US$ 2,12 bi | 2,22% | vs Turquia |
| Outros parceiros e não especificados | US$ 41,0 bi | 42,9% |
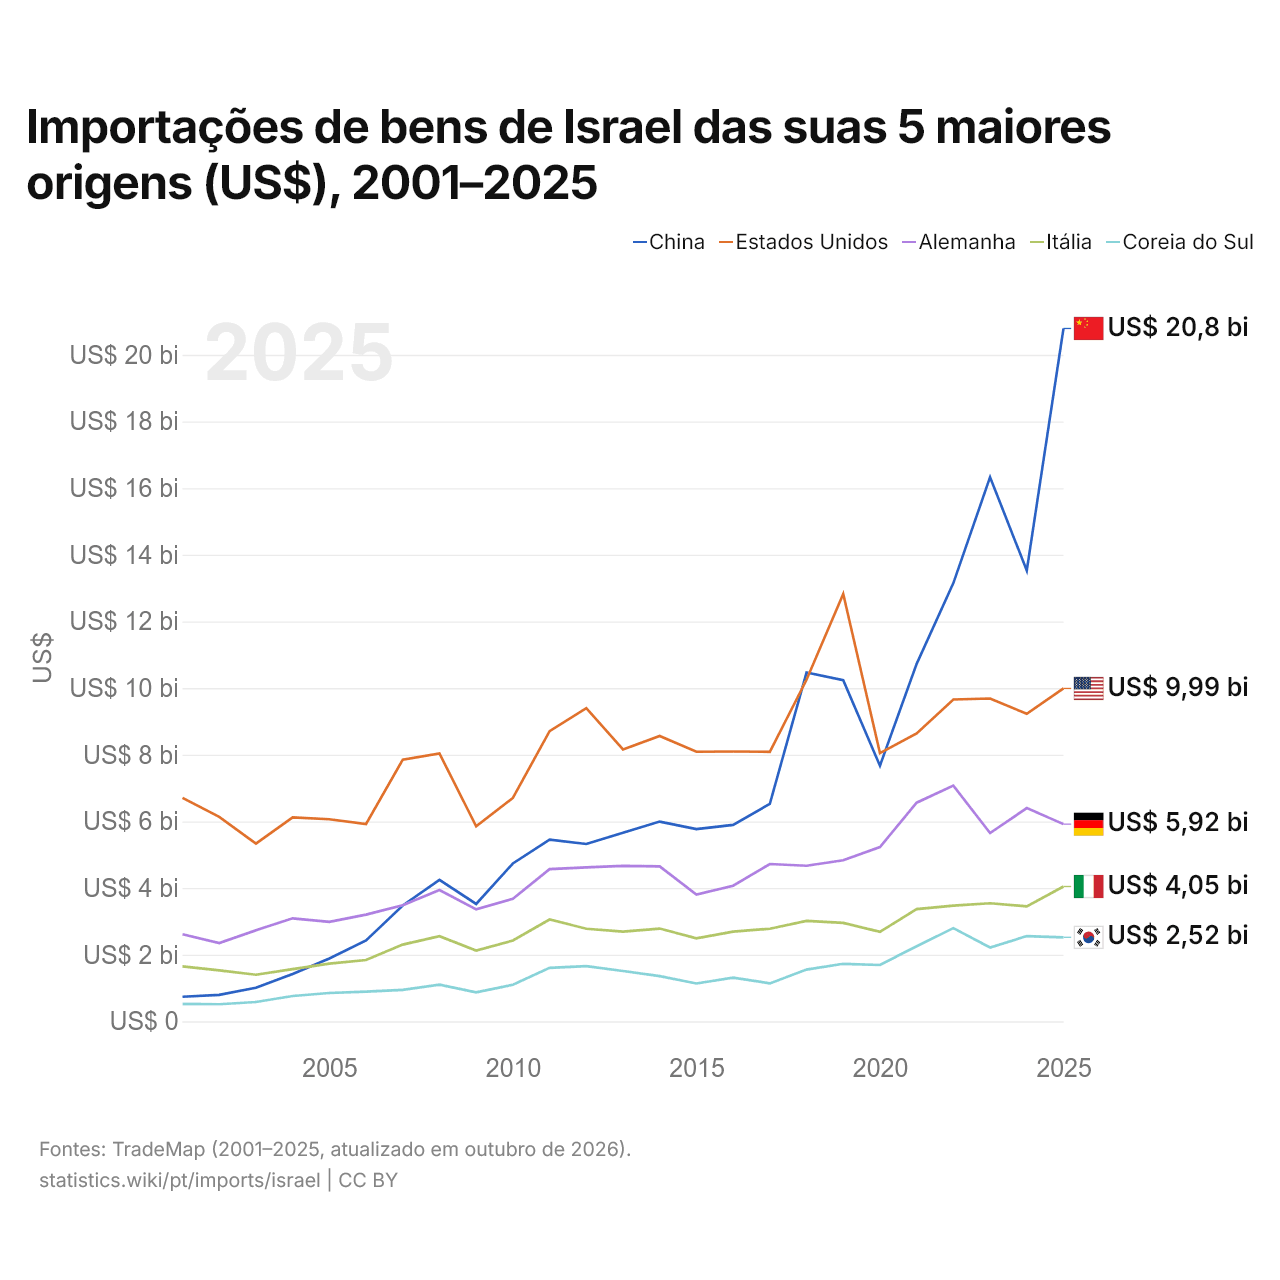
Importações de bens de Israel das suas 5 maiores origens (US$), 2001–2025
| Ano | US$ | ||||
|---|---|---|---|---|---|
| China | Estados Unidos | Alemanha | Itália | Coreia do Sul | |
| 2025 | US$ 20.791.702.000 | US$ 9.988.847.000 | US$ 5.917.205.000 | US$ 4.045.801.000 | US$ 2.519.833.000 |
| 2024 | US$ 13.529.225.000 | US$ 9.227.724.000 | US$ 6.399.278.000 | US$ 3.450.622.000 | US$ 2.558.459.000 |
| 2023 | US$ 16.329.326.000 | US$ 9.686.393.000 | US$ 5.648.600.000 | US$ 3.542.325.000 | US$ 2.215.262.000 |
| 2022 | US$ 13.150.818.000 | US$ 9.656.860.000 | US$ 7.075.418.000 | US$ 3.472.366.000 | US$ 2.796.623.000 |
| 2021 | US$ 10.728.046.000 | US$ 8.638.151.000 | US$ 6.560.507.000 | US$ 3.366.722.000 | US$ 2.251.038.000 |
| 2020 | US$ 7.669.910.000 | US$ 8.048.471.000 | US$ 5.229.868.000 | US$ 2.683.986.000 | US$ 1.690.818.000 |
| 2019 | US$ 10.234.885.000 | US$ 12.824.778.000 | US$ 4.832.667.000 | US$ 2.954.177.000 | US$ 1.726.570.000 |
| 2018 | US$ 10.465.960.000 | US$ 10.249.855.000 | US$ 4.668.080.000 | US$ 3.016.039.000 | US$ 1.552.588.000 |
| 2017 | US$ 6.527.398.000 | US$ 8.087.035.000 | US$ 4.721.171.000 | US$ 2.777.979.000 | US$ 1.138.812.000 |
| 2016 | US$ 5.896.145.000 | US$ 8.097.674.000 | US$ 4.069.373.000 | US$ 2.693.693.000 | US$ 1.313.200.000 |
| 2015 | US$ 5.768.087.000 | US$ 8.089.169.000 | US$ 3.806.930.000 | US$ 2.490.715.000 | US$ 1.135.717.000 |
| 2014 | US$ 5.994.138.000 | US$ 8.564.065.000 | US$ 4.651.256.000 | US$ 2.784.123.000 | US$ 1.354.780.000 |
| 2013 | US$ 5.660.266.000 | US$ 8.159.492.000 | US$ 4.666.311.000 | US$ 2.692.791.000 | US$ 1.510.665.000 |
| 2012 | US$ 5.322.251.000 | US$ 9.399.851.000 | US$ 4.621.142.000 | US$ 2.779.486.000 | US$ 1.657.942.000 |
| 2011 | US$ 5.450.510.000 | US$ 8.707.597.000 | US$ 4.566.236.000 | US$ 3.055.846.000 | US$ 1.603.920.000 |
| 2010 | US$ 4.736.872.000 | US$ 6.703.326.000 | US$ 3.678.710.000 | US$ 2.425.853.000 | US$ 1.099.106.000 |
| 2009 | US$ 3.520.889.000 | US$ 5.851.090.000 | US$ 3.361.291.000 | US$ 2.126.049.000 | US$ 867.860.000 |
| 2008 | US$ 4.244.011.000 | US$ 8.038.515.000 | US$ 3.940.281.000 | US$ 2.553.908.000 | US$ 1.100.247.000 |
| 2007 | US$ 3.476.900.000 | US$ 7.852.349.000 | US$ 3.483.373.000 | US$ 2.302.005.000 | US$ 942.512.000 |
| 2006 | US$ 2.427.841.000 | US$ 5.920.428.000 | US$ 3.201.262.000 | US$ 1.839.541.000 | US$ 890.486.000 |
| 2005 | US$ 1.888.243.000 | US$ 6.064.846.000 | US$ 2.987.036.000 | US$ 1.733.660.000 | US$ 851.321.000 |
| 2004 | US$ 1.418.456.000 | US$ 6.119.649.000 | US$ 3.090.267.000 | US$ 1.565.499.000 | US$ 759.864.000 |
| 2003 | US$ 1.008.094.000 | US$ 5.331.739.000 | US$ 2.730.943.000 | US$ 1.398.188.000 | US$ 579.769.000 |
| 2002 | US$ 793.272.000 | US$ 6.134.173.000 | US$ 2.347.762.000 | US$ 1.530.526.000 | US$ 512.440.000 |
| 2001 | US$ 737.305.000 | US$ 6.704.515.000 | US$ 2.614.775.000 | US$ 1.650.887.000 | US$ 523.612.000 |
Em 2025, as importações de bens foram de US$ 20,8 bilhões da China, US$ 9,99 bilhões dos Estados Unidos, US$ 5,92 bilhões da Alemanha, US$ 4,05 bilhões da Itália e US$ 2,52 bilhões da Coreia do Sul. O primeiro lugar dos cinco fornecedores de Israel fica com a China desde 2021.
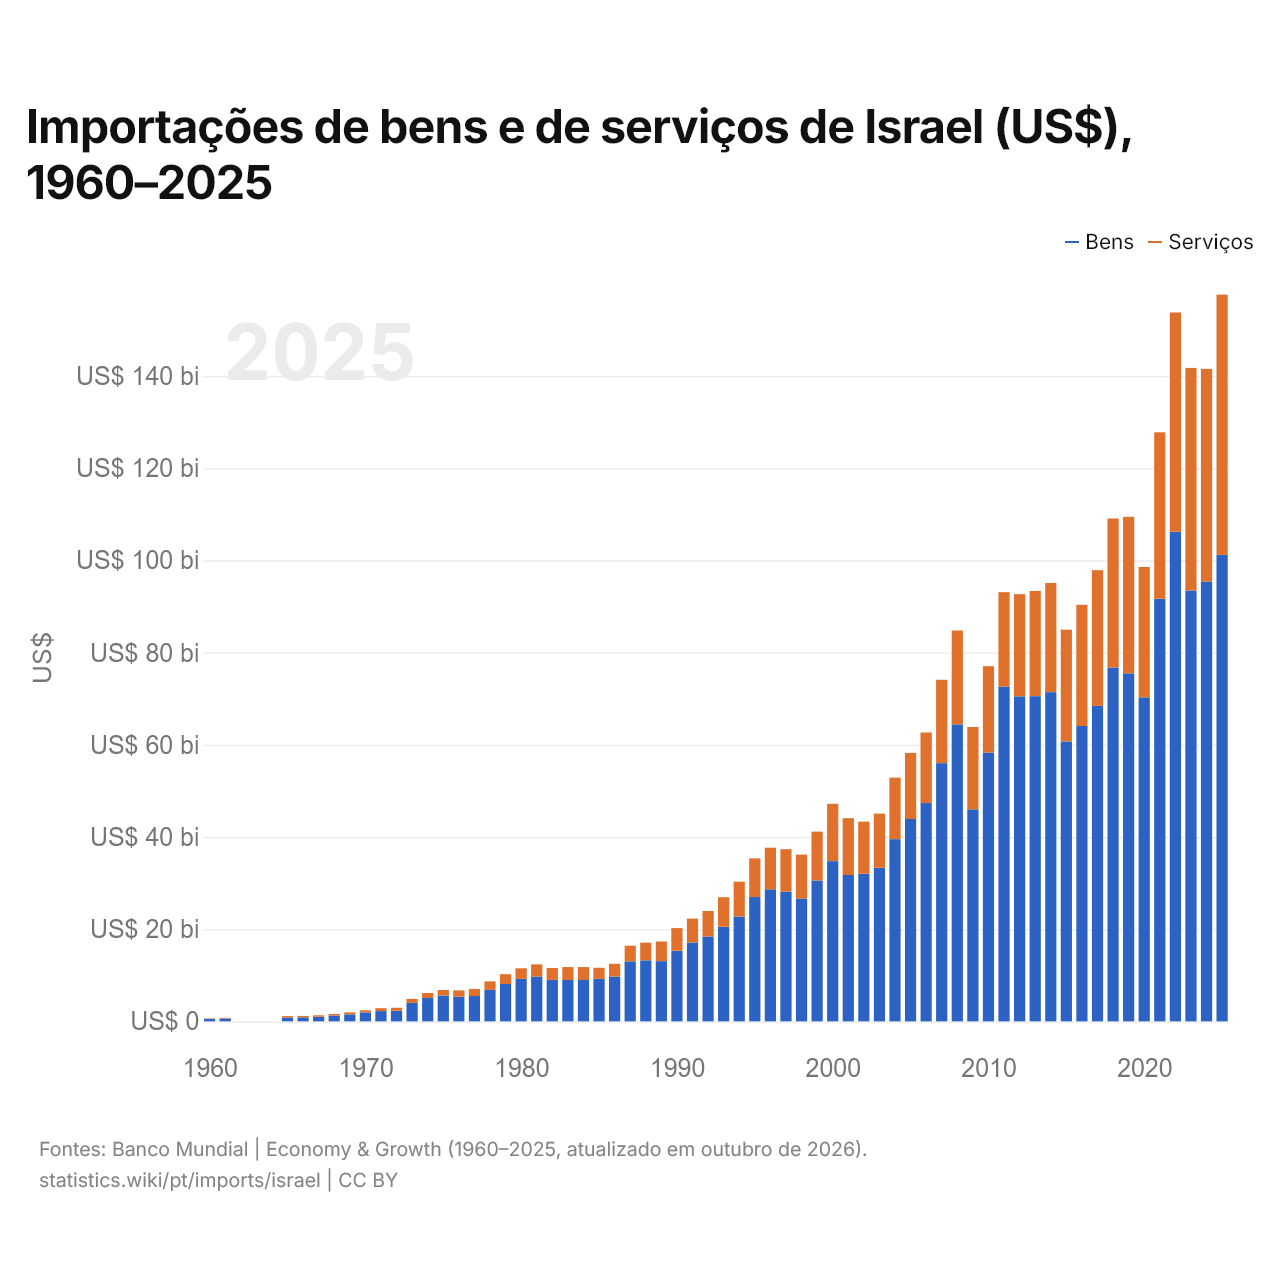
Importações de bens e de serviços de Israel (US$), 1960–2025
| Ano | US$ | |
|---|---|---|
| Bens | Serviços | |
| 2025 | US$ 101.170.900.000 | US$ 56.456.700.000 |
| 2024 | US$ 95.398.500.000 | US$ 46.139.000.000 |
| 2023 | US$ 93.462.500.000 | US$ 48.270.800.000 |
| 2022 | US$ 106.210.900.000 | US$ 47.558.200.000 |
| 2021 | US$ 91.673.600.000 | US$ 36.103.600.000 |
| 2020 | US$ 70.289.300.000 | US$ 28.279.700.000 |
| 2019 | US$ 75.492.100.000 | US$ 33.944.100.000 |
| 2018 | US$ 76.761.500.000 | US$ 32.298.800.000 |
| 2017 | US$ 68.416.400.000 | US$ 29.436.300.000 |
| 2016 | US$ 64.071.600.000 | US$ 26.291.400.000 |
| 2015 | US$ 60.726.800.000 | US$ 24.227.600.000 |
| 2014 | US$ 71.407.600.000 | US$ 23.677.700.000 |
| 2013 | US$ 70.537.900.000 | US$ 22.806.700.000 |
| 2012 | US$ 70.498.900.000 | US$ 22.156.600.000 |
| 2011 | US$ 72.636.500.000 | US$ 20.453.900.000 |
| 2010 | US$ 58.288.000.000 | US$ 18.736.500.000 |
| 2009 | US$ 46.001.500.000 | US$ 17.838.700.000 |
| 2008 | US$ 64.437.700.000 | US$ 20.333.900.000 |
| 2007 | US$ 56.005.300.000 | US$ 18.076.500.000 |
| 2006 | US$ 47.350.000.000 | US$ 15.301.900.000 |
| 2005 | US$ 43.887.100.000 | US$ 14.337.000.000 |
| 2004 | US$ 39.507.400.000 | US$ 13.358.600.000 |
| 2003 | US$ 33.315.800.000 | US$ 11.728.900.000 |
| 2002 | US$ 31.992.200.000 | US$ 11.327.100.000 |
| 2001 | US$ 31.737.900.000 | US$ 12.332.400.000 |
| 2000 | US$ 34.747.200.000 | US$ 12.435.300.000 |
| 1999 | US$ 30.566.100.000 | US$ 10.583.800.000 |
| 1998 | US$ 26.617.900.000 | US$ 9.537.900.000 |
| 1997 | US$ 28.156.400.000 | US$ 9.183.200.000 |
| 1996 | US$ 28.654.100.000 | US$ 9.008.400.000 |
| 1995 | US$ 26.963.900.000 | US$ 8.392.500.000 |
| 1994 | US$ 22.727.600.000 | US$ 7.589.700.000 |
| 1993 | US$ 20.532.600.000 | US$ 6.397.400.000 |
| 1992 | US$ 18.389.400.000 | US$ 5.544.500.000 |
| 1991 | US$ 17.093.300.000 | US$ 5.178.100.000 |
| 1990 | US$ 15.306.900.000 | US$ 4.921.100.000 |
| 1989 | US$ 13.047.200.000 | US$ 4.276.000.000 |
| 1988 | US$ 13.240.500.000 | US$ 3.826.500.000 |
| 1987 | US$ 13.017.800.000 | US$ 3.389.900.000 |
| 1986 | US$ 9.734.500.000 | US$ 2.741.100.000 |
| 1985 | US$ 9.201.800.000 | US$ 2.404.000.000 |
| 1984 | US$ 8.958.700.000 | US$ 2.806.800.000 |
| 1983 | US$ 8.971.300.000 | US$ 2.798.600.000 |
| 1982 | US$ 8.986.400.000 | US$ 2.586.200.000 |
| 1981 | US$ 9.693.800.000 | US$ 2.663.200.000 |
| 1980 | US$ 9.201.000.000 | US$ 2.310.000.000 |
| 1979 | US$ 8.088.000.000 | US$ 2.133.000.000 |
| 1978 | US$ 6.814.000.000 | US$ 1.851.000.000 |
| 1977 | US$ 5.484.000.000 | US$ 1.538.000.000 |
| 1976 | US$ 5.345.000.000 | US$ 1.365.000.000 |
| 1975 | US$ 5.600.000.000 | US$ 1.198.000.000 |
| 1974 | US$ 5.060.000.000 | US$ 1.092.000.000 |
| 1973 | US$ 3.987.000.000 | US$ 880.000.000 |
| 1972 | US$ 2.307.000.000 | US$ 634.000.000 |
| 1971 | US$ 2.224.000.000 | US$ 632.000.000 |
| 1970 | US$ 1.944.000.000 | US$ 453.000.000 |
| 1969 | US$ 1.528.000.000 | US$ 423.000.000 |
| 1968 | US$ 1.265.000.000 | US$ 342.000.000 |
| 1967 | US$ 977.000.000 | US$ 340.000.000 |
| 1966 | US$ 865.000.000 | US$ 305.000.000 |
| 1965 | US$ 840.000.000 | US$ 288.000.000 |
| 1964 | - | - |
| 1963 | - | - |
| 1962 | - | - |
| 1961 | US$ 606.000.000 | US$ 151.000.000 |
| 1960 | US$ 493.000.000 | US$ 120.000.000 |
Em 2025, as importações de bens de Israel foram de US$ 101 bilhões e as de serviços, de US$ 56,5 bilhões; os serviços representaram 35,8% do total, ante 19,6% em 1960.
Israel na classificação mundial de importações, 2025
| Posição | País | Importações | Participação mundial | |
|---|---|---|---|---|
| 36 |
 Romênia |
US$ 175 bi | 0,52% | |
| 37 |
 Hungria |
US$ 168 bi | 0,5% | vs Hungria |
| 38 |
 Luxemburgo |
US$ 161 bi | 0,48% | vs Luxemburgo |
| 39 |
 Israel |
US$ 155 bi | 0,46% | |
| 40 |
 Portugal |
US$ 148 bi | 0,44% | vs Portugal |
| 41 |
 Eslováquia |
US$ 132 bi | 0,39% | |
| 42 |
 Finlândia |
US$ 130 bi | 0,39% |
Importações de bens e serviços de Israel, % do PIB, 1970–2025
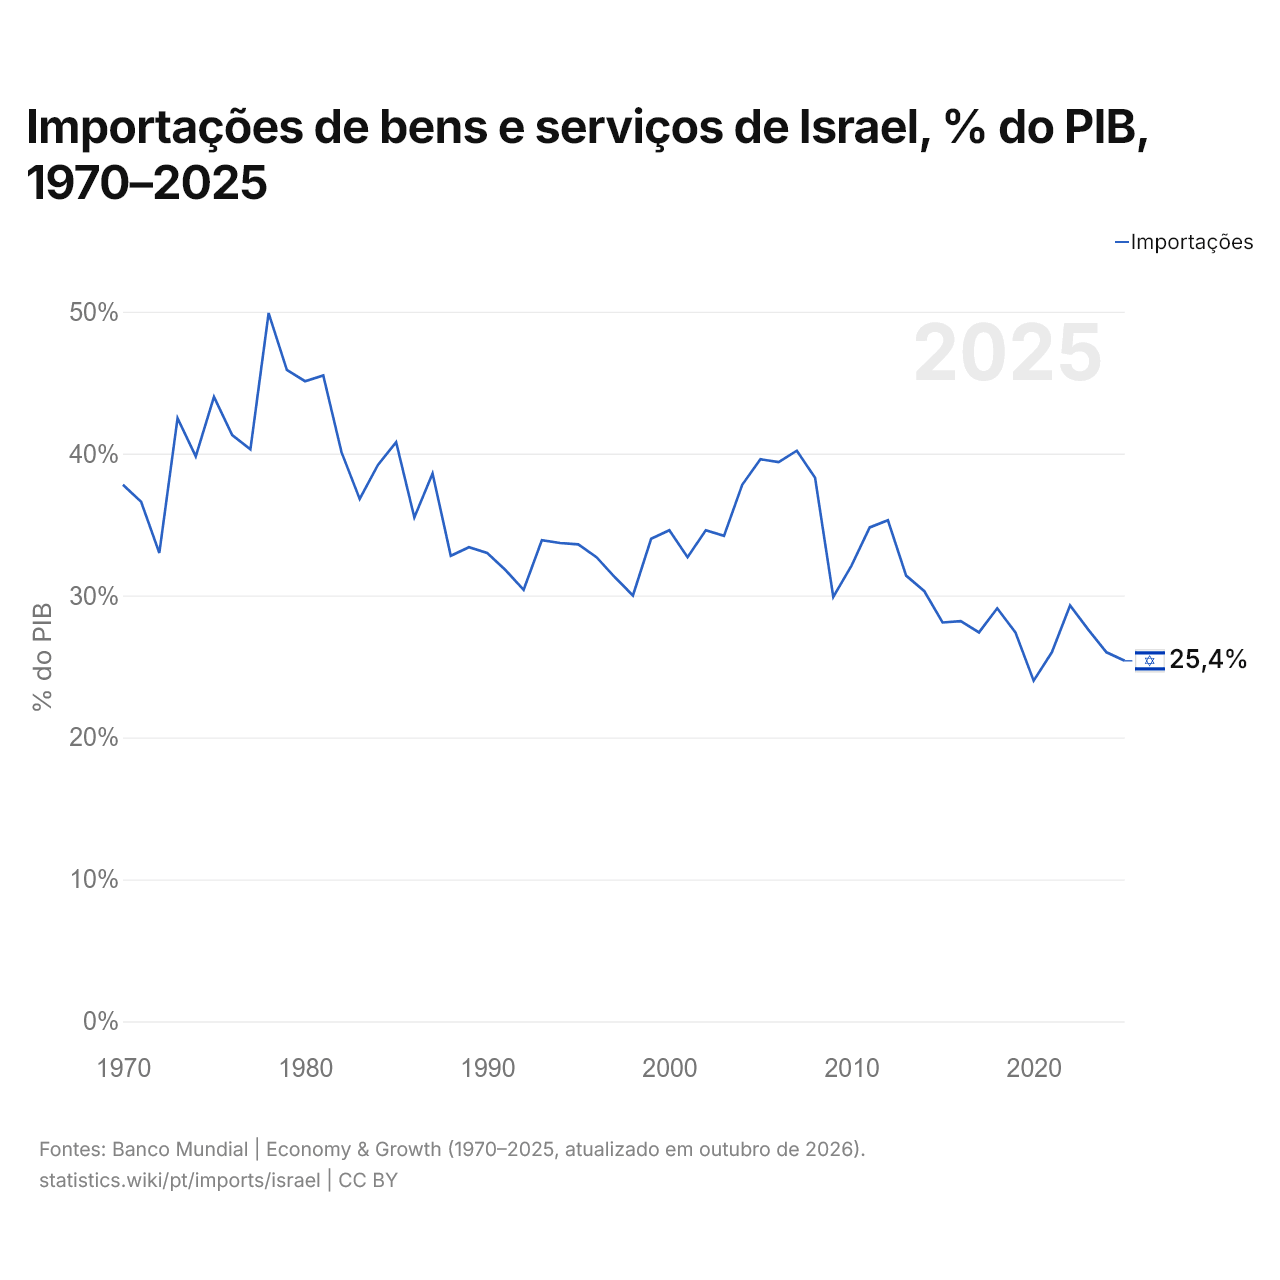
Em 2025, as importações de bens e serviços de Israel equivaleram a 25,4% do seu PIB, ante 37,8% em 1970. A maior participação foi de 49,9%, em 1978.
Comparar as importações de Israel com as de outros países
Fontes:
- Banco Mundial | Economy & Growth (1960–2025, atualizado em outubro de 2026)
- TradeMap (2001–2025, atualizado em outubro de 2026)
Creative Commons Atribuição (CC BY): você pode copiar, compartilhar, adaptar e reutilizar este conteúdo, inclusive para fins comerciais, desde que cite o statistics.wiki e indique as alterações que fizer. As fontes listadas acima podem ter suas próprias condições de licença.