
Importações de bens e serviços da Coreia do Sul por ano (US$), 1960–2025
| Ano | US$ | Posição mundial |
|---|---|---|
| Importações | Posição mundial | |
| 2025 | US$ 760.157.311.935 | #11 |
| 2024 | US$ 755.486.201.522 | #10 |
| 2023 | US$ 755.197.457.230 | #9 |
| 2022 | US$ 814.936.711.591 | #9 |
| 2021 | US$ 698.601.348.291 | #9 |
| 2020 | US$ 539.436.709.934 | #8 |
| 2019 | US$ 602.460.189.255 | #8 |
| 2018 | US$ 643.142.886.152 | #8 |
| 2017 | US$ 587.337.161.919 | #8 |
| 2016 | US$ 501.960.383.970 | #9 |
| 2015 | US$ 529.797.582.127 | #9 |
| 2014 | US$ 640.345.541.583 | #7 |
| 2013 | US$ 644.649.663.351 | #7 |
| 2012 | US$ 660.911.494.403 | #7 |
| 2011 | US$ 658.770.946.515 | #7 |
| 2010 | US$ 510.006.485.309 | #9 |
| 2009 | US$ 389.431.370.553 | #10 |
| 2008 | US$ 504.705.472.100 | #10 |
| 2007 | US$ 430.767.883.126 | #11 |
| 2006 | US$ 371.584.656.529 | #11 |
| 2005 | US$ 311.368.128.261 | #11 |
| 2004 | US$ 266.051.158.489 | #11 |
| 2003 | US$ 211.120.763.751 | #11 |
| 2002 | US$ 180.702.673.025 | #12 |
| 2001 | US$ 167.799.772.362 | #12 |
| 2000 | US$ 186.383.219.529 | #12 |
| 1999 | US$ 136.054.279.857 | #15 |
| 1998 | US$ 111.609.107.996 | #16 |
| 1997 | US$ 167.463.480.086 | #9 |
| 1996 | US$ 173.342.318.317 | #9 |
| 1995 | US$ 154.227.820.411 | #10 |
| 1994 | US$ 116.128.928.672 | #10 |
| 1993 | US$ 91.538.648.223 | #15 |
| 1992 | US$ 87.861.307.514 | #14 |
| 1991 | US$ 86.243.424.554 | #12 |
| 1990 | US$ 73.079.706.490 | #13 |
| 1989 | US$ 63.184.948.287 | #15 |
| 1988 | US$ 52.389.830.154 | #14 |
| 1987 | US$ 41.753.533.905 | #14 |
| 1986 | US$ 32.919.918.017 | #14 |
| 1985 | US$ 26.160.433.093 | #17 |
| 1984 | US$ 27.795.127.347 | #16 |
| 1983 | US$ 26.387.424.890 | #17 |
| 1982 | US$ 25.783.350.263 | #18 |
| 1981 | US$ 27.162.601.026 | #18 |
| 1980 | US$ 24.291.587.954 | #19 |
| 1979 | US$ 20.687.809.917 | #16 |
| 1978 | US$ 15.192.975.207 | #20 |
| 1977 | US$ 10.721.900.826 | #22 |
| 1976 | US$ 8.480.785.124 | #24 |
| 1975 | US$ 6.827.892.562 | #27 |
| 1974 | US$ 6.511.196.682 | #26 |
| 1973 | US$ 3.839.358.990 | #30 |
| 1972 | US$ 2.330.143.840 | #32 |
| 1971 | US$ 2.280.298.720 | #28 |
| 1970 | US$ 1.902.717.644 | #29 |
| 1969 | US$ 1.724.037.412 | - |
| 1968 | US$ 1.385.168.718 | - |
| 1967 | US$ 955.578.713 | - |
| 1966 | US$ 715.713.825 | - |
| 1965 | US$ 447.070.730 | - |
| 1964 | US$ 428.344.230 | - |
| 1963 | US$ 584.615.385 | - |
| 1962 | US$ 439.230.769 | - |
| 1961 | US$ 337.362.180 | - |
| 1960 | US$ 473.663.366 | - |
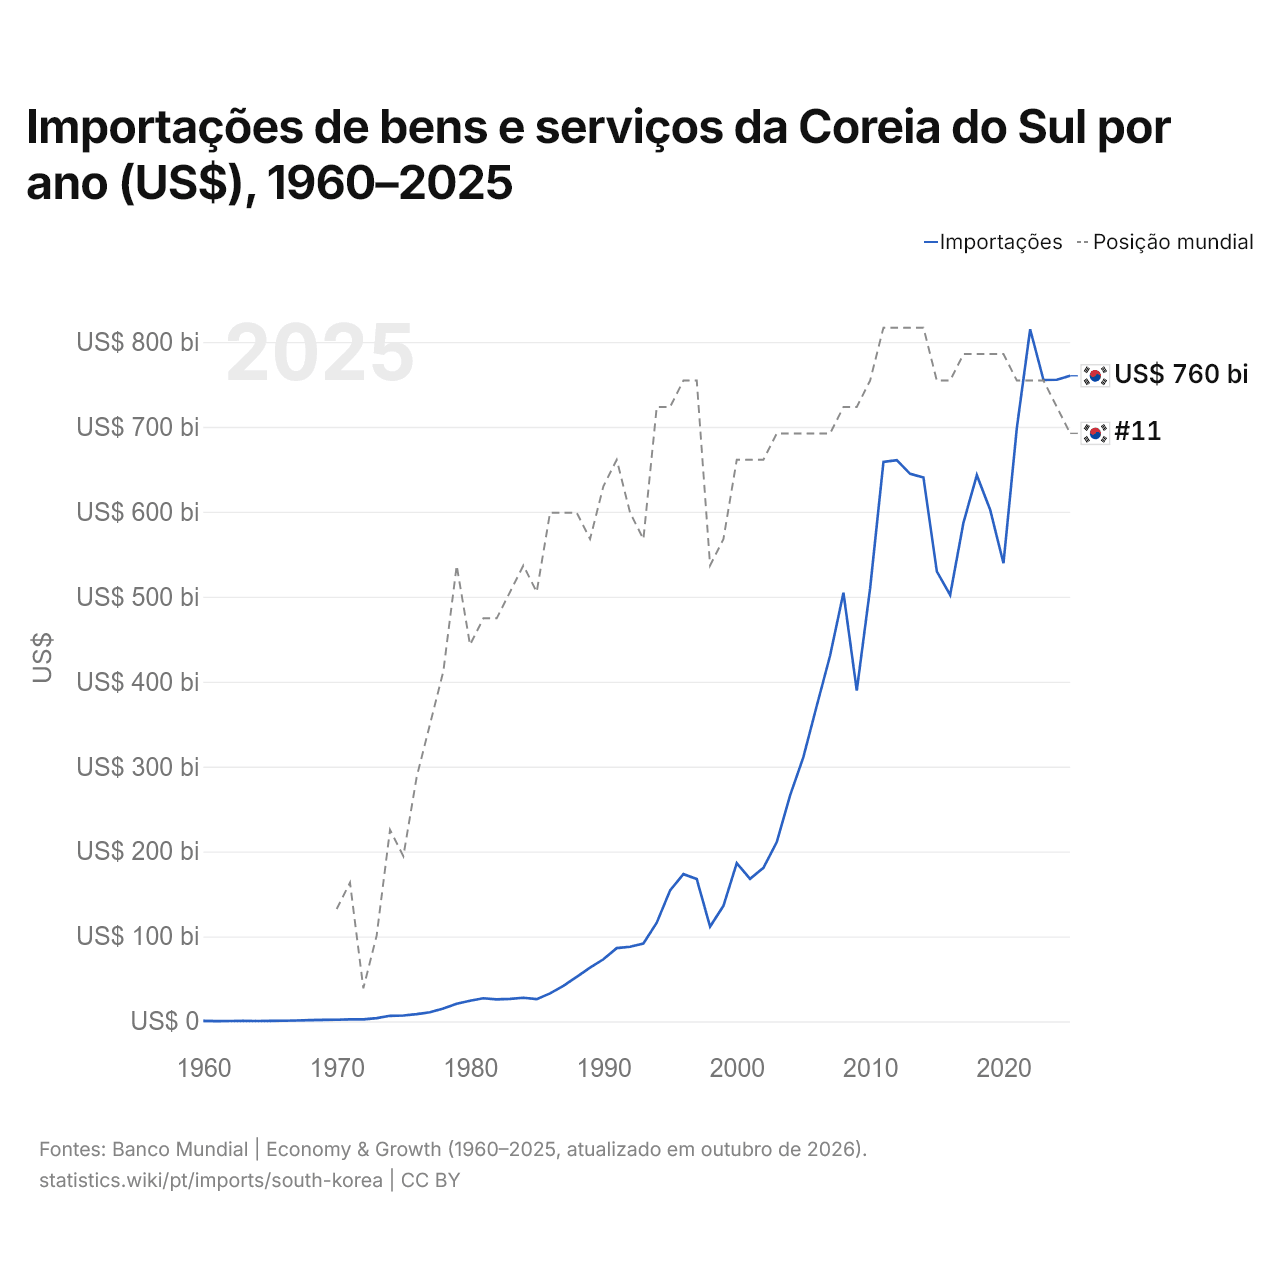
Em 2025, as importações de bens e serviços da Coreia do Sul foram de US$ 760 bilhões, ante US$ 474 milhões em 1960. O máximo foi de US$ 815 bilhões, em 2022. Foram as 11ª maiores do mundo; em 2024, eram as 10ª. Sua melhor posição foi o 7º lugar, ocupado pela última vez em 2014.
Em 2025, as importações de bens e serviços da Coreia do Sul foram as 5ª maiores de 44 países da Ásia. Em 2025, as exportações da Coreia do Sul superaram as importações em US$ 96,7 bilhões, um superávit comercial. O comércio da Coreia do Sul, exportações e importações somadas, equivaleu a 86,4% do seu PIB em 2025, o 78º lugar do mundo.
Importações de bens da Coreia do Sul por categoria, 2025
Importações de bens, 2025: US$ 632 bi
Em 2025, a maior categoria das importações de bens da Coreia do Sul foi máquinas, eletrônicos e veículos, com 40,5%, seguida de petróleo, gás, minérios e outras matérias-primas, com 28,1%.
Origens das importações de bens da Coreia do Sul: as 10 principais, 2025
| Posição | País | Importações de bens | Participação | |
|---|---|---|---|---|
| 1 |
 China |
US$ 142 bi | 22,5% | vs China |
| 2 |
 Estados Unidos |
US$ 73,7 bi | 11,7% | |
| 3 |
 Japão |
US$ 48,9 bi | 7,74% | vs Japão |
| 4 |
 Austrália |
US$ 32,1 bi | 5,08% | vs Austrália |
| 5 |
 Vietnã |
US$ 31,8 bi | 5,03% | vs Vietnã |
| 6 |
 Arábia Saudita |
US$ 27,4 bi | 4,34% | vs Arábia Saudita |
| 7 |
 Alemanha |
US$ 21,6 bi | 3,42% | vs Alemanha |
| 8 |
 Malásia |
US$ 15,5 bi | 2,46% | vs Malásia |
| 9 |
 EAU |
US$ 14,1 bi | 2,23% | |
| 10 |
 Singapura |
US$ 11,4 bi | 1,8% | vs Singapura |
| Outros parceiros e não especificados | US$ 213 bi | 33,7% |
Importações de bens da Coreia do Sul das suas 5 maiores origens (US$), 2001–2025
| Ano | US$ | ||||
|---|---|---|---|---|---|
| China | Estados Unidos | Japão | Austrália | Vietnã | |
| 2025 | US$ 141.927.229.000 | US$ 73.711.445.000 | US$ 48.895.796.000 | US$ 32.074.812.000 | US$ 31.772.392.000 |
| 2024 | US$ 139.867.768.000 | US$ 72.479.284.000 | US$ 47.898.729.000 | US$ 29.955.851.000 | US$ 28.440.674.000 |
| 2023 | US$ 142.857.338.000 | US$ 71.732.495.000 | US$ 47.656.468.000 | US$ 32.823.137.000 | US$ 25.941.782.000 |
| 2022 | US$ 154.576.314.000 | US$ 82.134.693.000 | US$ 54.711.795.000 | US$ 44.929.425.000 | US$ 26.724.717.000 |
| 2021 | US$ 138.622.072.000 | US$ 73.615.250.000 | US$ 54.636.756.000 | US$ 32.914.445.000 | US$ 23.965.702.000 |
| 2020 | US$ 108.870.202.000 | US$ 57.768.420.000 | US$ 46.024.958.000 | US$ 18.712.760.000 | US$ 20.578.653.000 |
| 2019 | US$ 107.219.763.000 | US$ 62.102.883.000 | US$ 47.575.433.000 | US$ 20.606.103.000 | US$ 21.071.447.000 |
| 2018 | US$ 106.478.995.000 | US$ 59.086.153.000 | US$ 54.605.035.000 | US$ 20.699.049.000 | US$ 19.631.653.000 |
| 2017 | US$ 97.856.886.000 | US$ 50.901.449.000 | US$ 55.133.802.000 | US$ 19.126.143.000 | US$ 16.176.130.000 |
| 2016 | US$ 86.962.000.000 | US$ 43.396.444.000 | US$ 47.454.088.000 | US$ 15.165.382.000 | US$ 12.495.050.000 |
| 2015 | US$ 90.236.930.000 | US$ 44.215.394.000 | US$ 45.854.370.000 | US$ 16.451.177.000 | US$ 9.802.740.000 |
| 2014 | US$ 90.072.159.000 | US$ 45.532.370.000 | US$ 53.775.979.000 | US$ 20.441.467.000 | US$ 7.988.701.000 |
| 2013 | US$ 83.037.429.000 | US$ 41.763.900.000 | US$ 60.015.980.000 | US$ 20.767.843.000 | US$ 7.170.311.000 |
| 2012 | US$ 80.782.203.000 | US$ 43.652.459.000 | US$ 64.362.822.000 | US$ 22.987.588.000 | US$ 5.719.246.000 |
| 2011 | US$ 86.430.974.000 | US$ 44.814.718.000 | US$ 68.319.877.000 | US$ 26.316.083.000 | US$ 5.084.246.000 |
| 2010 | US$ 71.573.125.000 | US$ 40.588.438.000 | US$ 64.295.813.000 | US$ 20.454.635.000 | US$ 3.330.815.000 |
| 2009 | US$ 54.245.678.000 | US$ 29.160.307.000 | US$ 49.427.291.000 | US$ 14.755.931.000 | US$ 2.369.970.000 |
| 2008 | US$ 76.926.965.000 | US$ 38.555.952.000 | US$ 60.956.291.000 | US$ 18.000.176.000 | US$ 2.037.075.000 |
| 2007 | US$ 63.025.152.000 | US$ 37.392.949.000 | US$ 56.250.095.000 | US$ 13.232.242.000 | US$ 1.391.588.000 |
| 2006 | US$ 48.556.596.000 | US$ 33.796.543.000 | US$ 51.926.275.000 | US$ 11.309.135.000 | US$ 924.856.000 |
| 2005 | US$ 38.648.083.000 | US$ 30.787.475.000 | US$ 48.403.127.000 | US$ 9.859.427.000 | US$ 694.043.000 |
| 2004 | US$ 29.584.764.000 | US$ 28.918.644.000 | US$ 46.144.462.000 | US$ 7.437.675.000 | US$ 673.300.000 |
| 2003 | US$ 21.909.058.000 | US$ 24.934.988.000 | US$ 36.313.002.000 | US$ 5.915.604.000 | US$ 510.700.000 |
| 2002 | US$ 17.399.683.000 | US$ 23.110.979.000 | US$ 29.855.162.000 | US$ 5.973.306.000 | US$ 470.309.000 |
| 2001 | US$ 13.302.623.000 | US$ 22.430.926.000 | US$ 26.633.084.000 | US$ 5.534.106.000 | US$ 385.779.000 |
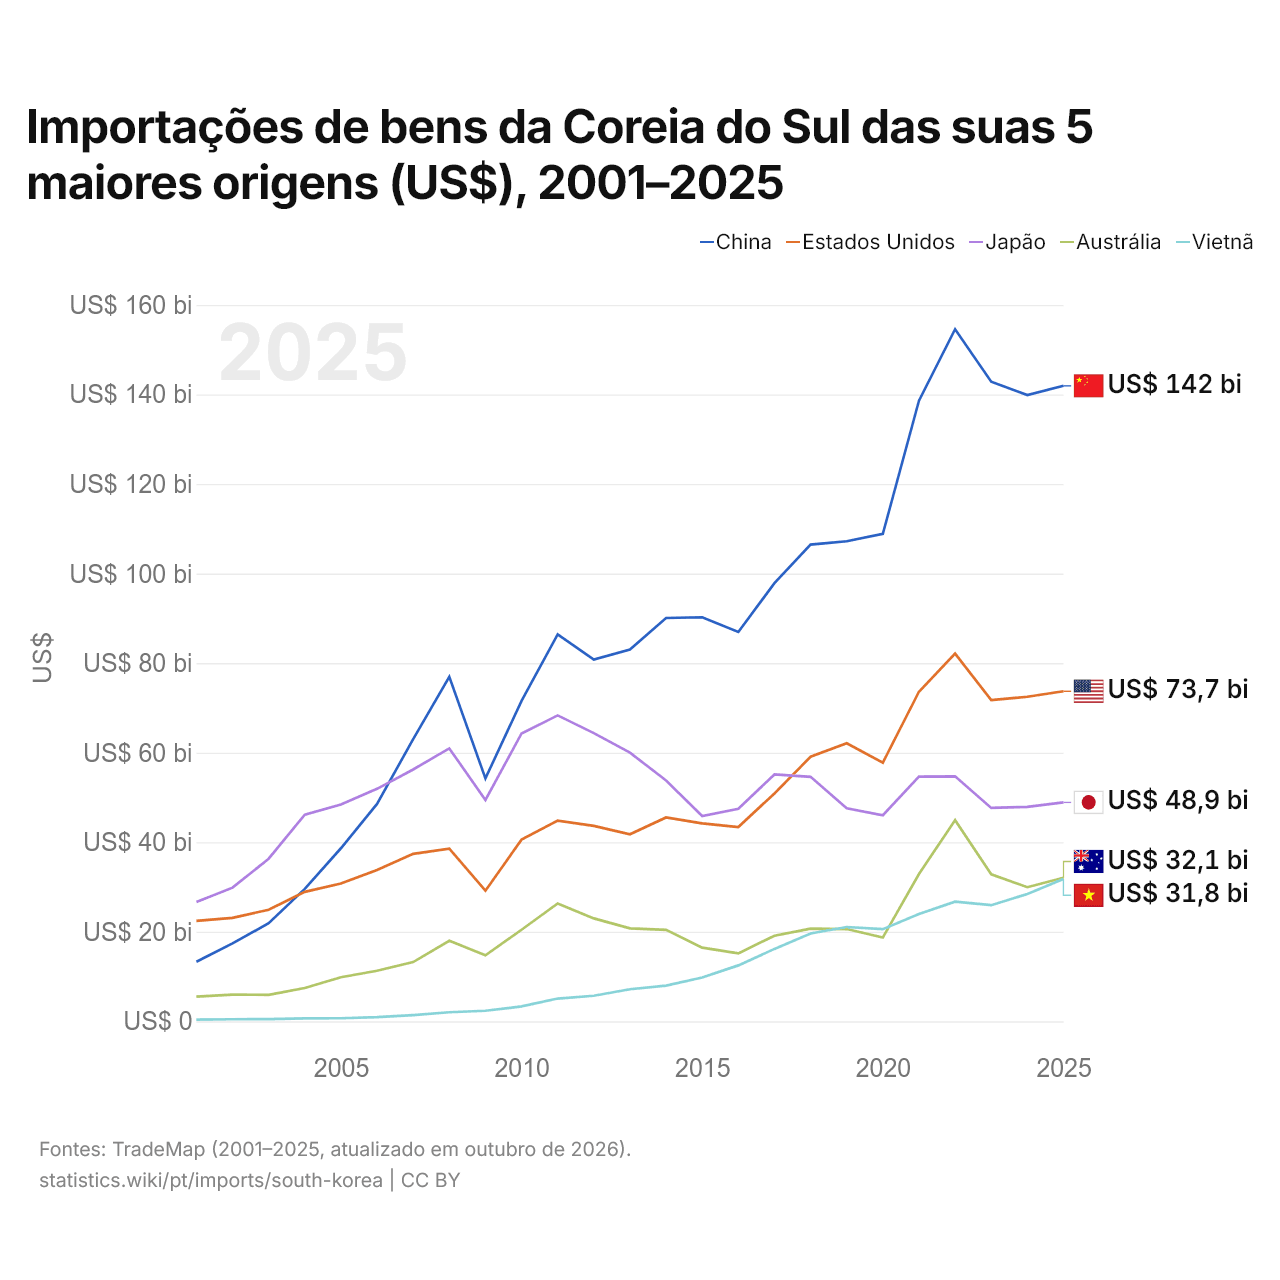
Em 2025, as importações de bens foram de US$ 142 bilhões da China, US$ 73,7 bilhões dos Estados Unidos, US$ 48,9 bilhões do Japão, US$ 32,1 bilhões da Austrália e US$ 31,8 bilhões do Vietnã. O primeiro lugar dos cinco fornecedores da Coreia do Sul fica com a China desde 2007. A mudança mais recente nessa ordem foi em 2021, quando as importações da Coreia do Sul vindas da Austrália superaram as vindas do Vietnã.
Importações de bens e de serviços da Coreia do Sul (US$), 1976–2025
| Ano | US$ | |
|---|---|---|
| Bens | Serviços | |
| 2025 | US$ 580.869.300.000 | US$ 184.662.900.000 |
| 2024 | US$ 593.064.800.000 | US$ 171.462.400.000 |
| 2023 | US$ 597.486.700.000 | US$ 157.784.000.000 |
| 2022 | US$ 679.420.400.000 | US$ 143.432.200.000 |
| 2021 | US$ 575.981.000.000 | US$ 129.168.500.000 |
| 2020 | US$ 438.766.400.000 | US$ 105.349.800.000 |
| 2019 | US$ 476.855.800.000 | US$ 130.684.200.000 |
| 2018 | US$ 516.179.700.000 | US$ 133.046.900.000 |
| 2017 | US$ 466.717.300.000 | US$ 126.435.400.000 |
| 2016 | US$ 395.464.400.000 | US$ 112.147.500.000 |
| 2015 | US$ 422.807.500.000 | US$ 112.124.400.000 |
| 2014 | US$ 527.251.500.000 | US$ 115.192.400.000 |
| 2013 | US$ 538.134.300.000 | US$ 109.653.000.000 |
| 2012 | US$ 555.075.500.000 | US$ 108.191.800.000 |
| 2011 | US$ 559.198.700.000 | US$ 102.616.200.000 |
| 2010 | US$ 415.902.400.000 | US$ 96.921.500.000 |
| 2009 | US$ 315.875.500.000 | US$ 81.879.000.000 |
| 2008 | US$ 421.163.500.000 | US$ 97.356.100.000 |
| 2007 | US$ 350.366.700.000 | US$ 84.452.500.000 |
| 2006 | US$ 304.596.400.000 | US$ 70.052.200.000 |
| 2005 | US$ 252.769.500.000 | US$ 59.521.900.000 |
| 2004 | US$ 216.880.700.000 | US$ 50.335.000.000 |
| 2003 | US$ 172.773.800.000 | US$ 40.605.600.000 |
| 2002 | US$ 146.542.400.000 | US$ 36.849.400.000 |
| 2001 | US$ 137.013.100.000 | US$ 33.042.900.000 |
| 2000 | US$ 154.131.100.000 | US$ 33.402.100.000 |
| 1999 | US$ 110.584.200.000 | US$ 27.184.500.000 |
| 1998 | US$ 87.925.200.000 | US$ 24.549.300.000 |
| 1997 | US$ 139.111.700.000 | US$ 29.497.800.000 |
| 1996 | US$ 141.773.900.000 | US$ 29.602.000.000 |
| 1995 | US$ 126.581.700.000 | US$ 25.819.300.000 |
| 1994 | US$ 95.840.900.000 | US$ 18.610.800.000 |
| 1993 | US$ 78.106.900.000 | US$ 15.097.900.000 |
| 1992 | US$ 74.929.400.000 | US$ 13.604.300.000 |
| 1991 | US$ 74.554.200.000 | US$ 12.210.500.000 |
| 1990 | US$ 63.550.700.000 | US$ 10.291.200.000 |
| 1989 | US$ 55.451.100.000 | US$ 8.534.400.000 |
| 1988 | US$ 46.937.600.000 | US$ 6.179.700.000 |
| 1987 | US$ 37.730.400.000 | US$ 4.792.200.000 |
| 1986 | US$ 29.027.800.000 | US$ 4.094.100.000 |
| 1985 | US$ 23.025.100.000 | US$ 3.618.500.000 |
| 1984 | US$ 24.631.600.000 | US$ 4.037.500.000 |
| 1983 | US$ 23.382.800.000 | US$ 3.991.500.000 |
| 1982 | US$ 23.051.100.000 | US$ 3.990.000.000 |
| 1981 | US$ 24.216.100.000 | US$ 4.110.000.000 |
| 1980 | US$ 21.578.700.000 | US$ 3.739.900.000 |
| 1979 | US$ 19.100.000.000 | US$ 3.503.000.000 |
| 1978 | US$ 14.491.000.000 | US$ 3.195.000.000 |
| 1977 | US$ 10.523.000.000 | US$ 2.025.000.000 |
| 1976 | US$ 8.404.000.000 | US$ 1.191.000.000 |
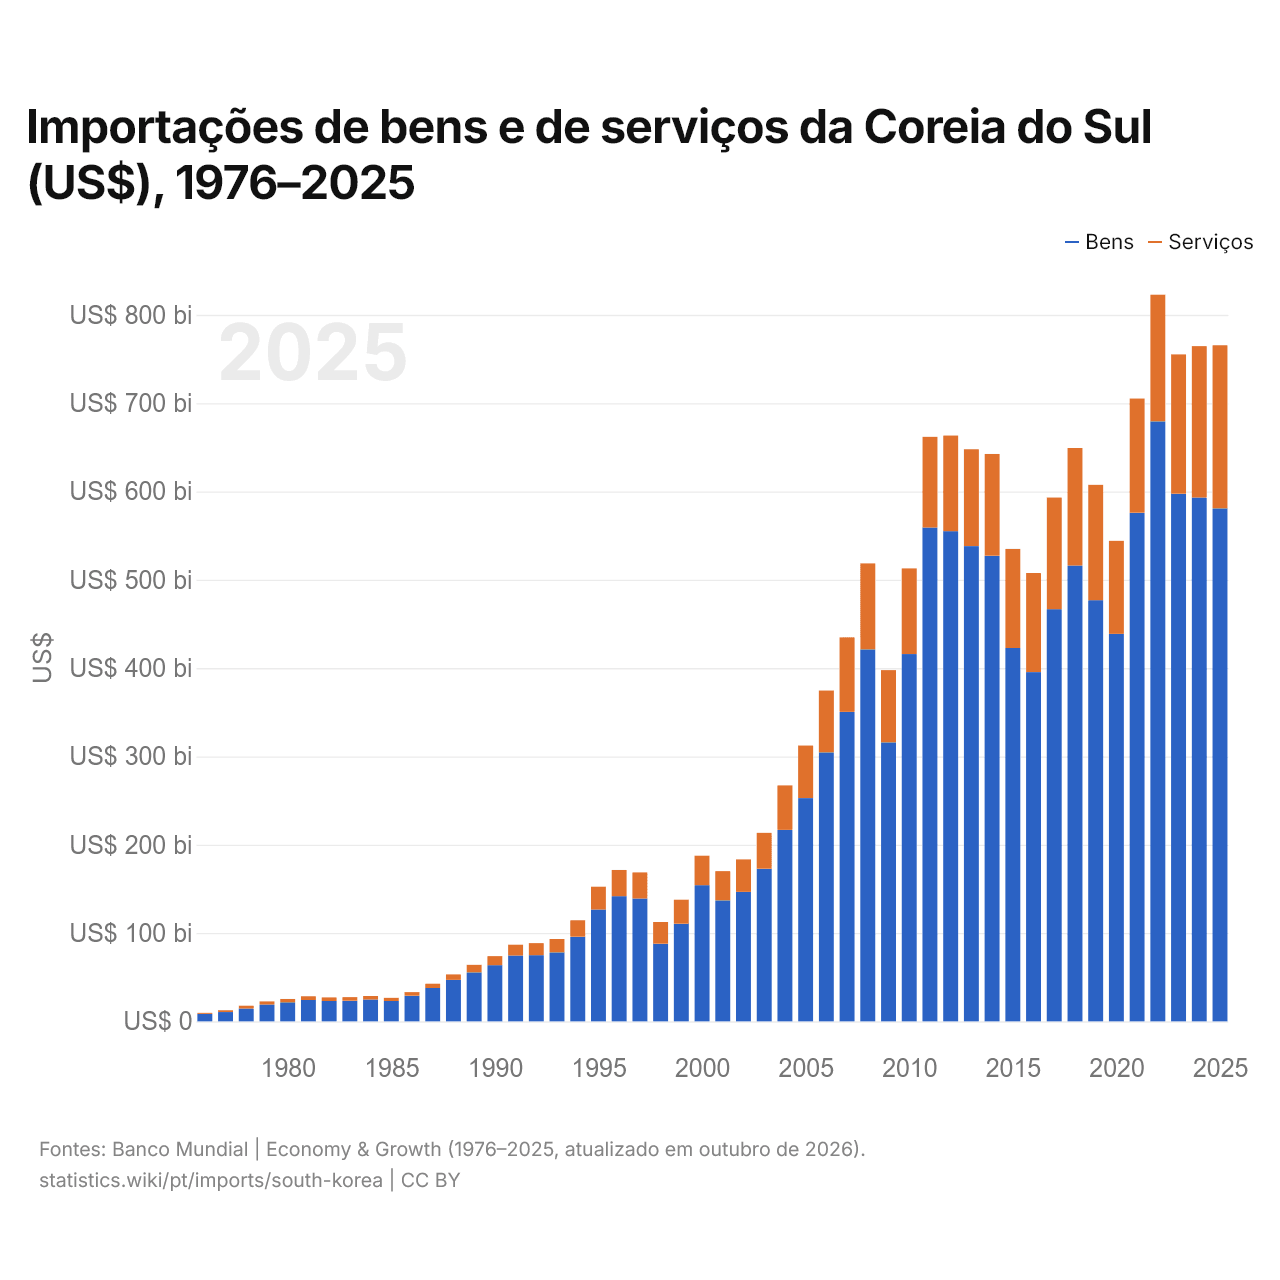
Em 2025, as importações de bens da Coreia do Sul foram de US$ 581 bilhões e as de serviços, de US$ 185 bilhões; os serviços representaram 24,1% do total, ante 12,4% em 1976.
A Coreia do Sul na classificação mundial de importações, 2025
| Posição | País | Importações | Participação mundial | |
|---|---|---|---|---|
| 8 |
 Países Baixos |
US$ 926 bi | 2,74% | vs Países Baixos |
| 9 |
Singapura
|
US$ 860 bi | 2,55% | vs Singapura |
| 10 |
 Itália |
US$ 773 bi | 2,29% | vs Itália |
| 11 |
 Coreia do Sul |
US$ 760 bi | 2,25% | |
| 12 |
 Canadá |
US$ 747 bi | 2,21% | vs Canadá |
| 13 |
 México |
US$ 738 bi | 2,19% | vs México |
| 14 |
 Suíça |
US$ 721 bi | 2,14% |
Importações de bens e serviços da Coreia do Sul, % do PIB, 1960–2025
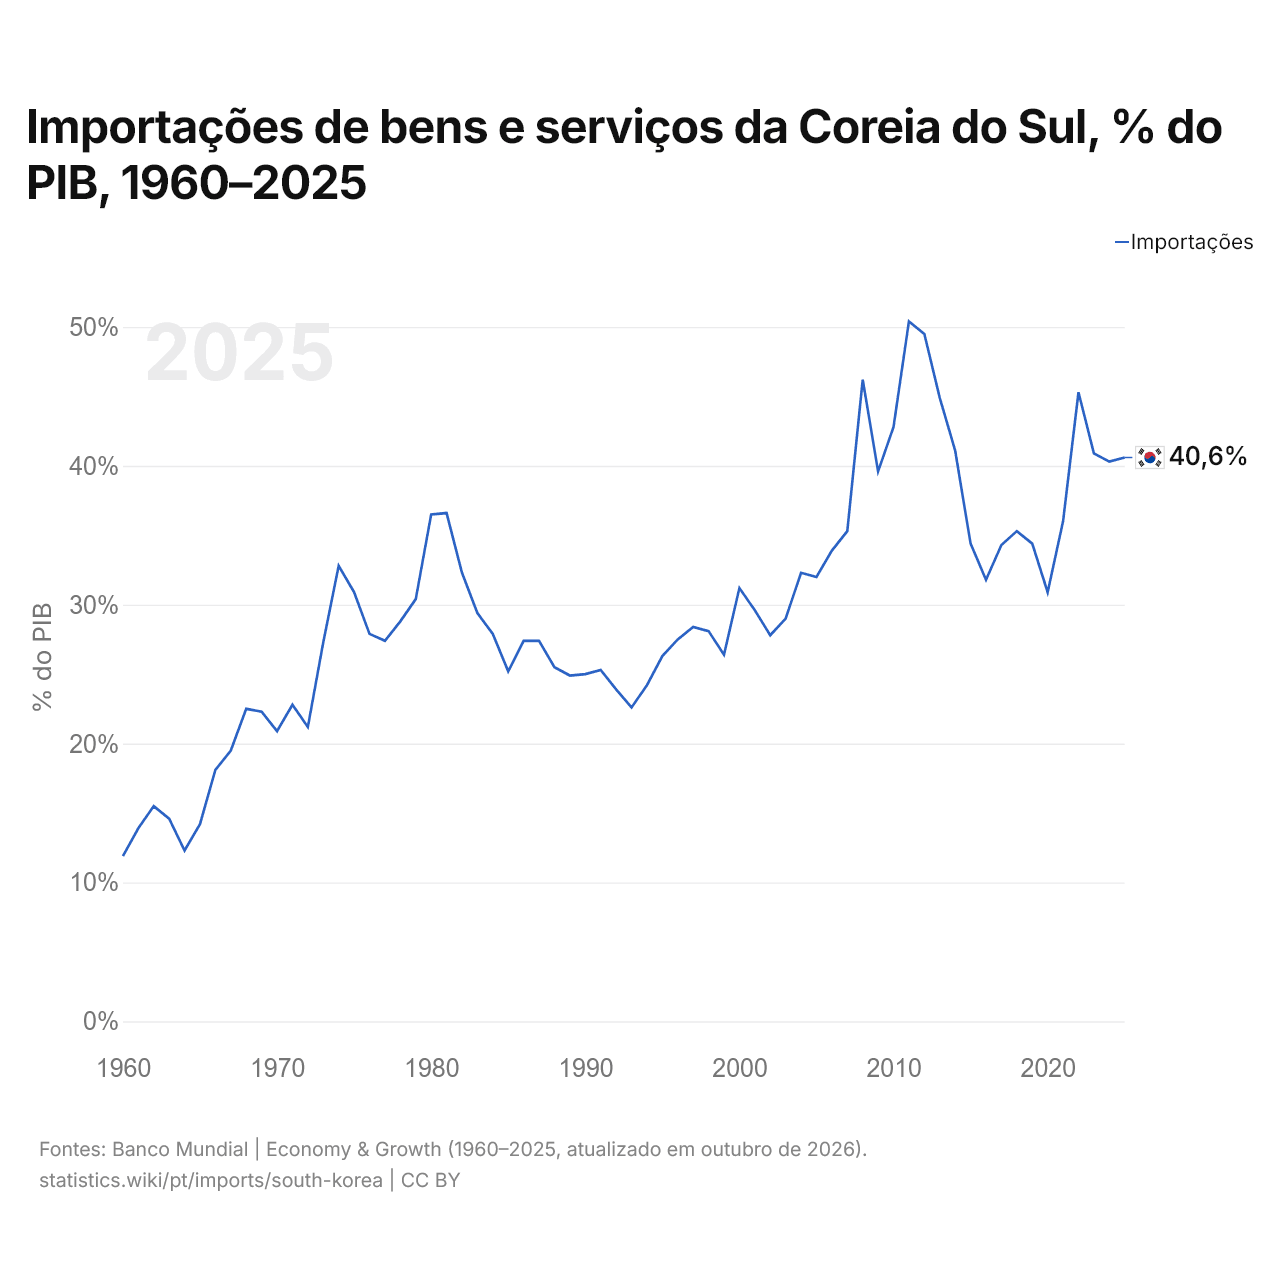
Em 2025, as importações de bens e serviços da Coreia do Sul equivaleram a 40,6% do seu PIB, ante 11,9% em 1960. A maior participação foi de 50,4%, em 2011.
Comparar as importações da Coreia do Sul com as de outros países
Fontes:
- TradeMap (2001–2025, atualizado em outubro de 2026)
- Banco Mundial | Economy & Growth (1960–2025, atualizado em outubro de 2026)
Creative Commons Atribuição (CC BY): você pode copiar, compartilhar, adaptar e reutilizar este conteúdo, inclusive para fins comerciais, desde que cite o statistics.wiki e indique as alterações que fizer. As fontes listadas acima podem ter suas próprias condições de licença.