
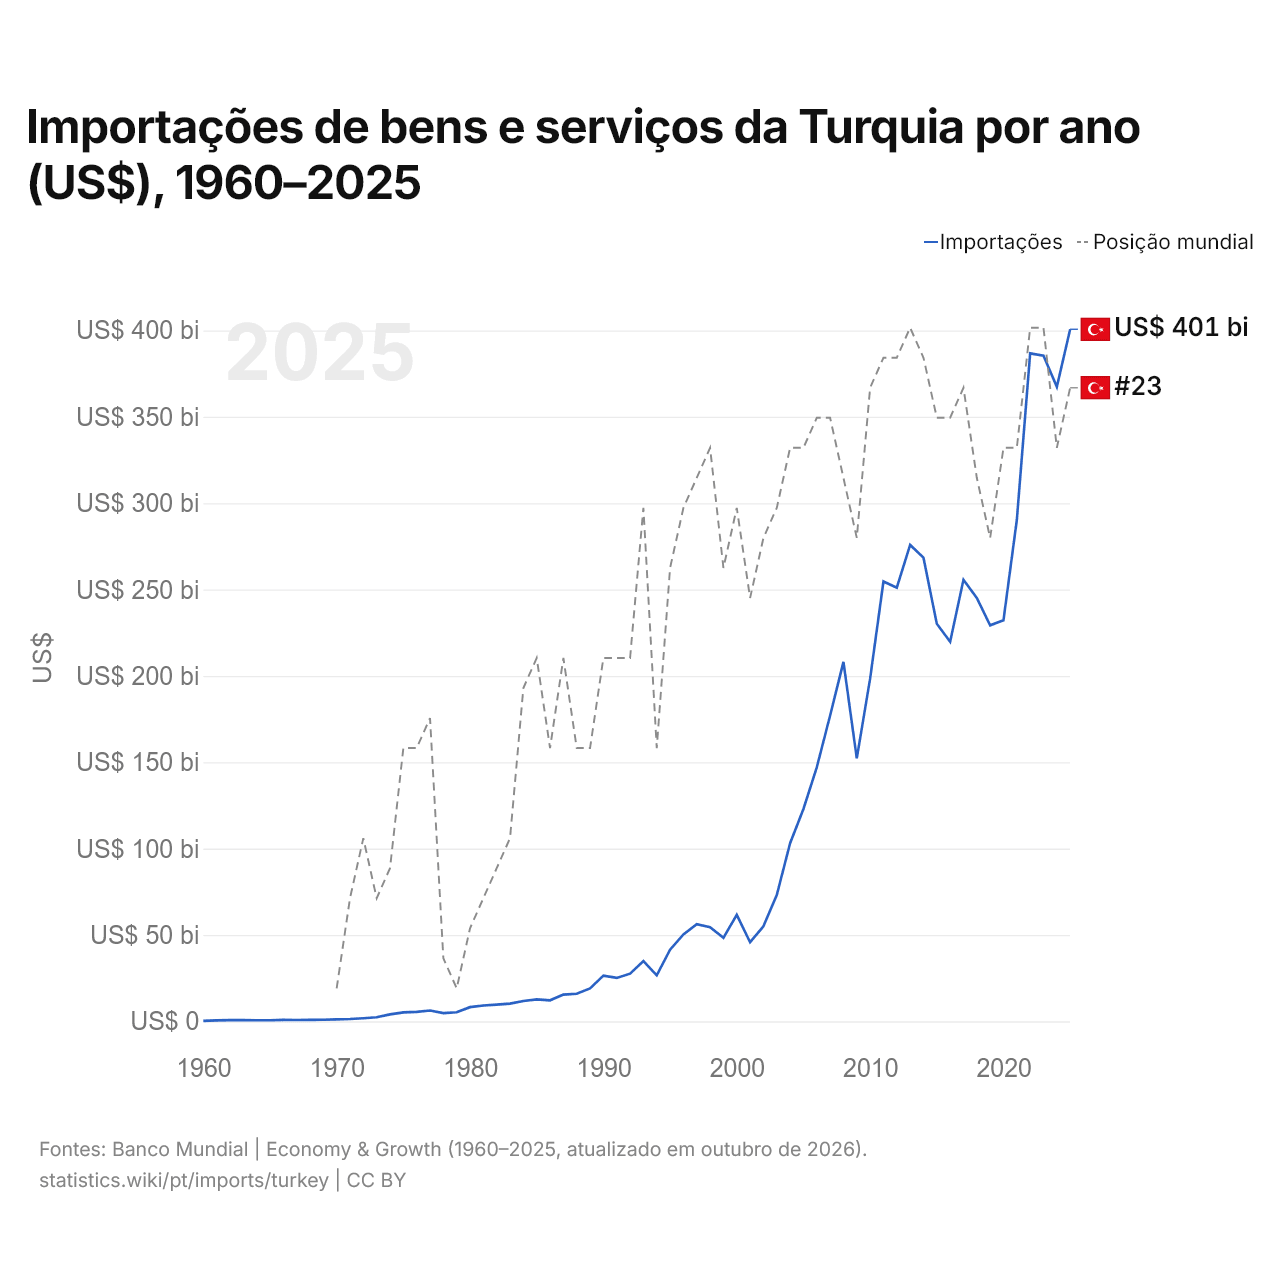
Importações de bens e serviços da Turquia por ano (US$), 1960–2025
| Ano | US$ | Posição mundial |
|---|---|---|
| Importações | Posição mundial | |
| 2025 | US$ 400.679.511.057 | #23 |
| 2024 | US$ 367.379.077.169 | #25 |
| 2023 | US$ 385.393.330.659 | #21 |
| 2022 | US$ 386.711.092.837 | #21 |
| 2021 | US$ 290.243.026.943 | #25 |
| 2020 | US$ 232.192.230.751 | #25 |
| 2019 | US$ 229.253.569.686 | #28 |
| 2018 | US$ 245.157.569.263 | #26 |
| 2017 | US$ 255.673.681.716 | #23 |
| 2016 | US$ 219.776.888.914 | #24 |
| 2015 | US$ 230.161.663.399 | #24 |
| 2014 | US$ 268.468.454.798 | #22 |
| 2013 | US$ 275.806.251.707 | #21 |
| 2012 | US$ 251.096.117.263 | #22 |
| 2011 | US$ 254.618.813.879 | #22 |
| 2010 | US$ 198.401.861.132 | #23 |
| 2009 | US$ 152.234.991.548 | #28 |
| 2008 | US$ 208.120.647.288 | #26 |
| 2007 | US$ 177.062.270.987 | #24 |
| 2006 | US$ 147.024.766.163 | #24 |
| 2005 | US$ 122.961.373.358 | #25 |
| 2004 | US$ 103.109.391.408 | #25 |
| 2003 | US$ 73.087.556.675 | #27 |
| 2002 | US$ 54.987.639.146 | #28 |
| 2001 | US$ 45.792.581.438 | #30 |
| 2000 | US$ 61.657.012.663 | #27 |
| 1999 | US$ 48.346.453.175 | #29 |
| 1998 | US$ 54.441.094.414 | #25 |
| 1997 | US$ 56.251.261.318 | #26 |
| 1996 | US$ 50.297.738.468 | #27 |
| 1995 | US$ 41.468.208.092 | #29 |
| 1994 | US$ 26.631.422.878 | #35 |
| 1993 | US$ 34.898.334.092 | #27 |
| 1992 | US$ 27.596.929.569 | #32 |
| 1991 | US$ 25.124.448.706 | #32 |
| 1990 | US$ 26.482.062.093 | #32 |
| 1989 | US$ 19.048.020.735 | #35 |
| 1988 | US$ 15.951.195.499 | #35 |
| 1987 | US$ 15.482.730.455 | #32 |
| 1986 | US$ 12.184.888.889 | #35 |
| 1985 | US$ 12.751.532.567 | #32 |
| 1984 | US$ 11.791.825.613 | #33 |
| 1983 | US$ 10.233.333.333 | #38 |
| 1982 | US$ 9.666.257.669 | #39 |
| 1981 | US$ 9.185.585.586 | #40 |
| 1980 | US$ 8.209.210.526 | #41 |
| 1979 | US$ 5.270.967.742 | #43 |
| 1978 | US$ 4.804.166.667 | #42 |
| 1977 | US$ 6.283.333.333 | #34 |
| 1976 | US$ 5.487.500.000 | #35 |
| 1975 | US$ 5.171.428.571 | #35 |
| 1974 | US$ 3.992.857.143 | #39 |
| 1973 | US$ 2.364.285.714 | #40 |
| 1972 | US$ 1.764.285.714 | #38 |
| 1971 | US$ 1.333.333.333 | #40 |
| 1970 | US$ 1.136.363.636 | #43 |
| 1969 | US$ 922.222.222 | - |
| 1968 | US$ 888.888.889 | - |
| 1967 | US$ 777.777.778 | - |
| 1966 | US$ 800.000.000 | - |
| 1965 | US$ 644.444.444 | - |
| 1964 | US$ 611.111.111 | - |
| 1963 | US$ 722.222.222 | - |
| 1962 | US$ 711.111.111 | - |
| 1961 | US$ 544.444.444 | - |
| 1960 | US$ 277.777.778 | - |
Em 2025, as importações de bens e serviços da Turquia foram de US$ 401 bilhões, ante US$ 278 milhões em 1960. Foram as 23ª maiores do mundo; em 2024, eram as 25ª. Sua melhor posição foi o 21º lugar, ocupado pela última vez em 2023.
Em 2025, as importações de bens e serviços da Turquia foram as 9ª maiores de 44 países da Ásia. Em 2025, as importações da Turquia superaram as exportações em US$ 3,76 bilhões, um déficit comercial. O comércio da Turquia, exportações e importações somadas, equivaleu a 49,9% do seu PIB em 2025, o 135º lugar do mundo.
Importações de bens da Turquia por categoria, 2025
Importações de bens, 2025: US$ 365 bi
Em 2025, a maior categoria das importações de bens da Turquia foi máquinas, eletrônicos e veículos, com 33,7%, seguida de petróleo, gás, minérios e outras matérias-primas, com 20,1%.
Origens das importações de bens da Turquia: as 10 principais, 2025
| Posição | País | Importações de bens | Participação | |
|---|---|---|---|---|
| 1 |
 China |
US$ 49,6 bi | 13,6% | vs China |
| 2 |
 Rússia |
US$ 42,4 bi | 11,6% | vs Rússia |
| 3 |
 Alemanha |
US$ 30,1 bi | 8,24% | vs Alemanha |
| 4 |
 Estados Unidos |
US$ 18,1 bi | 4,95% | vs EUA |
| 5 |
 Suíça |
US$ 15,8 bi | 4,31% | |
| 6 |
 Itália |
US$ 15,7 bi | 4,31% | vs Itália |
| 7 |
 França |
US$ 12,9 bi | 3,52% | vs França |
| 8 |
 Coreia do Sul |
US$ 10,3 bi | 2,81% | vs Coreia do Sul |
| 9 |
 Espanha |
US$ 10,2 bi | 2,78% | vs Espanha |
| 10 |
 EAU |
US$ 9,67 bi | 2,65% | |
| Outros parceiros e não especificados | US$ 151 bi | 41,3% |
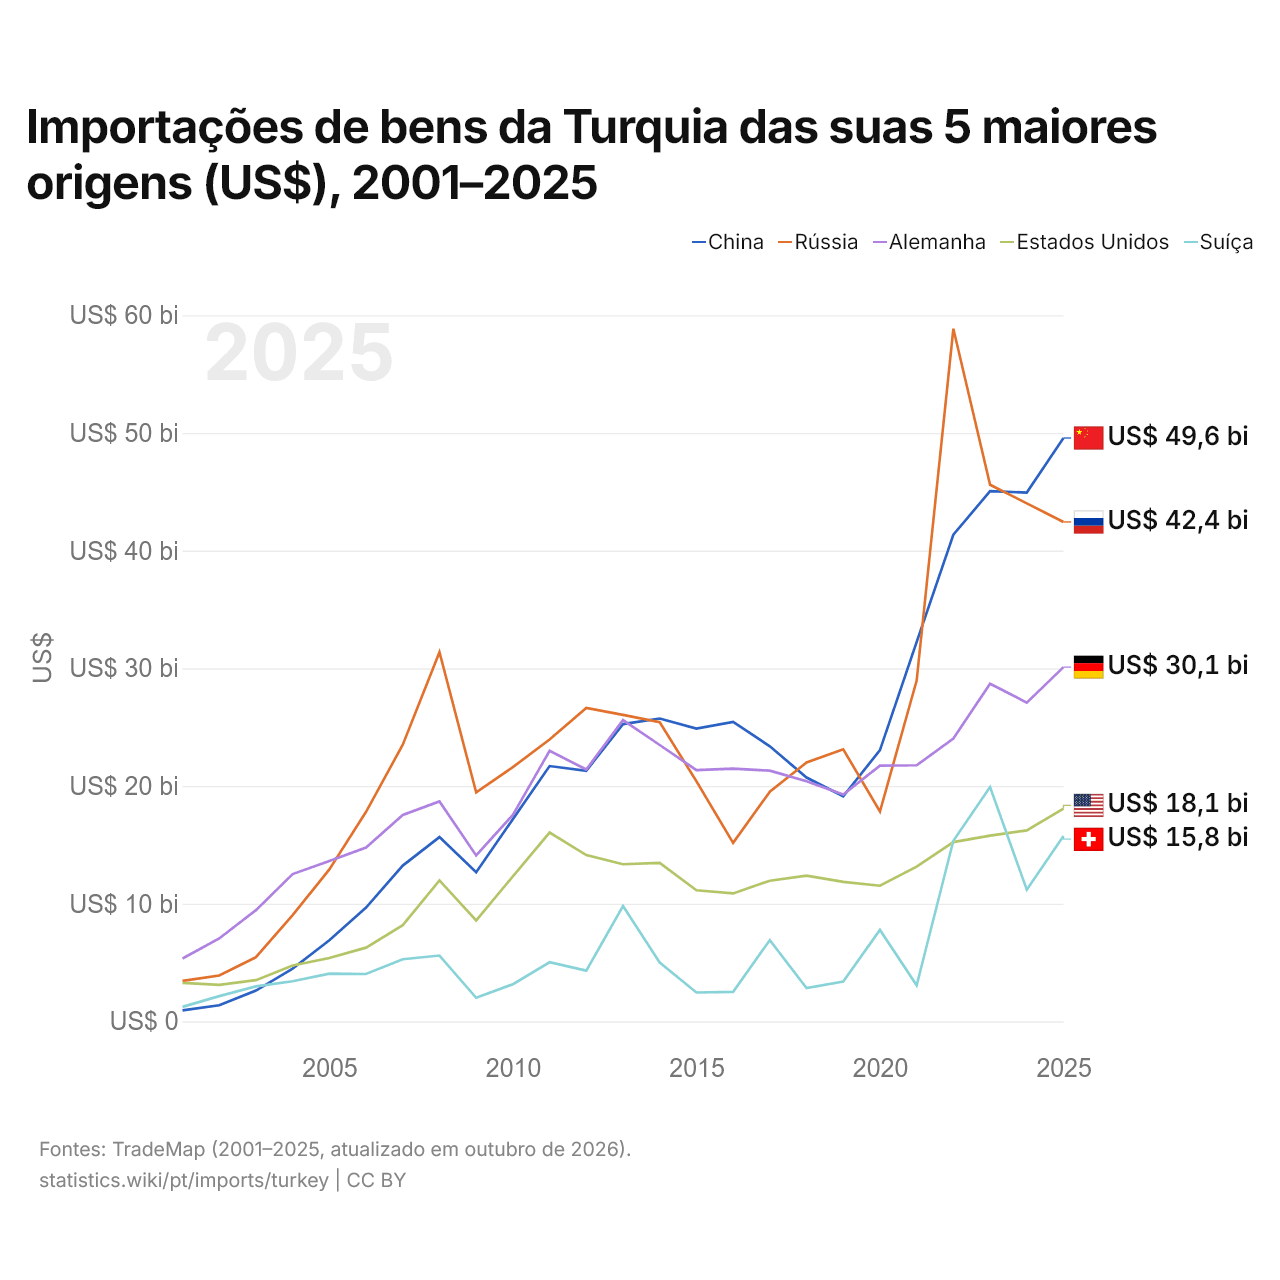
Importações de bens da Turquia das suas 5 maiores origens (US$), 2001–2025
| Ano | US$ | ||||
|---|---|---|---|---|---|
| China | Rússia | Alemanha | Estados Unidos | Suíça | |
| 2025 | US$ 49.569.142.000 | US$ 42.437.246.000 | US$ 30.100.604.000 | US$ 18.079.636.000 | US$ 15.750.179.000 |
| 2024 | US$ 44.930.563.000 | US$ 44.018.616.000 | US$ 27.084.551.000 | US$ 16.227.487.000 | US$ 11.186.125.000 |
| 2023 | US$ 45.047.968.000 | US$ 45.599.587.000 | US$ 28.687.775.000 | US$ 15.779.725.000 | US$ 19.914.079.000 |
| 2022 | US$ 41.353.932.000 | US$ 58.853.499.000 | US$ 24.032.738.000 | US$ 15.228.578.000 | US$ 15.342.734.000 |
| 2021 | US$ 32.239.211.000 | US$ 28.959.030.000 | US$ 21.757.477.000 | US$ 13.148.129.000 | US$ 3.057.872.000 |
| 2020 | US$ 23.040.812.000 | US$ 17.829.236.000 | US$ 21.732.800.000 | US$ 11.525.182.000 | US$ 7.771.743.000 |
| 2019 | US$ 19.127.972.000 | US$ 23.116.867.000 | US$ 19.279.082.000 | US$ 11.847.481.000 | US$ 3.377.053.000 |
| 2018 | US$ 20.719.061.000 | US$ 21.989.574.000 | US$ 20.407.294.000 | US$ 12.377.681.000 | US$ 2.818.664.000 |
| 2017 | US$ 23.370.620.000 | US$ 19.514.094.000 | US$ 21.301.869.000 | US$ 11.951.744.000 | US$ 6.903.610.000 |
| 2016 | US$ 25.440.454.000 | US$ 15.160.961.000 | US$ 21.473.789.000 | US$ 10.867.491.000 | US$ 2.506.215.000 |
| 2015 | US$ 24.873.457.000 | US$ 20.401.756.000 | US$ 21.351.883.000 | US$ 11.141.465.000 | US$ 2.449.606.000 |
| 2014 | US$ 25.732.865.000 | US$ 25.411.700.000 | US$ 23.482.150.000 | US$ 13.465.362.000 | US$ 4.997.706.000 |
| 2013 | US$ 25.260.751.000 | US$ 26.046.541.000 | US$ 25.598.452.000 | US$ 13.350.844.000 | US$ 9.800.066.000 |
| 2012 | US$ 21.295.242.000 | US$ 26.625.286.000 | US$ 21.400.614.000 | US$ 14.130.625.000 | US$ 4.307.344.000 |
| 2011 | US$ 21.693.336.000 | US$ 23.952.914.000 | US$ 22.985.567.000 | US$ 16.042.073.000 | US$ 5.021.487.000 |
| 2010 | US$ 17.180.806.000 | US$ 21.600.641.000 | US$ 17.549.112.000 | US$ 12.322.789.000 | US$ 3.155.726.000 |
| 2009 | US$ 12.676.573.000 | US$ 19.450.086.000 | US$ 14.096.963.000 | US$ 8.575.892.000 | US$ 2.001.886.000 |
| 2008 | US$ 15.658.210.000 | US$ 31.364.477.000 | US$ 18.687.197.000 | US$ 11.977.015.000 | US$ 5.591.781.000 |
| 2007 | US$ 13.234.092.000 | US$ 23.508.494.000 | US$ 17.539.955.000 | US$ 8.166.788.000 | US$ 5.272.608.000 |
| 2006 | US$ 9.669.100.000 | US$ 17.806.239.000 | US$ 14.765.650.000 | US$ 6.260.881.000 | US$ 4.020.723.000 |
| 2005 | US$ 6.885.164.000 | US$ 12.905.620.000 | US$ 13.631.605.000 | US$ 5.375.593.000 | US$ 4.057.390.000 |
| 2004 | US$ 4.476.076.000 | US$ 9.033.138.000 | US$ 12.513.824.000 | US$ 4.745.221.000 | US$ 3.406.966.000 |
| 2003 | US$ 2.610.298.000 | US$ 5.451.315.000 | US$ 9.451.840.000 | US$ 3.496.592.000 | US$ 2.970.129.000 |
| 2002 | US$ 1.368.314.000 | US$ 3.891.721.000 | US$ 7.039.905.000 | US$ 3.099.466.000 | US$ 2.142.789.000 |
| 2001 | US$ 925.620.000 | US$ 3.435.673.000 | US$ 5.335.443.000 | US$ 3.261.380.000 | US$ 1.227.422.000 |
Em 2025, as importações de bens foram de US$ 49,6 bilhões da China, US$ 42,4 bilhões da Rússia, US$ 30,1 bilhões da Alemanha, US$ 18,1 bilhões dos Estados Unidos e US$ 15,8 bilhões da Suíça. O primeiro lugar dos cinco fornecedores da Turquia fica com a China desde 2024.
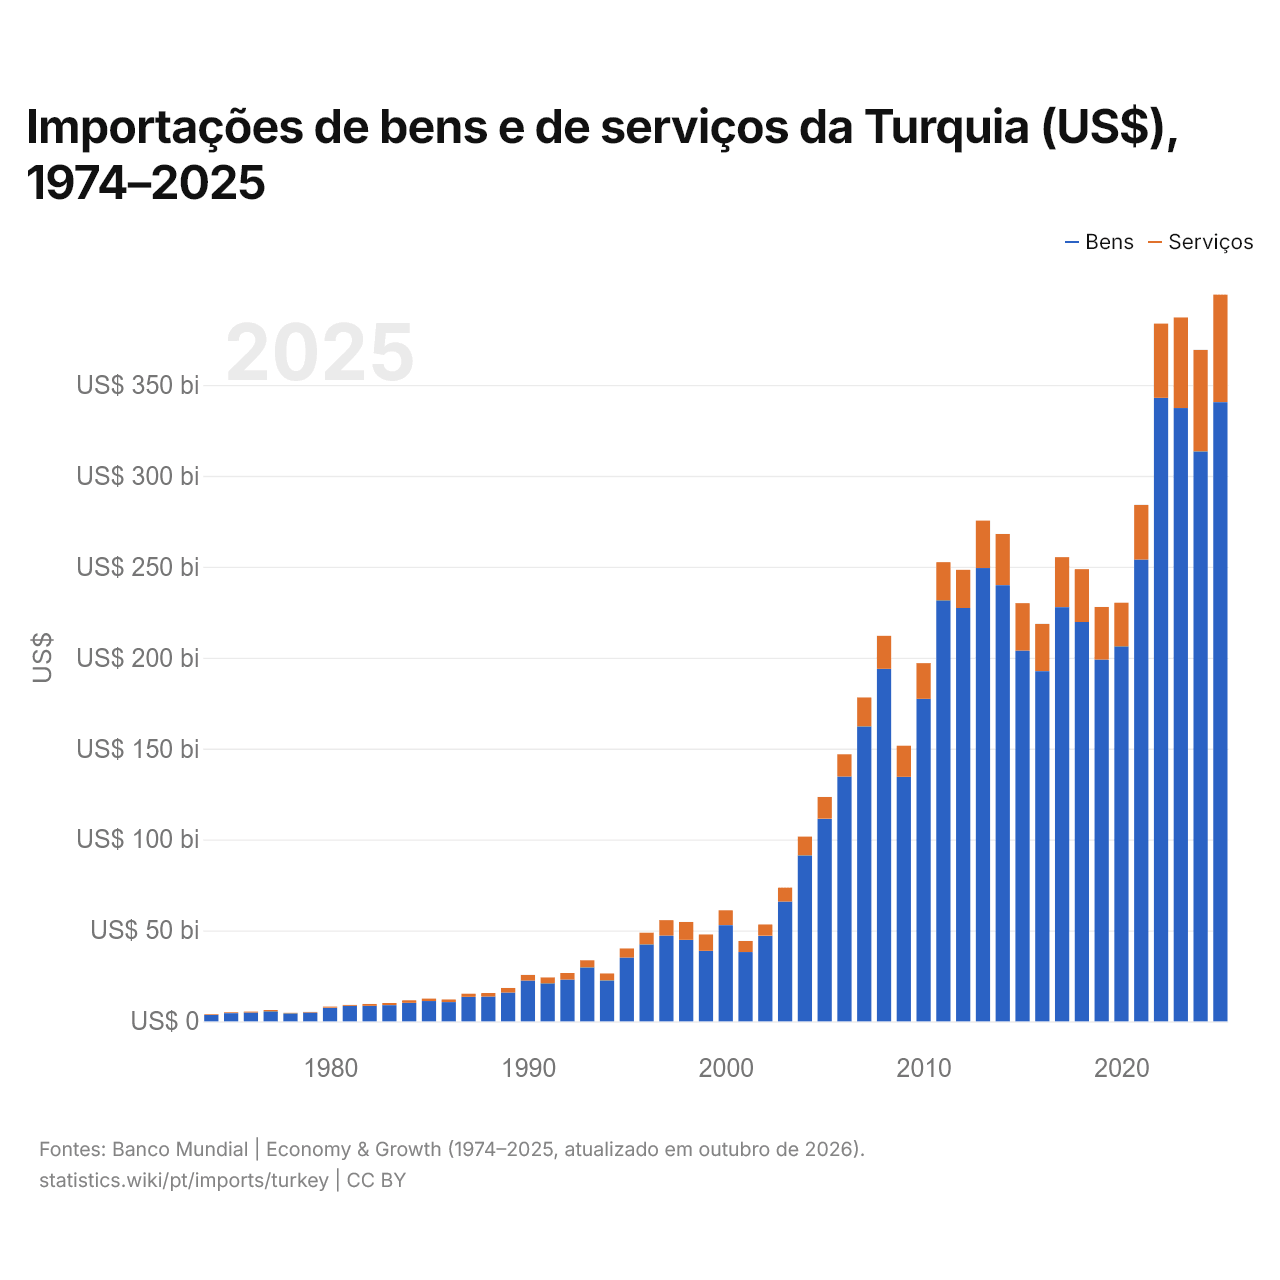
Importações de bens e de serviços da Turquia (US$), 1974–2025
| Ano | US$ | |
|---|---|---|
| Bens | Serviços | |
| 2025 | US$ 340.531.000.000 | US$ 59.101.000.000 |
| 2024 | US$ 313.440.000.000 | US$ 55.820.000.000 |
| 2023 | US$ 337.273.000.000 | US$ 49.860.000.000 |
| 2022 | US$ 342.937.000.000 | US$ 40.762.000.000 |
| 2021 | US$ 253.992.000.000 | US$ 30.025.000.000 |
| 2020 | US$ 206.254.000.000 | US$ 23.959.000.000 |
| 2019 | US$ 198.982.000.000 | US$ 28.898.000.000 |
| 2018 | US$ 219.636.000.000 | US$ 29.054.000.000 |
| 2017 | US$ 227.789.000.000 | US$ 27.487.000.000 |
| 2016 | US$ 192.568.000.000 | US$ 26.002.000.000 |
| 2015 | US$ 203.872.000.000 | US$ 26.081.000.000 |
| 2014 | US$ 239.866.000.000 | US$ 28.164.000.000 |
| 2013 | US$ 249.282.000.000 | US$ 26.082.000.000 |
| 2012 | US$ 227.315.000.000 | US$ 20.982.000.000 |
| 2011 | US$ 231.552.000.000 | US$ 20.967.000.000 |
| 2010 | US$ 177.317.000.000 | US$ 19.704.000.000 |
| 2009 | US$ 134.494.000.000 | US$ 17.090.000.000 |
| 2008 | US$ 193.823.000.000 | US$ 18.204.000.000 |
| 2007 | US$ 162.210.000.000 | US$ 15.914.000.000 |
| 2006 | US$ 134.672.000.000 | US$ 12.189.000.000 |
| 2005 | US$ 111.445.000.000 | US$ 11.950.000.000 |
| 2004 | US$ 91.271.000.000 | US$ 10.353.000.000 |
| 2003 | US$ 65.883.000.000 | US$ 7.636.000.000 |
| 2002 | US$ 47.109.000.000 | US$ 6.146.000.000 |
| 2001 | US$ 38.092.000.000 | US$ 6.098.000.000 |
| 2000 | US$ 52.882.000.000 | US$ 8.153.000.000 |
| 1999 | US$ 38.802.000.000 | US$ 8.949.000.000 |
| 1998 | US$ 44.779.000.000 | US$ 9.858.000.000 |
| 1997 | US$ 47.158.000.000 | US$ 8.506.000.000 |
| 1996 | US$ 42.331.000.000 | US$ 6.426.000.000 |
| 1995 | US$ 35.089.000.000 | US$ 5.024.000.000 |
| 1994 | US$ 22.524.000.000 | US$ 3.782.000.000 |
| 1993 | US$ 29.655.000.000 | US$ 3.948.000.000 |
| 1992 | US$ 22.942.000.000 | US$ 3.625.000.000 |
| 1991 | US$ 20.947.000.000 | US$ 3.218.000.000 |
| 1990 | US$ 22.453.000.000 | US$ 3.071.000.000 |
| 1989 | US$ 15.891.000.000 | US$ 2.465.000.000 |
| 1988 | US$ 13.636.000.000 | US$ 1.925.000.000 |
| 1987 | US$ 13.484.000.000 | US$ 1.695.000.000 |
| 1986 | US$ 10.580.000.000 | US$ 1.428.000.000 |
| 1985 | US$ 11.162.000.000 | US$ 1.333.000.000 |
| 1984 | US$ 10.237.000.000 | US$ 1.296.000.000 |
| 1983 | US$ 8.895.000.000 | US$ 1.166.000.000 |
| 1982 | US$ 8.518.000.000 | US$ 1.031.000.000 |
| 1981 | US$ 8.567.000.000 | US$ 468.000.000 |
| 1980 | US$ 7.513.000.000 | US$ 569.000.000 |
| 1979 | US$ 4.815.000.000 | US$ 367.000.000 |
| 1978 | US$ 4.369.000.000 | US$ 310.000.000 |
| 1977 | US$ 5.506.000.000 | US$ 687.000.000 |
| 1976 | US$ 4.872.000.000 | US$ 517.000.000 |
| 1975 | US$ 4.502.000.000 | US$ 436.000.000 |
| 1974 | US$ 3.589.000.000 | US$ 366.000.000 |
Em 2025, as importações de bens da Turquia foram de US$ 341 bilhões e as de serviços, de US$ 59,1 bilhões; os serviços representaram 14,8% do total, ante 9,3% em 1974.
A Turquia na classificação mundial de importações, 2025
| Posição | País | Importações | Participação mundial | |
|---|---|---|---|---|
| 20 |
EAU
|
US$ 482 bi (2023) | 1,59% | |
| 21 |
 Vietnã |
US$ 474 bi | 1,41% | vs Vietnã |
| 22 |
 Austrália |
US$ 407 bi | 1,21% | vs Austrália |
| 23 |
 Turquia |
US$ 401 bi | 1,19% | |
| 24 |
 Brasil |
US$ 398 bi | 1,18% | vs Brasil |
| 25 |
Rússia
|
US$ 397 bi | 1,18% | vs Rússia |
| 26 |
 Tailândia |
US$ 388 bi | 1,15% | vs Tailândia |
Importações de bens e serviços da Turquia, % do PIB, 1960–2025
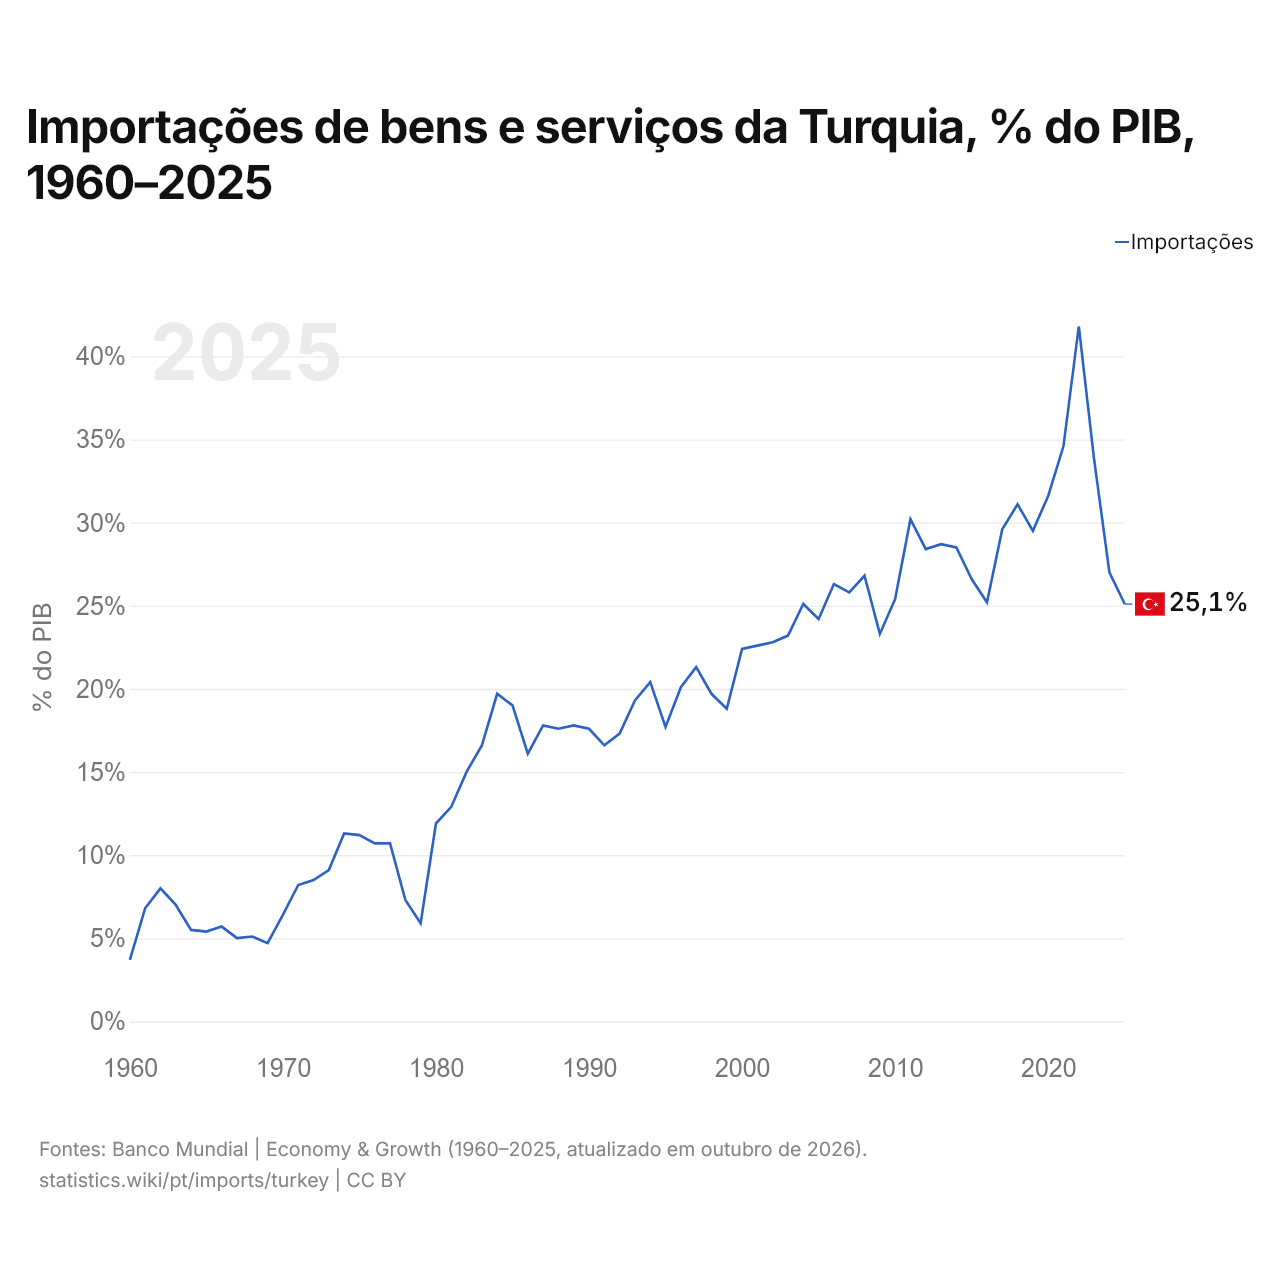
Em 2025, as importações de bens e serviços da Turquia equivaleram a 25,1% do seu PIB, ante 3,7% em 1960. A maior participação foi de 41,8%, em 2022.
Comparar as importações da Turquia com as de outros países
Fontes:
- TradeMap (2001–2025, atualizado em outubro de 2026)
- Banco Mundial | Economy & Growth (1960–2025, atualizado em outubro de 2026)
Creative Commons Atribuição (CC BY): você pode copiar, compartilhar, adaptar e reutilizar este conteúdo, inclusive para fins comerciais, desde que cite o statistics.wiki e indique as alterações que fizer. As fontes listadas acima podem ter suas próprias condições de licença.