
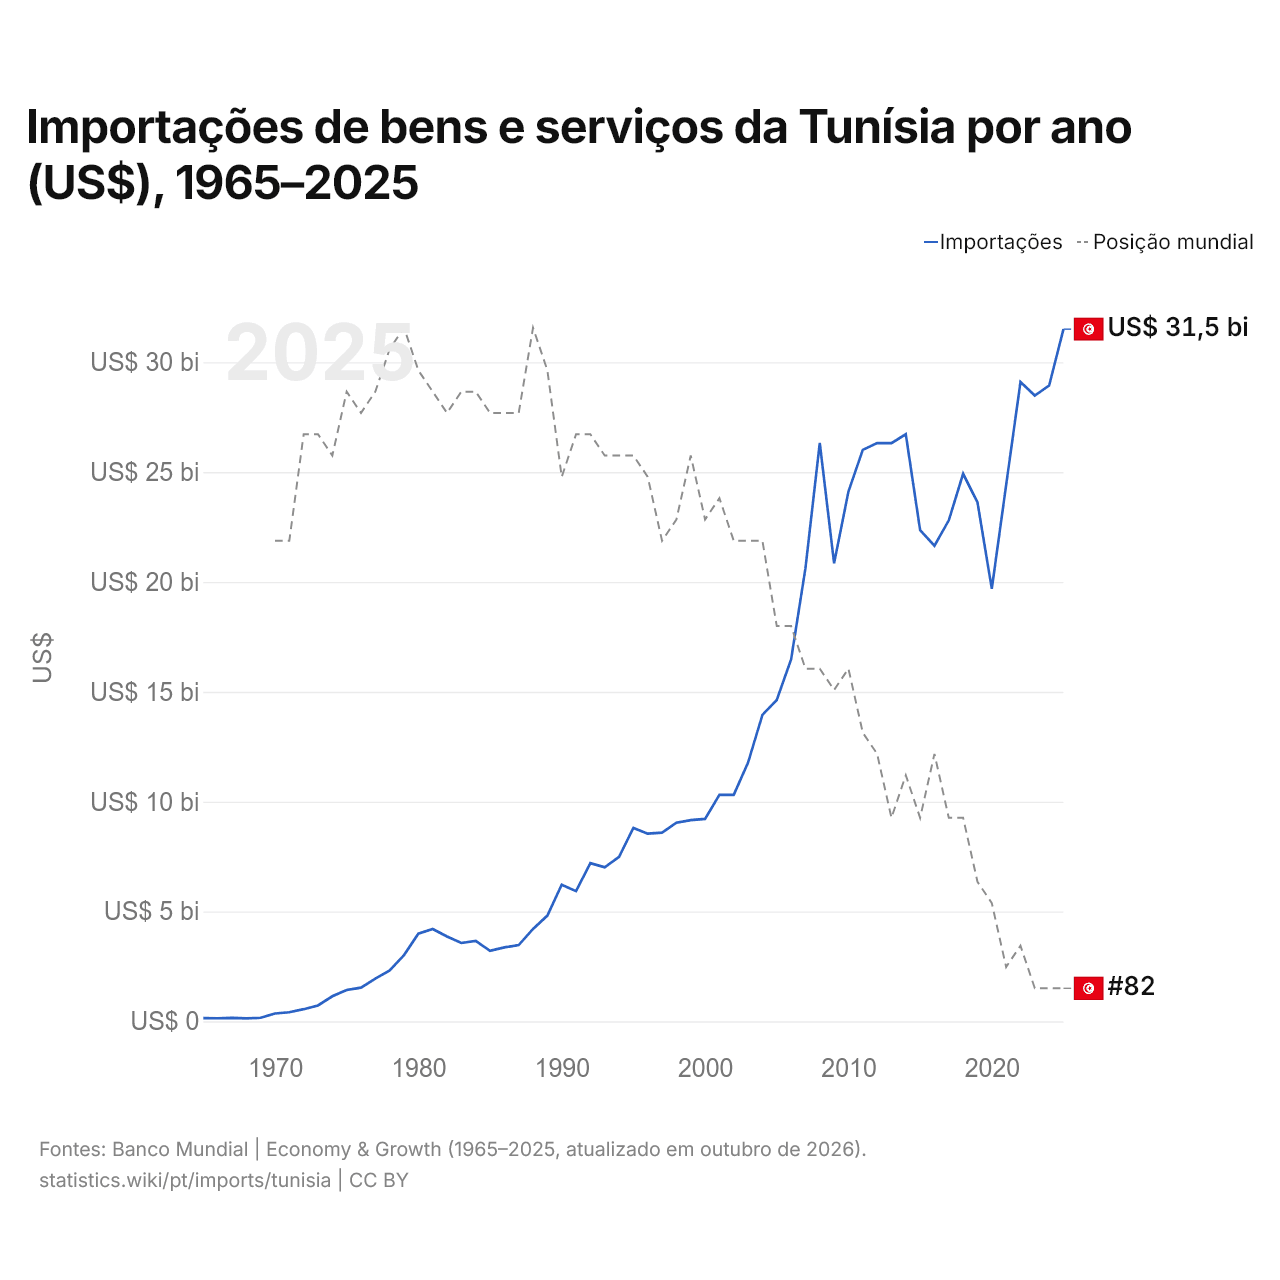
Importações de bens e serviços da Tunísia por ano (US$), 1965–2025
| Ano | US$ | Posição mundial |
|---|---|---|
| Importações | Posição mundial | |
| 2025 | US$ 31.508.376.160 | #82 |
| 2024 | US$ 28.943.410.192 | #82 |
| 2023 | US$ 28.484.270.163 | #82 |
| 2022 | US$ 29.101.043.949 | #80 |
| 2021 | US$ 24.408.983.896 | #81 |
| 2020 | US$ 19.691.340.861 | #78 |
| 2019 | US$ 23.627.358.335 | #77 |
| 2018 | US$ 24.922.974.974 | #74 |
| 2017 | US$ 22.805.583.971 | #74 |
| 2016 | US$ 21.646.548.261 | #71 |
| 2015 | US$ 22.362.683.999 | #74 |
| 2014 | US$ 26.724.314.136 | #72 |
| 2013 | US$ 26.321.908.980 | #74 |
| 2012 | US$ 26.323.059.149 | #71 |
| 2011 | US$ 26.011.487.992 | #70 |
| 2010 | US$ 24.115.551.348 | #67 |
| 2009 | US$ 20.848.790.061 | #68 |
| 2008 | US$ 26.328.377.736 | #67 |
| 2007 | US$ 20.617.813.289 | #67 |
| 2006 | US$ 16.470.689.882 | #65 |
| 2005 | US$ 14.625.418.037 | #65 |
| 2004 | US$ 13.947.699.939 | #61 |
| 2003 | US$ 11.779.584.589 | #61 |
| 2002 | US$ 10.311.289.110 | #61 |
| 2001 | US$ 10.312.550.175 | #59 |
| 2000 | US$ 9.214.092.536 | #60 |
| 1999 | US$ 9.160.319.501 | #57 |
| 1998 | US$ 9.039.408.110 | #60 |
| 1997 | US$ 8.586.157.257 | #61 |
| 1996 | US$ 8.542.152.931 | #58 |
| 1995 | US$ 8.800.888.231 | #57 |
| 1994 | US$ 7.483.930.665 | #57 |
| 1993 | US$ 7.006.979.981 | #57 |
| 1992 | US$ 7.200.545.434 | #56 |
| 1991 | US$ 5.925.543.478 | #56 |
| 1990 | US$ 6.219.545.455 | #58 |
| 1989 | US$ 4.814.704.405 | #53 |
| 1988 | US$ 4.205.855.883 | #51 |
| 1987 | US$ 3.472.947.957 | #55 |
| 1986 | US$ 3.363.856.988 | #55 |
| 1985 | US$ 3.207.085.474 | #55 |
| 1984 | US$ 3.659.087.603 | #54 |
| 1983 | US$ 3.567.350.799 | #54 |
| 1982 | US$ 3.858.557.916 | #55 |
| 1981 | US$ 4.200.654.511 | #54 |
| 1980 | US$ 3.987.404.297 | #53 |
| 1979 | US$ 3.017.010.200 | #51 |
| 1978 | US$ 2.312.030.391 | #52 |
| 1977 | US$ 1.942.191.142 | #54 |
| 1976 | US$ 1.533.438.283 | #55 |
| 1975 | US$ 1.424.924.242 | #54 |
| 1974 | US$ 1.142.018.016 | #57 |
| 1973 | US$ 721.306.654 | #56 |
| 1972 | US$ 553.572.439 | #56 |
| 1971 | US$ 411.728.821 | #61 |
| 1970 | US$ 356.190.476 | #61 |
| 1969 | US$ 163.428.571 | - |
| 1968 | US$ 131.809.524 | - |
| 1967 | US$ 157.714.286 | - |
| 1966 | US$ 140.380.952 | - |
| 1965 | US$ 142.666.667 | - |
Em 2025, as importações de bens e serviços da Tunísia foram de US$ 31,5 bilhões, ante US$ 143 milhões em 1965. O mínimo foi de US$ 132 milhões, em 1968. Foram as 82ª maiores do mundo, posição que mantêm desde 2023. Sua melhor posição foi o 51º lugar, ocupado pela última vez em 1988.
Em 2025, as importações de bens e serviços da Tunísia foram as 7ª maiores de 50 países da África. Em 2025, as importações da Tunísia superaram as exportações em US$ 4,68 bilhões, um déficit comercial. O comércio da Tunísia, exportações e importações somadas, equivaleu a 101,4% do seu PIB em 2025, o 58º lugar do mundo.
Importações de bens da Tunísia por categoria
Importações de bens, 2024: US$ 25,9 bi
A maior categoria das importações de bens da Tunísia é máquinas, eletrônicos e veículos, com 29,7%, seguida de petróleo, gás, minérios e outras matérias-primas, com 21,5%.
Origens das importações de bens da Tunísia: as 10 principais
| Posição | País | Importações de bens | Participação | |
|---|---|---|---|---|
| 1 |
 Itália |
US$ 3,10 bi | 12% | |
| 2 |
 China |
US$ 2,94 bi | 11,4% | |
| 3 |
 França |
US$ 2,67 bi | 10,3% | |
| 4 |
 Argélia |
US$ 1,94 bi | 7,51% | |
| 5 |
 Alemanha |
US$ 1,90 bi | 7,33% | |
| 6 |
 Rússia |
US$ 1,64 bi | 6,35% | |
| 7 |
 Turquia |
US$ 1,22 bi | 4,72% | vs Turquia |
| 8 |
 Espanha |
US$ 957 mi | 3,7% | |
| 9 |
 Azerbaijão |
US$ 630 mi | 2,43% | |
| 10 |
 Índia |
US$ 623 mi | 2,41% | |
| Outros parceiros e não especificados | US$ 8,26 bi | 31,9% |
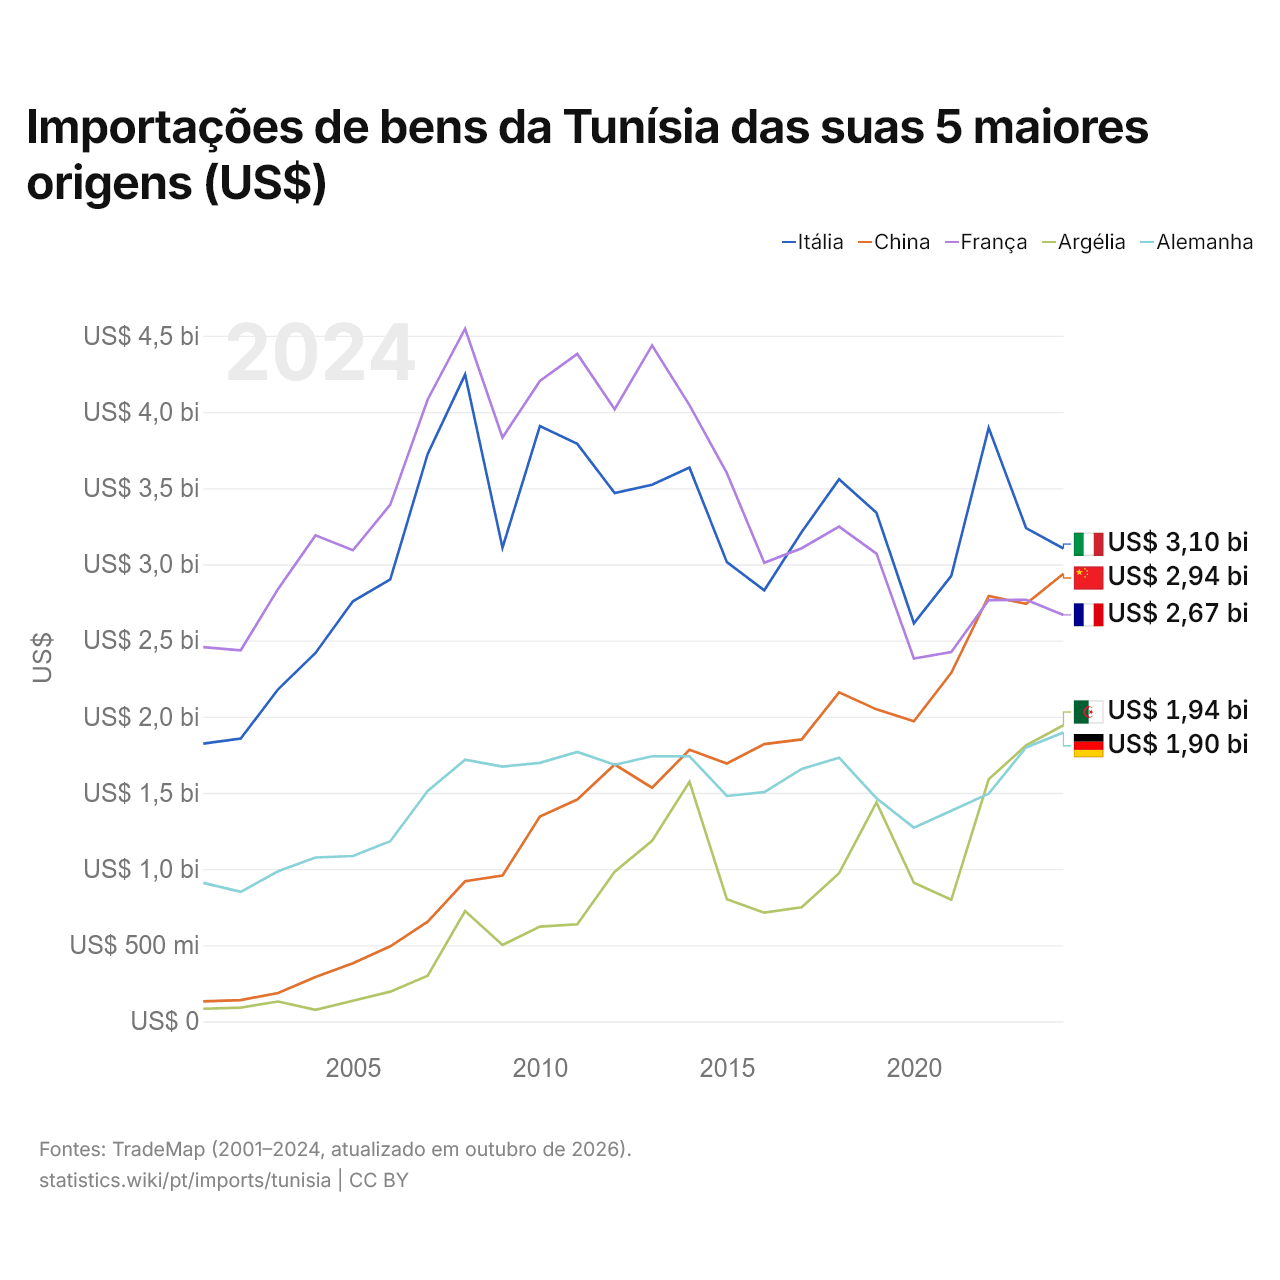
Importações de bens da Tunísia das suas 5 maiores origens (US$)
| Ano | US$ | ||||
|---|---|---|---|---|---|
| Itália | China | França | Argélia | Alemanha | |
| 2024 | US$ 3.103.808.000 | US$ 2.938.329.000 | US$ 2.667.793.000 | US$ 1.943.563.000 | US$ 1.896.071.000 |
| 2023 | US$ 3.237.680.000 | US$ 2.740.227.000 | US$ 2.766.693.000 | US$ 1.811.173.000 | US$ 1.797.611.000 |
| 2022 | US$ 3.895.674.000 | US$ 2.792.091.000 | US$ 2.765.299.000 | US$ 1.588.332.000 | US$ 1.494.150.000 |
| 2021 | US$ 2.924.651.000 | US$ 2.288.098.000 | US$ 2.424.208.000 | US$ 797.771.000 | US$ 1.381.891.000 |
| 2020 | US$ 2.613.003.000 | US$ 1.969.493.000 | US$ 2.381.211.000 | US$ 909.661.000 | US$ 1.271.157.000 |
| 2019 | US$ 3.338.177.000 | US$ 2.047.785.000 | US$ 3.070.332.000 | US$ 1.437.289.000 | US$ 1.464.241.000 |
| 2018 | US$ 3.559.036.000 | US$ 2.159.291.000 | US$ 3.247.527.000 | US$ 972.822.000 | US$ 1.730.651.000 |
| 2017 | US$ 3.212.030.000 | US$ 1.850.712.000 | US$ 3.105.193.000 | US$ 748.258.000 | US$ 1.656.822.000 |
| 2016 | US$ 2.828.988.000 | US$ 1.819.971.000 | US$ 3.009.675.000 | US$ 713.167.000 | US$ 1.504.613.000 |
| 2015 | US$ 3.013.968.000 | US$ 1.692.094.000 | US$ 3.598.235.000 | US$ 801.324.000 | US$ 1.479.343.000 |
| 2014 | US$ 3.634.615.000 | US$ 1.782.594.000 | US$ 4.044.975.000 | US$ 1.572.489.000 | US$ 1.739.941.000 |
| 2013 | US$ 3.521.612.000 | US$ 1.533.198.000 | US$ 4.436.712.000 | US$ 1.185.238.000 | US$ 1.739.752.000 |
| 2012 | US$ 3.467.145.000 | US$ 1.685.826.000 | US$ 4.017.498.000 | US$ 982.768.000 | US$ 1.684.355.000 |
| 2011 | US$ 3.790.307.000 | US$ 1.456.126.000 | US$ 4.380.868.000 | US$ 637.254.000 | US$ 1.768.450.000 |
| 2010 | US$ 3.907.305.000 | US$ 1.344.078.000 | US$ 4.203.198.000 | US$ 621.468.000 | US$ 1.696.624.000 |
| 2009 | US$ 3.108.870.000 | US$ 956.636.000 | US$ 3.832.095.000 | US$ 501.154.000 | US$ 1.672.510.000 |
| 2008 | US$ 4.245.387.000 | US$ 919.557.000 | US$ 4.546.315.000 | US$ 724.341.000 | US$ 1.717.013.000 |
| 2007 | US$ 3.724.217.000 | US$ 653.956.000 | US$ 4.082.181.000 | US$ 299.826.000 | US$ 1.512.723.000 |
| 2006 | US$ 2.901.274.000 | US$ 492.322.000 | US$ 3.391.697.000 | US$ 194.830.000 | US$ 1.182.031.000 |
| 2005 | US$ 2.757.406.000 | US$ 381.131.000 | US$ 3.092.252.000 | US$ 135.371.000 | US$ 1.085.282.000 |
| 2004 | US$ 2.418.198.000 | US$ 291.158.000 | US$ 3.189.846.000 | US$ 75.109.000 | US$ 1.075.635.000 |
| 2003 | US$ 2.179.586.000 | US$ 185.488.000 | US$ 2.838.635.000 | US$ 130.183.000 | US$ 985.268.000 |
| 2002 | US$ 1.856.063.000 | US$ 139.622.000 | US$ 2.435.422.000 | US$ 90.317.000 | US$ 849.975.000 |
| 2001 | US$ 1.822.897.000 | US$ 130.650.000 | US$ 2.456.801.000 | US$ 82.869.000 | US$ 909.058.000 |
As importações de bens são de US$ 3,1 bilhões da Itália (2024), US$ 2,94 bilhões da China (2024), US$ 2,67 bilhões da França (2024), US$ 1,94 bilhão da Argélia (2024) e US$ 1,9 bilhão da Alemanha (2024). O primeiro lugar dos cinco fornecedores da Tunísia fica com a Itália desde 2017. A mudança mais recente nessa ordem foi em 2024, quando as importações da Tunísia vindas da China superaram as vindas da França.
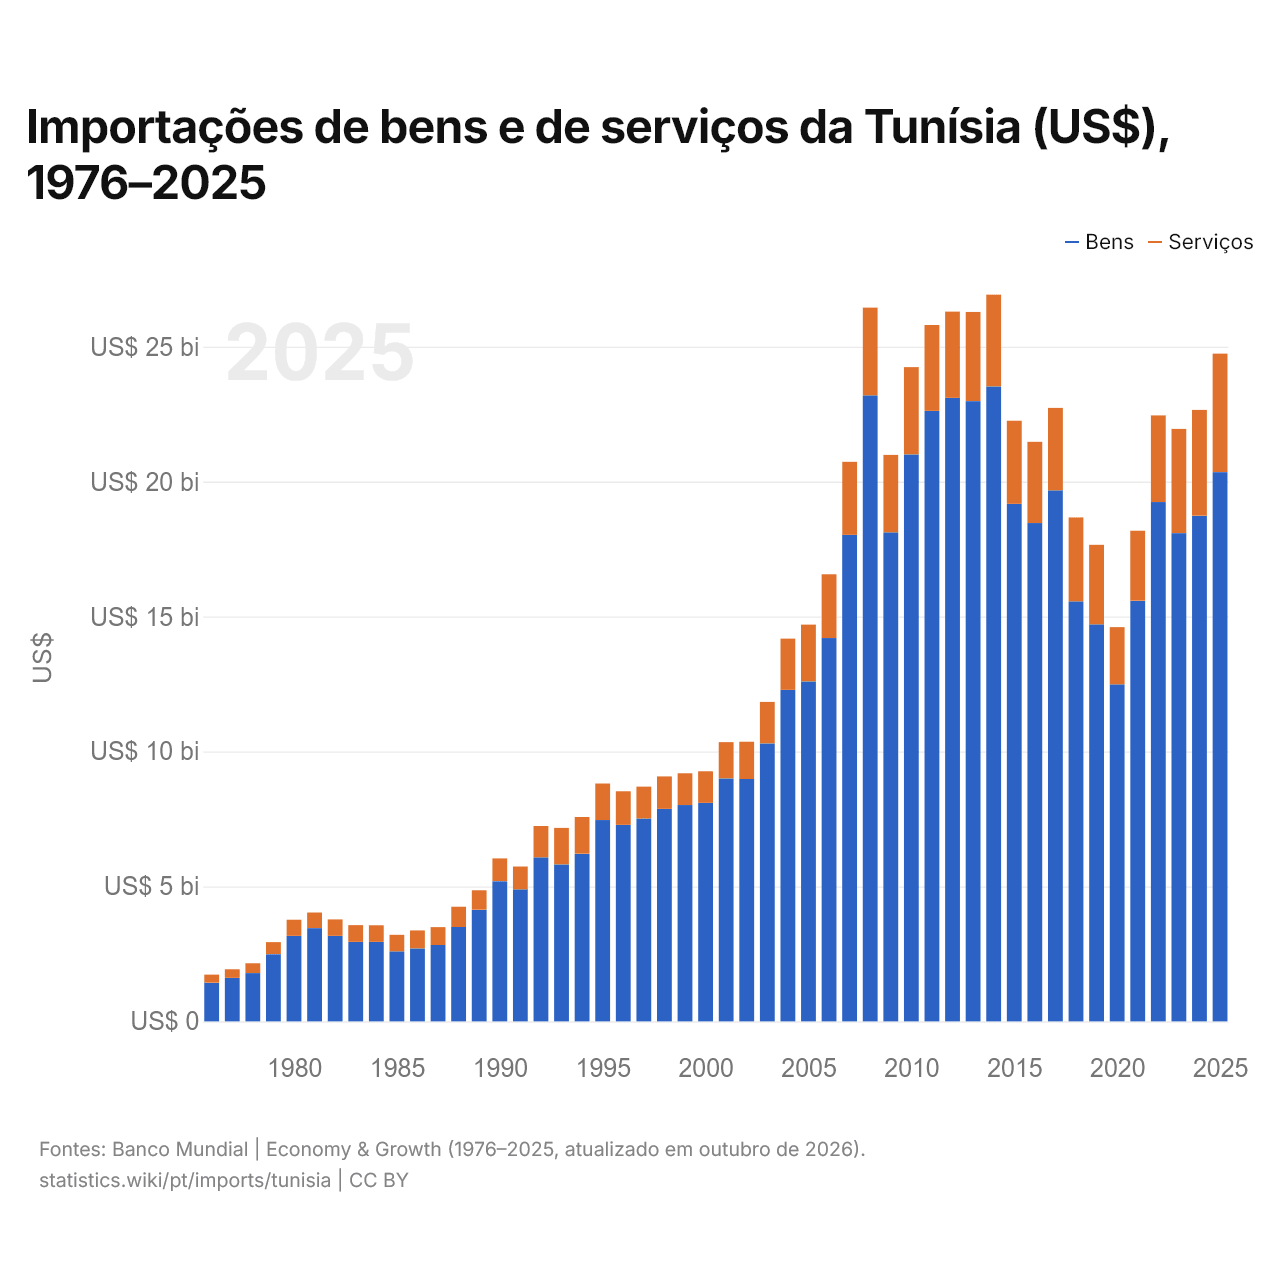
Importações de bens e de serviços da Tunísia (US$), 1976–2025
| Ano | US$ | |
|---|---|---|
| Bens | Serviços | |
| 2025 | US$ 20.348.977.039 | US$ 4.392.079.340 |
| 2024 | US$ 18.737.863.791 | US$ 3.918.607.912 |
| 2023 | US$ 18.089.655.121 | US$ 3.863.057.501 |
| 2022 | US$ 19.242.153.140 | US$ 3.210.357.891 |
| 2021 | US$ 15.584.578.413 | US$ 2.593.162.663 |
| 2020 | US$ 12.487.293.094 | US$ 2.117.966.177 |
| 2019 | US$ 14.708.012.185 | US$ 2.949.091.630 |
| 2018 | US$ 15.562.430.611 | US$ 3.107.694.930 |
| 2017 | US$ 19.679.427.963 | US$ 3.049.732.891 |
| 2016 | US$ 18.463.633.401 | US$ 3.010.567.806 |
| 2015 | US$ 19.177.467.661 | US$ 3.076.276.047 |
| 2014 | US$ 23.525.291.943 | US$ 3.400.297.466 |
| 2013 | US$ 22.981.078.073 | US$ 3.304.263.973 |
| 2012 | US$ 23.101.922.348 | US$ 3.195.932.283 |
| 2011 | US$ 22.623.012.537 | US$ 3.177.832.763 |
| 2010 | US$ 21.005.449.211 | US$ 3.234.385.916 |
| 2009 | US$ 18.117.420.525 | US$ 2.872.007.554 |
| 2008 | US$ 23.193.680.380 | US$ 3.252.791.549 |
| 2007 | US$ 18.023.529.718 | US$ 2.709.936.721 |
| 2006 | US$ 14.202.062.320 | US$ 2.361.788.847 |
| 2005 | US$ 12.594.481.412 | US$ 2.106.466.614 |
| 2004 | US$ 12.280.376.833 | US$ 1.899.689.541 |
| 2003 | US$ 10.296.801.733 | US$ 1.539.048.605 |
| 2002 | US$ 8.980.587.077 | US$ 1.378.598.893 |
| 2001 | US$ 8.996.933.022 | US$ 1.349.122.914 |
| 2000 | US$ 8.093.043.616 | US$ 1.170.219.234 |
| 1999 | US$ 8.014.499.779 | US$ 1.176.842.505 |
| 1998 | US$ 7.875.474.763 | US$ 1.198.709.083 |
| 1997 | US$ 7.514.185.172 | US$ 1.181.833.937 |
| 1996 | US$ 7.279.576.060 | US$ 1.244.082.220 |
| 1995 | US$ 7.458.630.716 | US$ 1.352.365.847 |
| 1994 | US$ 6.210.245.785 | US$ 1.361.271.641 |
| 1993 | US$ 5.810.259.944 | US$ 1.355.926.575 |
| 1992 | US$ 6.078.468.322 | US$ 1.157.803.490 |
| 1991 | US$ 4.894.979.474 | US$ 841.425.990 |
| 1990 | US$ 5.192.789.374 | US$ 845.920.304 |
| 1989 | US$ 4.137.694.931 | US$ 716.301.566 |
| 1988 | US$ 3.496.135.967 | US$ 749.588.338 |
| 1987 | US$ 2.828.654.609 | US$ 663.720.151 |
| 1986 | US$ 2.697.633.903 | US$ 670.000.577 |
| 1985 | US$ 2.593.182.511 | US$ 612.345.778 |
| 1984 | US$ 2.947.865.267 | US$ 611.456.769 |
| 1983 | US$ 2.946.520.654 | US$ 615.822.817 |
| 1982 | US$ 3.167.495.508 | US$ 611.152.260 |
| 1981 | US$ 3.452.785.777 | US$ 579.176.969 |
| 1980 | US$ 3.165.790.375 | US$ 600.067.910 |
| 1979 | US$ 2.487.314.334 | US$ 445.305.534 |
| 1978 | US$ 1.787.727.400 | US$ 365.234.630 |
| 1977 | US$ 1.613.241.640 | US$ 314.721.996 |
| 1976 | US$ 1.434.318.702 | US$ 296.192.643 |
Em 2025, as importações de bens da Tunísia foram de US$ 20,3 bilhões e as de serviços, de US$ 4,39 bilhões; os serviços representaram 17,8% do total, ante 17,1% em 1976.
A Tunísia na classificação mundial de importações, 2025
| Posição | País | Importações | Participação mundial | |
|---|---|---|---|---|
| 79 |
 Jordânia |
US$ 33,5 bi (2024) | 0,11% | vs Jordânia |
| 80 |
 Letônia |
US$ 32,6 bi | 0,1% | |
| 81 |
 Líbia |
US$ 31,7 bi | 0,09% | |
| 82 |
 Tunísia |
US$ 31,5 bi | 0,09% | |
| 83 |
 Quênia |
US$ 29,6 bi | 0,09% | |
| 84 |
 Gana |
US$ 28,2 bi (2024) | 0,09% | |
| 85 |
Azerbaijão
|
US$ 28,0 bi | 0,08% |
Importações de bens e serviços da Tunísia, % do PIB, 1965–2025
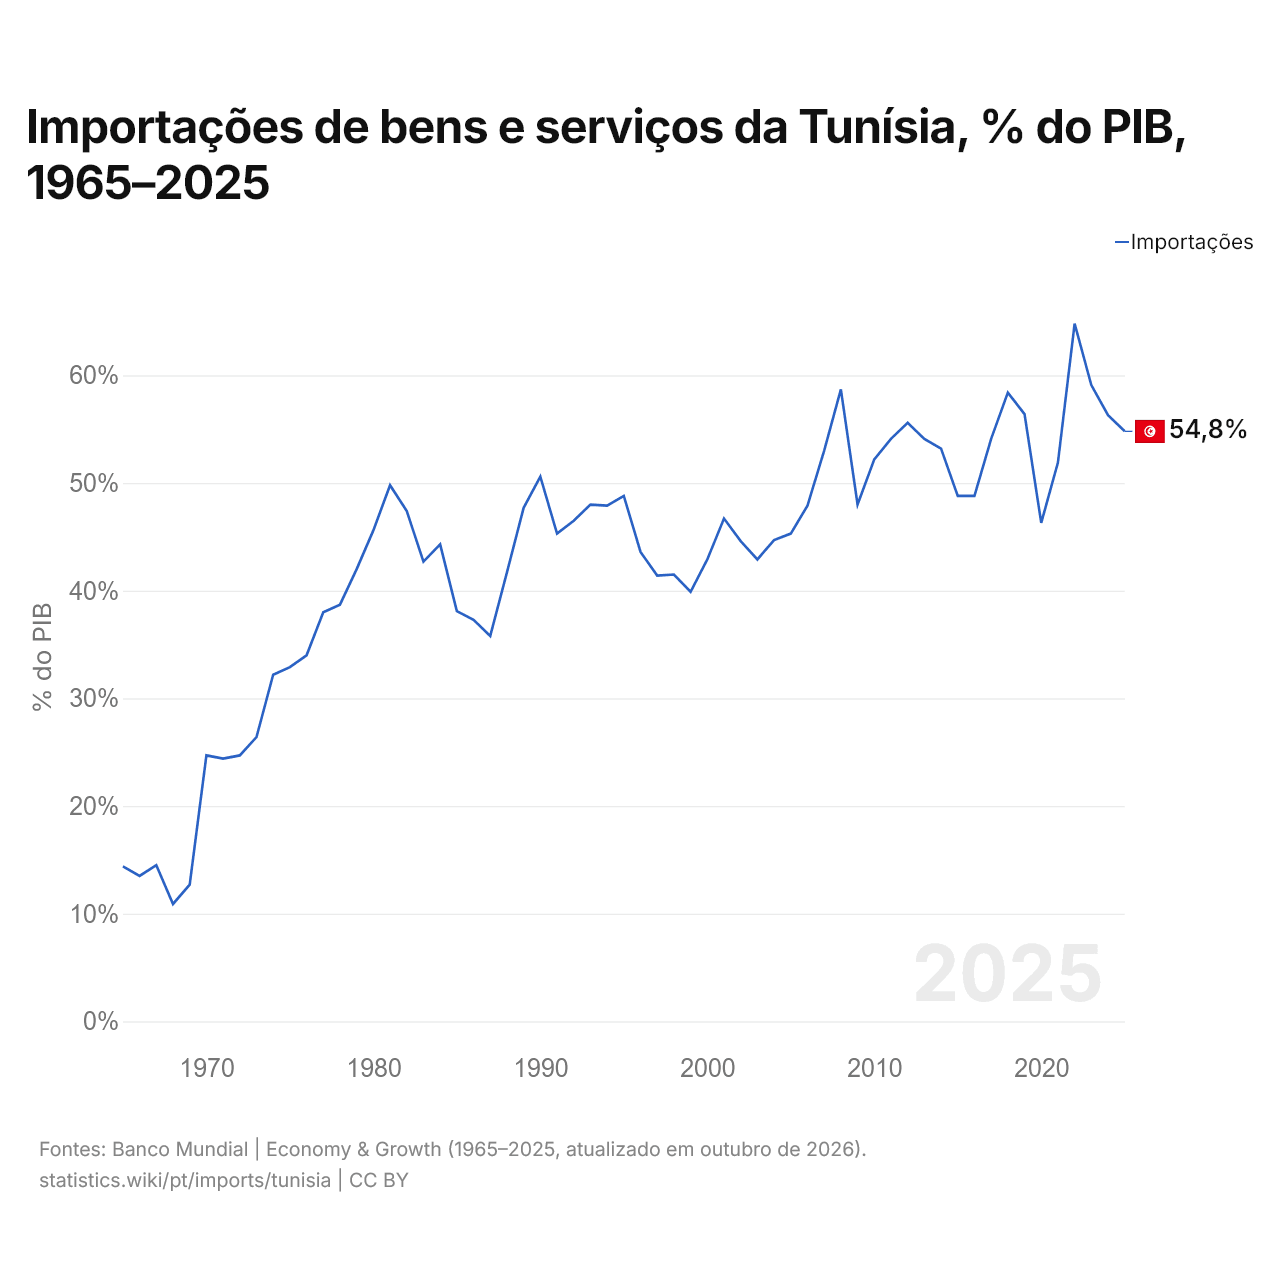
Em 2025, as importações de bens e serviços da Tunísia equivaleram a 54,8% do seu PIB, ante 14,4% em 1965. A maior participação foi de 64,8%, em 2022.
Comparar as importações da Tunísia com as de outros países
Fontes:
- Banco Mundial | Economy & Growth (1965–2025, atualizado em outubro de 2026)
- TradeMap (2001–2024, atualizado em outubro de 2026)
Creative Commons Atribuição (CC BY): você pode copiar, compartilhar, adaptar e reutilizar este conteúdo, inclusive para fins comerciais, desde que cite o statistics.wiki e indique as alterações que fizer. As fontes listadas acima podem ter suas próprias condições de licença.