
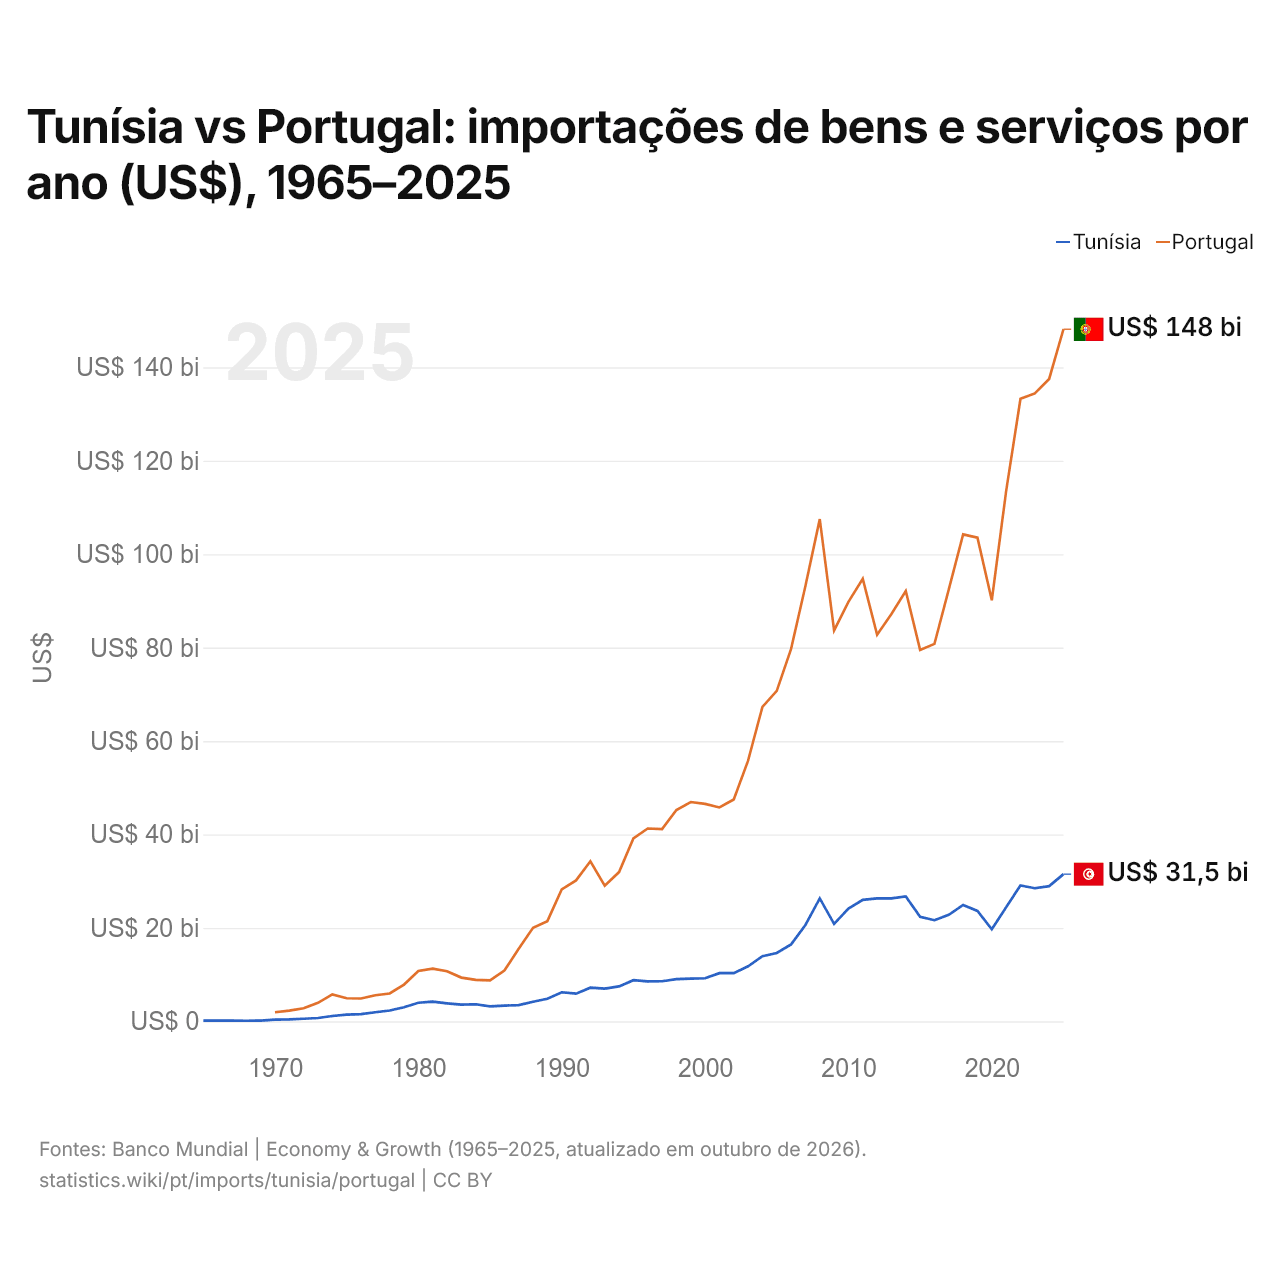
Tunísia vs Portugal: importações de bens e serviços por ano (US$), 1965–2025
1x
| Ano | US$ | |
|---|---|---|
 Tunísia |
 Portugal |
|
| 2025 | US$ 31.508.376.160 | US$ 148.156.593.238 |
| 2024 | US$ 28.943.410.192 | US$ 137.513.069.104 |
| 2023 | US$ 28.484.270.163 | US$ 134.411.585.081 |
| 2022 | US$ 29.101.043.949 | US$ 133.285.364.419 |
| 2021 | US$ 24.408.983.896 | US$ 113.497.070.631 |
| 2020 | US$ 19.691.340.861 | US$ 90.131.397.408 |
| 2019 | US$ 23.627.358.335 | US$ 103.532.874.929 |
| 2018 | US$ 24.922.974.974 | US$ 104.240.636.748 |
| 2017 | US$ 22.805.583.971 | US$ 92.464.542.115 |
| 2016 | US$ 21.646.548.261 | US$ 80.804.179.611 |
| 2015 | US$ 22.362.683.999 | US$ 79.509.937.177 |
| 2014 | US$ 26.724.314.136 | US$ 92.113.305.018 |
| 2013 | US$ 26.321.908.980 | US$ 87.194.990.738 |
| 2012 | US$ 26.323.059.149 | US$ 82.755.123.140 |
| 2011 | US$ 26.011.487.992 | US$ 94.725.068.832 |
| 2010 | US$ 24.115.551.348 | US$ 89.801.905.968 |
| 2009 | US$ 20.848.790.061 | US$ 83.673.807.857 |
| 2008 | US$ 26.328.377.736 | US$ 107.512.515.975 |
| 2007 | US$ 20.617.813.289 | US$ 93.196.905.901 |
| 2006 | US$ 16.470.689.882 | US$ 79.723.354.569 |
| 2005 | US$ 14.625.418.037 | US$ 70.735.904.961 |
| 2004 | US$ 13.947.699.939 | US$ 67.301.751.547 |
| 2003 | US$ 11.779.584.589 | US$ 55.799.780.174 |
| 2002 | US$ 10.311.289.110 | US$ 47.495.078.930 |
| 2001 | US$ 10.312.550.175 | US$ 45.789.575.479 |
| 2000 | US$ 9.214.092.536 | US$ 46.550.613.708 |
| 1999 | US$ 9.160.319.501 | US$ 46.950.345.046 |
| 1998 | US$ 9.039.408.110 | US$ 45.239.506.901 |
| 1997 | US$ 8.586.157.257 | US$ 41.132.256.146 |
| 1996 | US$ 8.542.152.931 | US$ 41.278.931.635 |
| 1995 | US$ 8.800.888.231 | US$ 39.151.232.586 |
| 1994 | US$ 7.483.930.665 | US$ 31.944.022.947 |
| 1993 | US$ 7.006.979.981 | US$ 29.049.311.807 |
| 1992 | US$ 7.200.545.434 | US$ 34.266.584.497 |
| 1991 | US$ 5.925.543.478 | US$ 30.177.947.829 |
| 1990 | US$ 6.219.545.455 | US$ 28.247.582.618 |
| 1989 | US$ 4.814.704.405 | US$ 21.452.554.113 |
| 1988 | US$ 4.205.855.883 | US$ 20.038.610.028 |
| 1987 | US$ 3.472.947.957 | US$ 15.532.868.934 |
| 1986 | US$ 3.363.856.988 | US$ 10.858.608.766 |
| 1985 | US$ 3.207.085.474 | US$ 8.751.378.986 |
| 1984 | US$ 3.659.087.603 | US$ 8.884.931.526 |
| 1983 | US$ 3.567.350.799 | US$ 9.363.968.512 |
| 1982 | US$ 3.858.557.916 | US$ 10.708.695.762 |
| 1981 | US$ 4.200.654.511 | US$ 11.270.547.231 |
| 1980 | US$ 3.987.404.297 | US$ 10.783.476.171 |
| 1979 | US$ 3.017.010.200 | US$ 7.863.475.410 |
| 1978 | US$ 2.312.030.391 | US$ 5.958.549.270 |
| 1977 | US$ 1.942.191.142 | US$ 5.594.295.443 |
| 1976 | US$ 1.533.438.283 | US$ 4.891.100.796 |
| 1975 | US$ 1.424.924.242 | US$ 4.943.349.020 |
| 1974 | US$ 1.142.018.016 | US$ 5.759.928.966 |
| 1973 | US$ 721.306.654 | US$ 3.968.323.794 |
| 1972 | US$ 553.572.439 | US$ 2.797.946.627 |
| 1971 | US$ 411.728.821 | US$ 2.302.600.707 |
| 1970 | US$ 356.190.476 | US$ 1.954.344.491 |
| 1969 | US$ 163.428.571 | - |
| 1968 | US$ 131.809.524 | - |
| 1967 | US$ 157.714.286 | - |
| 1966 | US$ 140.380.952 | - |
| 1965 | US$ 142.666.667 | - |
Em 2025, as importações de bens e serviços da Tunísia foram de US$ 31,5 bilhões e as de Portugal, de US$ 148 bilhões: as de Portugal foram 4,7 vezes maiores. Em 1970, as importações de Portugal foram 5,5 vezes maiores: US$ 356 milhões da Tunísia e US$ 1,95 bilhão de Portugal.
As importações de bens e serviços de Portugal têm sido maiores que as da Tunísia todos os anos desde 1970.
Tunísia vs Portugal: dados de importações
|
Tunísia
|
Portugal
|
|
|---|---|---|
| Importações | US$ 31,5 bi (2025) | US$ 148 bi (2025) |
| Posição mundial | 82/174 | 40/174 |
| Participação mundial | 0,09% | 0,44% |
| % do PIB | 54,8% | 42,7% |
| Maior categoria de bens | Máquinas, eletrônicos e veículos (29,7%, 2024) | Máquinas, eletrônicos e veículos (34%, 2025) |
| Principal origem dos bens | Itália (12%, 2024) | Espanha (32,8%, 2025) |
Comparar as importações de 2 países quaisquer
Fontes:
- Banco Mundial | Economy & Growth (1965–2025, atualizado em outubro de 2026)
- TradeMap (2001–2025, atualizado em outubro de 2026)
Creative Commons Atribuição (CC BY): você pode copiar, compartilhar, adaptar e reutilizar este conteúdo, inclusive para fins comerciais, desde que cite o statistics.wiki e indique as alterações que fizer. As fontes listadas acima podem ter suas próprias condições de licença.