
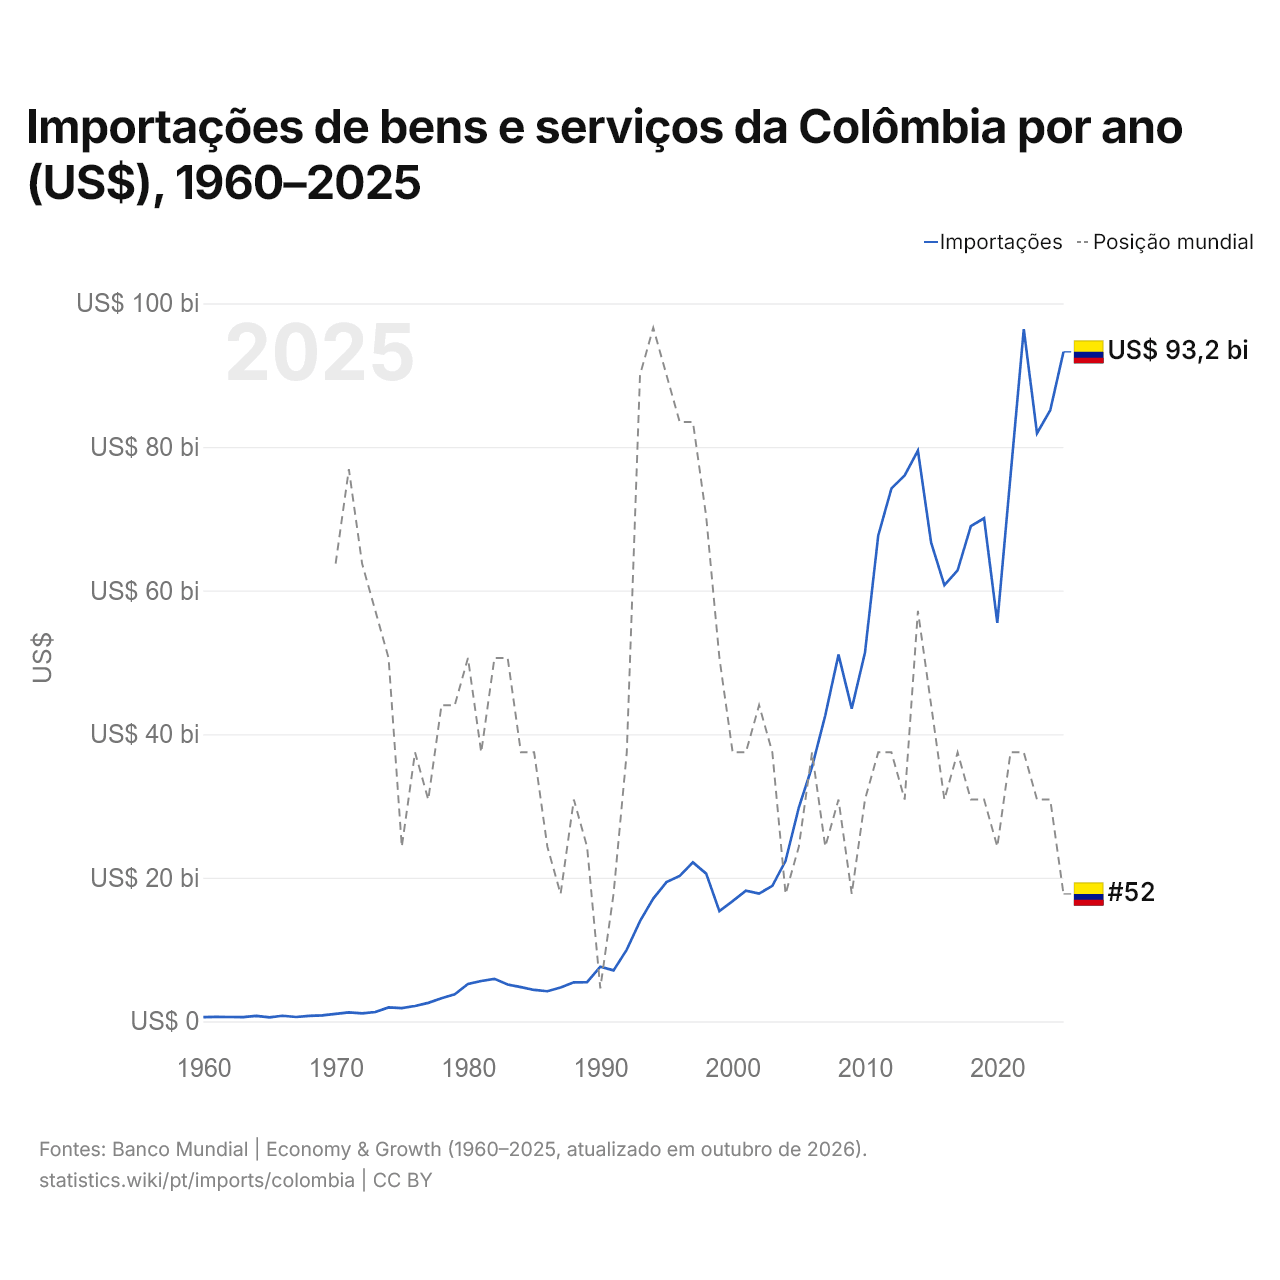
Importações de bens e serviços da Colômbia por ano (US$), 1960–2025
| Ano | US$ | Posição mundial |
|---|---|---|
| Importações | Posição mundial | |
| 2025 | US$ 93.242.618.943 | #52 |
| 2024 | US$ 85.099.669.252 | #50 |
| 2023 | US$ 81.912.779.953 | #50 |
| 2022 | US$ 96.411.719.931 | #49 |
| 2021 | US$ 76.006.795.312 | #49 |
| 2020 | US$ 55.511.423.807 | #51 |
| 2019 | US$ 70.067.176.051 | #50 |
| 2018 | US$ 68.961.912.989 | #50 |
| 2017 | US$ 62.802.582.424 | #49 |
| 2016 | US$ 60.743.865.897 | #50 |
| 2015 | US$ 66.653.739.136 | #48 |
| 2014 | US$ 79.499.076.760 | #46 |
| 2013 | US$ 76.037.444.586 | #50 |
| 2012 | US$ 74.226.993.322 | #49 |
| 2011 | US$ 67.642.788.202 | #49 |
| 2010 | US$ 51.351.305.097 | #50 |
| 2009 | US$ 43.545.176.395 | #52 |
| 2008 | US$ 51.066.655.641 | #50 |
| 2007 | US$ 42.618.891.608 | #51 |
| 2006 | US$ 35.453.316.065 | #49 |
| 2005 | US$ 29.777.716.182 | #51 |
| 2004 | US$ 22.356.075.160 | #52 |
| 2003 | US$ 18.873.043.327 | #49 |
| 2002 | US$ 17.793.883.920 | #48 |
| 2001 | US$ 18.180.843.172 | #49 |
| 2000 | US$ 16.731.018.377 | #49 |
| 1999 | US$ 15.343.463.758 | #47 |
| 1998 | US$ 20.576.289.396 | #44 |
| 1997 | US$ 22.137.740.206 | #42 |
| 1996 | US$ 20.252.680.332 | #42 |
| 1995 | US$ 19.392.751.884 | #41 |
| 1994 | US$ 17.091.698.826 | #40 |
| 1993 | US$ 13.949.161.891 | #41 |
| 1992 | US$ 9.985.578.591 | #49 |
| 1991 | US$ 7.098.679.409 | #52 |
| 1990 | US$ 7.614.454.665 | #54 |
| 1989 | US$ 5.464.066.789 | #51 |
| 1988 | US$ 5.433.539.691 | #50 |
| 1987 | US$ 4.697.932.910 | #52 |
| 1986 | US$ 4.190.788.878 | #51 |
| 1985 | US$ 4.370.638.535 | #49 |
| 1984 | US$ 4.767.852.803 | #49 |
| 1983 | US$ 5.127.945.979 | #47 |
| 1982 | US$ 5.919.610.897 | #47 |
| 1981 | US$ 5.610.414.541 | #49 |
| 1980 | US$ 5.209.514.725 | #47 |
| 1979 | US$ 3.756.624.824 | #48 |
| 1978 | US$ 3.210.026.858 | #48 |
| 1977 | US$ 2.569.926.742 | #50 |
| 1976 | US$ 2.131.690.445 | #49 |
| 1975 | US$ 1.835.324.549 | #51 |
| 1974 | US$ 1.933.488.606 | #47 |
| 1973 | US$ 1.306.397.078 | #46 |
| 1972 | US$ 1.109.769.650 | #45 |
| 1971 | US$ 1.252.577.345 | #43 |
| 1970 | US$ 1.047.700.632 | #45 |
| 1969 | US$ 839.120.872 | - |
| 1968 | US$ 763.579.000 | - |
| 1967 | US$ 602.411.300 | - |
| 1966 | US$ 778.814.815 | - |
| 1965 | US$ 559.333.333 | - |
| 1964 | US$ 755.727.700 | - |
| 1963 | US$ 597.285.656 | - |
| 1962 | US$ 605.929.809 | - |
| 1961 | US$ 627.934.716 | - |
| 1960 | US$ 594.894.695 | - |
Em 2025, as importações de bens e serviços da Colômbia foram de US$ 93,2 bilhões, ante US$ 595 milhões em 1960. O máximo foi de US$ 96,4 bilhões, em 2022. Foram as 52ª maiores do mundo; em 2024, eram as 50ª. Sua melhor posição foi o 40º lugar, ocupado pela última vez em 1994.
Em 2025, as importações de bens e serviços da Colômbia foram as 5ª maiores de 26 países da América Latina. Em 2025, as importações da Colômbia superaram as exportações em US$ 24,7 bilhões, um déficit comercial. O comércio da Colômbia, exportações e importações somadas, equivaleu a 35,4% do seu PIB em 2025, o 159º lugar do mundo.
Importações de bens da Colômbia por categoria, 2025
Importações de bens, 2025: US$ 70,5 bi
Em 2025, a maior categoria das importações de bens da Colômbia foi máquinas, eletrônicos e veículos, com 34,0%, seguida de produtos químicos, farmacêuticos e plásticos, com 19,5%.
Origens das importações de bens da Colômbia: as 10 principais, 2025
| Posição | País | Importações de bens | Participação | |
|---|---|---|---|---|
| 1 |
 China |
US$ 19,4 bi | 27,5% | |
| 2 |
 Estados Unidos |
US$ 16,4 bi | 23,2% | vs EUA |
| 3 |
 México |
US$ 3,54 bi | 5,01% | vs México |
| 4 |
 Brasil |
US$ 3,52 bi | 4,99% | vs Brasil |
| 5 |
 Alemanha |
US$ 2,32 bi | 3,29% | |
| 6 |
 Índia |
US$ 1,75 bi | 2,48% | |
| 7 |
 Japão |
US$ 1,68 bi | 2,39% | vs Japão |
| 8 |
 Coreia do Sul |
US$ 1,39 bi | 1,98% | |
| 9 |
 Espanha |
US$ 1,27 bi | 1,8% | vs Espanha |
| 10 |
 Vietnã |
US$ 1,24 bi | 1,76% | vs Vietnã |
| Outros parceiros e não especificados | US$ 18,1 bi | 25,6% |
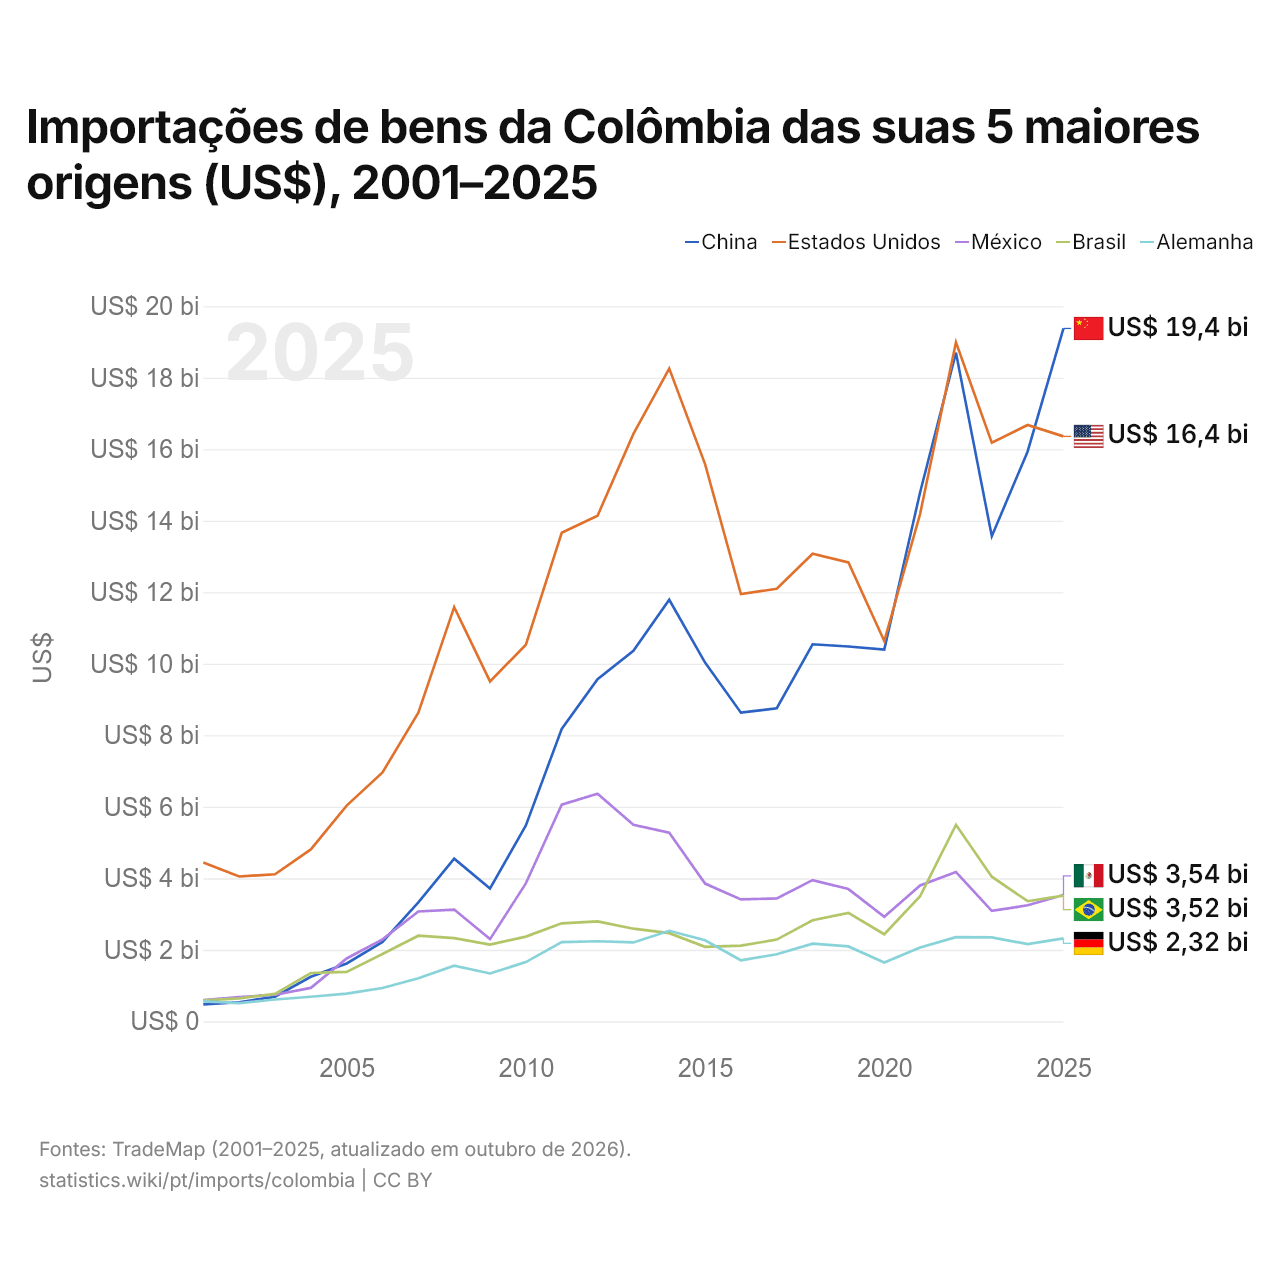
Importações de bens da Colômbia das suas 5 maiores origens (US$), 2001–2025
| Ano | US$ | ||||
|---|---|---|---|---|---|
| China | Estados Unidos | México | Brasil | Alemanha | |
| 2025 | US$ 19.375.906.000 | US$ 16.357.898.000 | US$ 3.535.327.000 | US$ 3.515.636.000 | US$ 2.320.906.000 |
| 2024 | US$ 15.936.097.000 | US$ 16.677.817.000 | US$ 3.245.099.000 | US$ 3.358.750.000 | US$ 2.159.758.000 |
| 2023 | US$ 13.566.855.000 | US$ 16.181.668.000 | US$ 3.090.355.000 | US$ 4.044.885.000 | US$ 2.347.035.000 |
| 2022 | US$ 18.698.741.000 | US$ 18.990.693.000 | US$ 4.174.746.000 | US$ 5.495.150.000 | US$ 2.352.918.000 |
| 2021 | US$ 14.795.946.000 | US$ 14.191.638.000 | US$ 3.800.480.000 | US$ 3.502.317.000 | US$ 2.065.176.000 |
| 2020 | US$ 10.398.882.000 | US$ 10.634.174.000 | US$ 2.925.827.000 | US$ 2.435.489.000 | US$ 1.643.891.000 |
| 2019 | US$ 10.483.257.000 | US$ 12.832.603.000 | US$ 3.698.549.000 | US$ 3.033.232.000 | US$ 2.094.922.000 |
| 2018 | US$ 10.544.729.000 | US$ 13.075.918.000 | US$ 3.947.394.000 | US$ 2.828.205.000 | US$ 2.173.253.000 |
| 2017 | US$ 8.754.463.000 | US$ 12.096.143.000 | US$ 3.436.895.000 | US$ 2.286.013.000 | US$ 1.873.998.000 |
| 2016 | US$ 8.631.421.000 | US$ 11.946.833.000 | US$ 3.410.737.000 | US$ 2.117.351.000 | US$ 1.707.682.000 |
| 2015 | US$ 10.032.489.000 | US$ 15.583.375.000 | US$ 3.852.940.000 | US$ 2.084.310.000 | US$ 2.267.454.000 |
| 2014 | US$ 11.790.385.000 | US$ 18.256.281.000 | US$ 5.272.632.000 | US$ 2.465.559.000 | US$ 2.530.978.000 |
| 2013 | US$ 10.362.788.000 | US$ 16.428.423.000 | US$ 5.495.958.000 | US$ 2.590.480.000 | US$ 2.206.909.000 |
| 2012 | US$ 9.564.690.000 | US$ 14.140.116.000 | US$ 6.362.176.000 | US$ 2.795.908.000 | US$ 2.239.577.000 |
| 2011 | US$ 8.176.440.000 | US$ 13.663.338.000 | US$ 6.059.027.000 | US$ 2.740.248.000 | US$ 2.215.150.000 |
| 2010 | US$ 5.477.428.000 | US$ 10.531.813.000 | US$ 3.856.674.000 | US$ 2.369.637.000 | US$ 1.657.634.000 |
| 2009 | US$ 3.715.170.000 | US$ 9.505.791.000 | US$ 2.297.888.000 | US$ 2.146.578.000 | US$ 1.338.394.000 |
| 2008 | US$ 4.548.798.000 | US$ 11.583.019.000 | US$ 3.125.980.000 | US$ 2.328.416.000 | US$ 1.557.401.000 |
| 2007 | US$ 3.326.574.000 | US$ 8.631.115.000 | US$ 3.072.565.000 | US$ 2.393.940.000 | US$ 1.204.874.000 |
| 2006 | US$ 2.219.273.000 | US$ 6.960.605.000 | US$ 2.290.571.000 | US$ 1.884.885.000 | US$ 933.215.000 |
| 2005 | US$ 1.616.821.000 | US$ 6.033.241.000 | US$ 1.757.068.000 | US$ 1.383.387.000 | US$ 773.661.000 |
| 2004 | US$ 1.244.730.000 | US$ 4.806.760.000 | US$ 935.642.000 | US$ 1.352.172.000 | US$ 686.601.000 |
| 2003 | US$ 688.673.000 | US$ 4.112.710.000 | US$ 744.375.000 | US$ 769.003.000 | US$ 611.672.000 |
| 2002 | US$ 532.847.000 | US$ 4.051.198.000 | US$ 677.990.000 | US$ 642.840.000 | US$ 508.304.000 |
| 2001 | US$ 475.405.000 | US$ 4.442.775.000 | US$ 596.168.000 | US$ 582.060.000 | US$ 560.090.000 |
Em 2025, as importações de bens foram de US$ 19,4 bilhões da China, US$ 16,4 bilhões dos Estados Unidos, US$ 3,54 bilhões do México, US$ 3,52 bilhões do Brasil e US$ 2,32 bilhões da Alemanha. A mudança mais recente nessa ordem foi em 2025, quando as importações da Colômbia vindas da China superaram as vindas dos Estados Unidos.
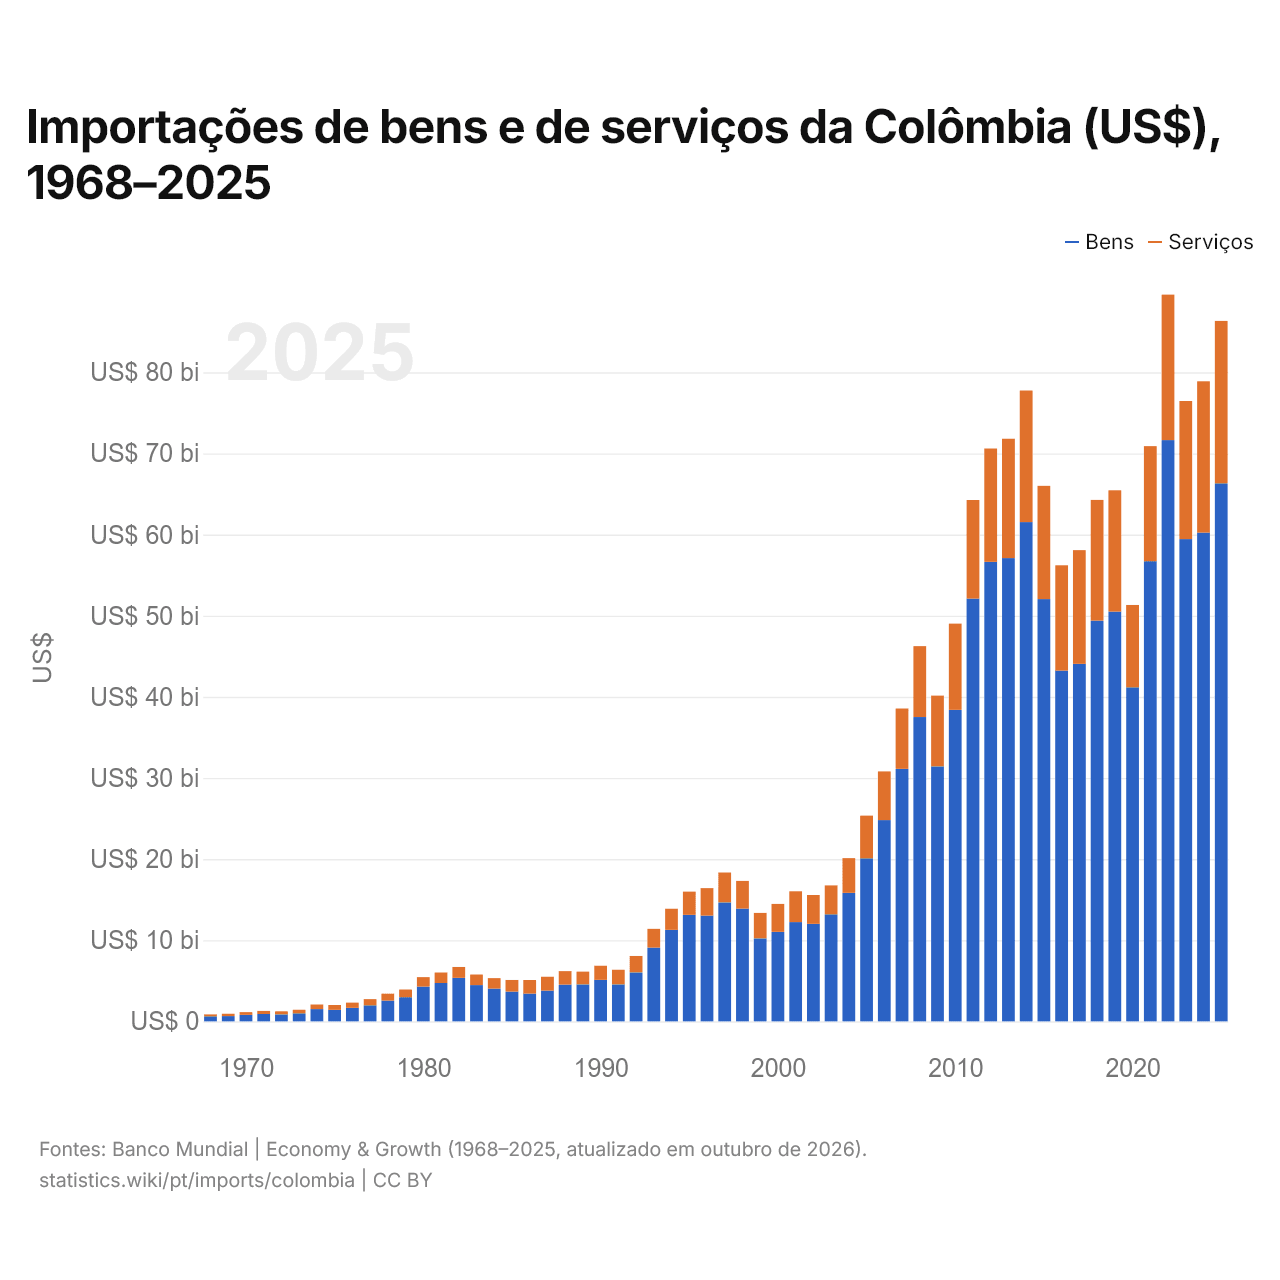
Importações de bens e de serviços da Colômbia (US$), 1968–2025
| Ano | US$ | |
|---|---|---|
| Bens | Serviços | |
| 2025 | US$ 66.328.766.502 | US$ 20.013.563.139 |
| 2024 | US$ 60.246.456.266 | US$ 18.649.901.204 |
| 2023 | US$ 59.449.499.191 | US$ 17.016.822.159 |
| 2022 | US$ 71.651.700.641 | US$ 17.926.837.165 |
| 2021 | US$ 56.719.215.736 | US$ 14.194.903.777 |
| 2020 | US$ 41.178.755.257 | US$ 10.149.628.354 |
| 2019 | US$ 50.518.369.961 | US$ 14.953.812.503 |
| 2018 | US$ 49.387.004.272 | US$ 14.893.206.512 |
| 2017 | US$ 44.070.175.427 | US$ 14.012.970.922 |
| 2016 | US$ 43.238.949.428 | US$ 12.981.015.919 |
| 2015 | US$ 52.050.752.073 | US$ 13.960.164.698 |
| 2014 | US$ 61.539.344.538 | US$ 16.219.413.726 |
| 2013 | US$ 57.103.075.809 | US$ 14.714.215.521 |
| 2012 | US$ 56.648.290.244 | US$ 13.968.400.601 |
| 2011 | US$ 52.125.545.572 | US$ 12.134.769.955 |
| 2010 | US$ 38.405.832.816 | US$ 10.625.769.186 |
| 2009 | US$ 31.428.087.783 | US$ 8.727.171.202 |
| 2008 | US$ 37.511.441.261 | US$ 8.732.021.628 |
| 2007 | US$ 31.116.286.688 | US$ 7.452.916.476 |
| 2006 | US$ 24.810.016.105 | US$ 6.003.257.895 |
| 2005 | US$ 20.094.366.338 | US$ 5.261.068.436 |
| 2004 | US$ 15.838.465.835 | US$ 4.276.873.207 |
| 2003 | US$ 13.195.427.392 | US$ 3.565.191.808 |
| 2002 | US$ 12.024.451.426 | US$ 3.546.487.228 |
| 2001 | US$ 12.229.687.350 | US$ 3.803.932.940 |
| 2000 | US$ 11.042.499.113 | US$ 3.435.499.035 |
| 1999 | US$ 10.226.847.963 | US$ 3.141.980.237 |
| 1998 | US$ 13.897.196.770 | US$ 3.414.323.653 |
| 1997 | US$ 14.662.365.510 | US$ 3.686.748.613 |
| 1996 | US$ 13.040.610.502 | US$ 3.384.740.009 |
| 1995 | US$ 13.128.212.189 | US$ 2.859.921.835 |
| 1994 | US$ 11.272.968.517 | US$ 2.605.441.185 |
| 1993 | US$ 9.085.700.000 | US$ 2.320.700.000 |
| 1992 | US$ 6.029.100.000 | US$ 2.028.300.000 |
| 1991 | US$ 4.548.000.000 | US$ 1.812.000.000 |
| 1990 | US$ 5.108.000.000 | US$ 1.750.000.000 |
| 1989 | US$ 4.557.000.000 | US$ 1.565.000.000 |
| 1988 | US$ 4.516.000.000 | US$ 1.670.000.000 |
| 1987 | US$ 3.793.000.000 | US$ 1.709.000.000 |
| 1986 | US$ 3.409.000.000 | US$ 1.684.000.000 |
| 1985 | US$ 3.673.000.000 | US$ 1.427.000.000 |
| 1984 | US$ 4.027.000.000 | US$ 1.298.000.000 |
| 1983 | US$ 4.464.000.000 | US$ 1.302.000.000 |
| 1982 | US$ 5.357.557.650 | US$ 1.346.072.680 |
| 1981 | US$ 4.730.093.040 | US$ 1.295.062.720 |
| 1980 | US$ 4.283.407.770 | US$ 1.170.477.910 |
| 1979 | US$ 2.977.784.000 | US$ 940.932.000 |
| 1978 | US$ 2.552.152.000 | US$ 856.912.000 |
| 1977 | US$ 1.969.694.240 | US$ 773.239.200 |
| 1976 | US$ 1.654.029.080 | US$ 647.323.760 |
| 1975 | US$ 1.414.944.450 | US$ 597.258.300 |
| 1974 | US$ 1.511.357.440 | US$ 565.972.160 |
| 1973 | US$ 982.708.620 | US$ 439.708.460 |
| 1972 | US$ 849.568.300 | US$ 383.170.070 |
| 1971 | US$ 902.512.140 | US$ 382.025.120 |
| 1970 | US$ 802.000.000 | US$ 334.000.000 |
| 1969 | US$ 648.000.000 | US$ 283.000.000 |
| 1968 | US$ 615.000.000 | US$ 243.000.000 |
Em 2025, as importações de bens da Colômbia foram de US$ 66,3 bilhões e as de serviços, de US$ 20 bilhões; os serviços representaram 23,2% do total, ante 28,3% em 1968.
A Colômbia na classificação mundial de importações, 2025
| Posição | País | Importações | Participação mundial | |
|---|---|---|---|---|
| 49 |
 Argentina |
US$ 101 bi | 0,3% | vs Argentina |
| 50 |
 Iraque |
US$ 98,3 bi | 0,29% | |
| 51 |
 Marrocos |
US$ 93,3 bi | 0,28% | |
| 52 |
 Colômbia |
US$ 93,2 bi | 0,28% | |
| 53 |
 Cazaquistão |
US$ 80,3 bi | 0,24% | |
| 54 |
 Bangladesh |
US$ 76,8 bi | 0,23% | |
| 55 |
 Peru |
US$ 73,2 bi | 0,22% | vs Peru |
Importações de bens e serviços da Colômbia, % do PIB, 1960–2025
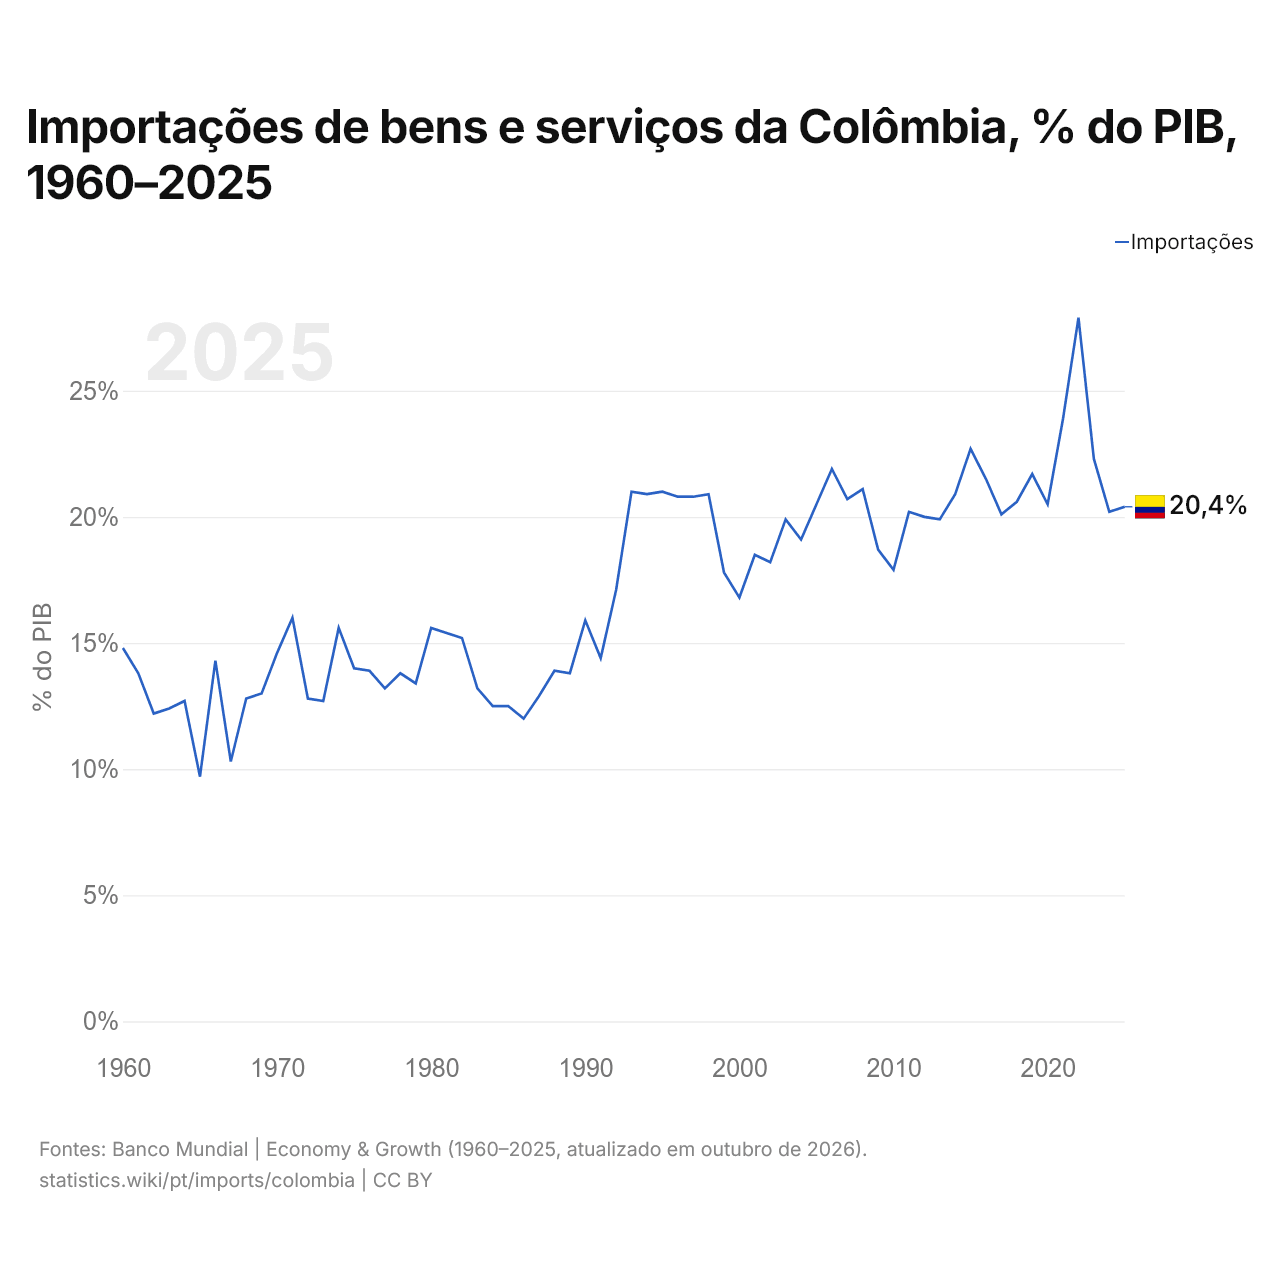
Em 2025, as importações de bens e serviços da Colômbia equivaleram a 20,4% do seu PIB, ante 14,8% em 1960. A maior participação foi de 27,9%, em 2022.
Comparar as importações da Colômbia com as de outros países
Fontes:
- Banco Mundial | Economy & Growth (1960–2025, atualizado em outubro de 2026)
- TradeMap (2001–2025, atualizado em outubro de 2026)
Creative Commons Atribuição (CC BY): você pode copiar, compartilhar, adaptar e reutilizar este conteúdo, inclusive para fins comerciais, desde que cite o statistics.wiki e indique as alterações que fizer. As fontes listadas acima podem ter suas próprias condições de licença.