
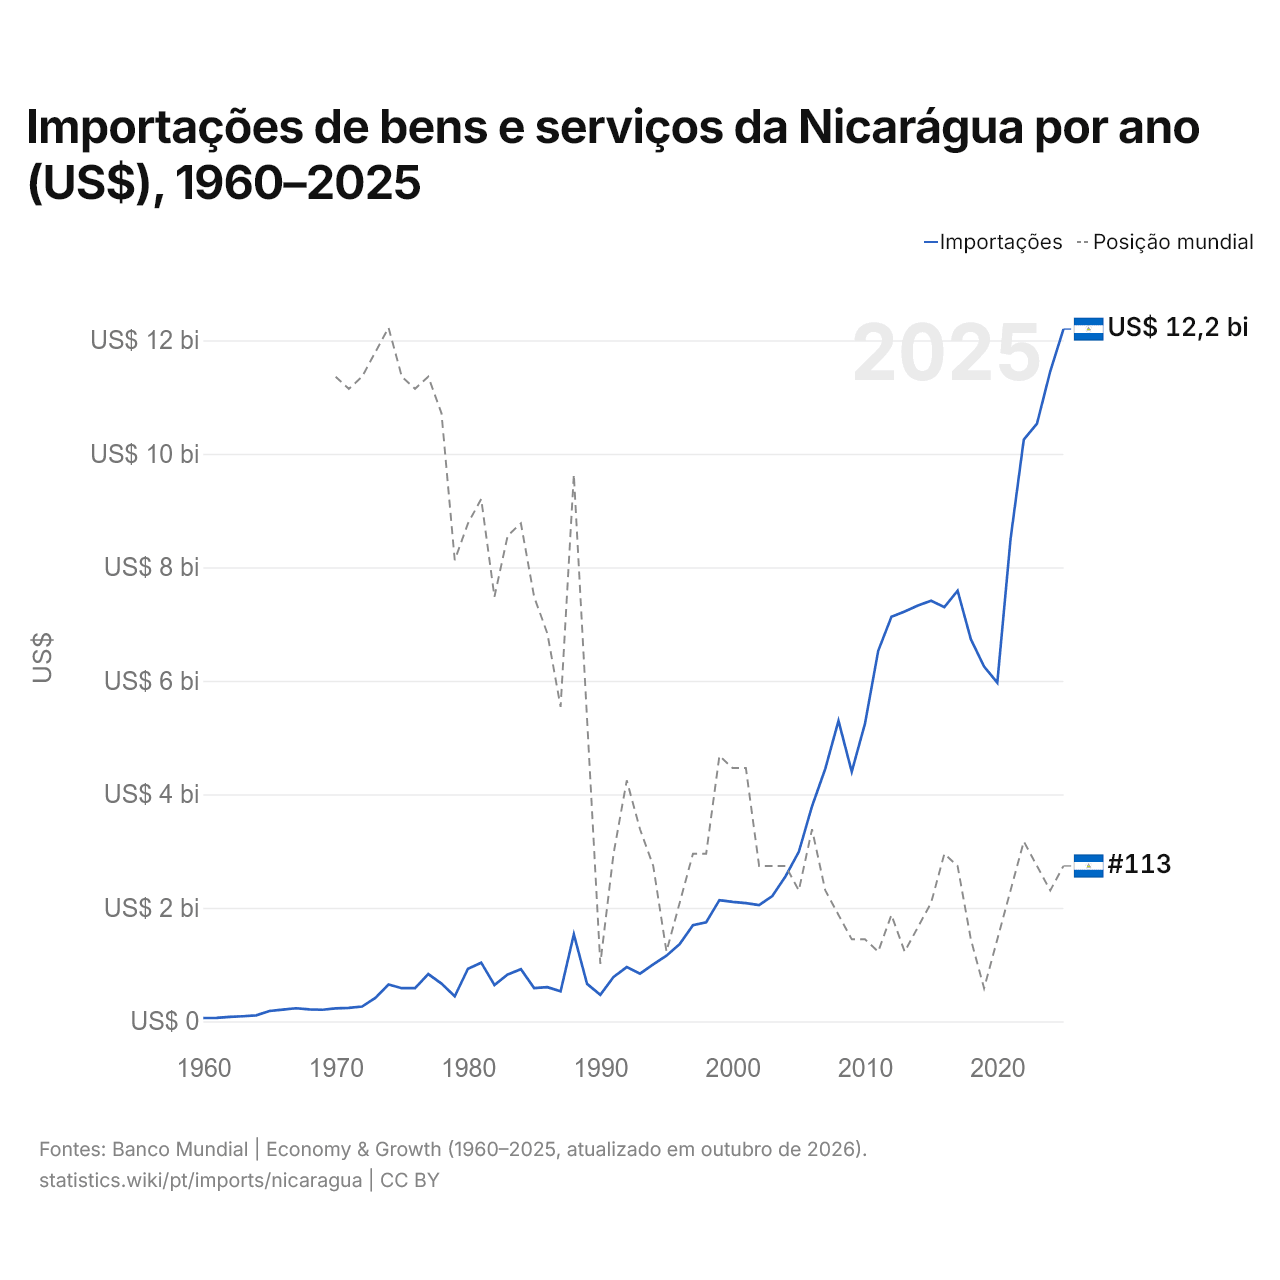
Importações de bens e serviços da Nicarágua por ano (US$), 1960–2025
| Ano | US$ | Posição mundial |
|---|---|---|
| Importações | Posição mundial | |
| 2025 | US$ 12.198.469.836 | #113 |
| 2024 | US$ 11.455.318.548 | #115 |
| 2023 | US$ 10.532.819.128 | #113 |
| 2022 | US$ 10.249.854.374 | #111 |
| 2021 | US$ 8.497.441.442 | #115 |
| 2020 | US$ 5.967.676.881 | #119 |
| 2019 | US$ 6.252.718.089 | #123 |
| 2018 | US$ 6.735.028.773 | #119 |
| 2017 | US$ 7.587.978.453 | #113 |
| 2016 | US$ 7.298.277.151 | #112 |
| 2015 | US$ 7.412.965.477 | #116 |
| 2014 | US$ 7.329.057.911 | #118 |
| 2013 | US$ 7.223.504.605 | #120 |
| 2012 | US$ 7.131.030.120 | #117 |
| 2011 | US$ 6.530.275.932 | #120 |
| 2010 | US$ 5.246.135.011 | #119 |
| 2009 | US$ 4.399.317.810 | #119 |
| 2008 | US$ 5.295.609.531 | #117 |
| 2007 | US$ 4.451.215.795 | #115 |
| 2006 | US$ 3.790.567.751 | #110 |
| 2005 | US$ 2.987.684.968 | #115 |
| 2004 | US$ 2.556.737.616 | #113 |
| 2003 | US$ 2.207.131.661 | #113 |
| 2002 | US$ 2.050.007.301 | #113 |
| 2001 | US$ 2.083.877.017 | #105 |
| 2000 | US$ 2.104.655.848 | #105 |
| 1999 | US$ 2.137.009.200 | #104 |
| 1998 | US$ 1.746.565.268 | #112 |
| 1997 | US$ 1.693.914.533 | #112 |
| 1996 | US$ 1.362.967.813 | #116 |
| 1995 | US$ 1.157.042.258 | #120 |
| 1994 | US$ 1.002.161.964 | #113 |
| 1993 | US$ 840.604.575 | #110 |
| 1992 | US$ 954.960.000 | #106 |
| 1991 | US$ 781.711.340 | #112 |
| 1990 | US$ 467.806.452 | #121 |
| 1989 | US$ 660.512.092 | #101 |
| 1988 | US$ 1.533.030.883 | #81 |
| 1987 | US$ 529.939.250 | #100 |
| 1986 | US$ 601.158.384 | #94 |
| 1985 | US$ 585.751.366 | #91 |
| 1984 | US$ 918.158.455 | #85 |
| 1983 | US$ 825.726.780 | #86 |
| 1982 | US$ 639.525.499 | #91 |
| 1981 | US$ 1.033.954.423 | #83 |
| 1980 | US$ 927.803.482 | #85 |
| 1979 | US$ 441.002.913 | #88 |
| 1978 | US$ 664.891.168 | #76 |
| 1977 | US$ 833.487.995 | #73 |
| 1976 | US$ 584.906.472 | #74 |
| 1975 | US$ 584.238.746 | #73 |
| 1974 | US$ 648.227.312 | #69 |
| 1973 | US$ 413.146.202 | #71 |
| 1972 | US$ 260.426.280 | #73 |
| 1971 | US$ 236.470.381 | #74 |
| 1970 | US$ 227.279.250 | #73 |
| 1969 | US$ 203.851.355 | - |
| 1968 | US$ 210.576.069 | - |
| 1967 | US$ 230.288.988 | - |
| 1966 | US$ 207.159.869 | - |
| 1965 | US$ 182.869.912 | - |
| 1964 | US$ 105.871.526 | - |
| 1963 | US$ 89.918.284 | - |
| 1962 | US$ 77.832.506 | - |
| 1961 | US$ 59.945.532 | - |
| 1960 | US$ 59.462.106 | - |
Em 2025, as importações de bens e serviços da Nicarágua foram de US$ 12,2 bilhões, ante US$ 59,5 milhões em 1960. Foram as 113ª maiores do mundo; em 2024, eram as 115ª. Sua melhor posição foi o 69º lugar, ocupado pela última vez em 1974.
Em 2025, as importações de bens e serviços da Nicarágua foram as 17ª maiores de 26 países da América Latina. Em 2025, as importações da Nicarágua superaram as exportações em US$ 2,95 bilhões, um déficit comercial. O comércio da Nicarágua, exportações e importações somadas, equivaleu a 96,4% do seu PIB em 2025, o 64º lugar do mundo.
Importações de bens da Nicarágua por categoria, 2025
Importações de bens, 2025: US$ 12,4 bi
Em 2025, a maior categoria das importações de bens da Nicarágua foi máquinas, eletrônicos e veículos, com 24,5%, seguida de têxteis, roupas, calçados, móveis e brinquedos, com 18,0%.
Origens das importações de bens da Nicarágua: as 10 principais, 2025
| Posição | País | Importações de bens | Participação | |
|---|---|---|---|---|
| 1 |
 Estados Unidos |
US$ 2,65 bi | 21,4% | |
| 2 |
 China |
US$ 2,08 bi | 16,8% | |
| 3 |
 Honduras |
US$ 1,15 bi | 9,32% | |
| 4 |
 México |
US$ 1,01 bi | 8,14% | |
| 5 |
 Guatemala |
US$ 923 mi | 7,46% | |
| 6 |
 Costa Rica |
US$ 772 mi | 6,24% | vs Costa Rica |
| 7 |
 El Salvador |
US$ 477 mi | 3,85% | |
| 8 |
 Índia |
US$ 398 mi | 3,22% | |
| 9 |
 Japão |
US$ 294 mi | 2,38% | |
| 10 |
 Brasil |
US$ 221 mi | 1,79% | vs Brasil |
| Outros parceiros e não especificados | US$ 2,40 bi | 19,4% |
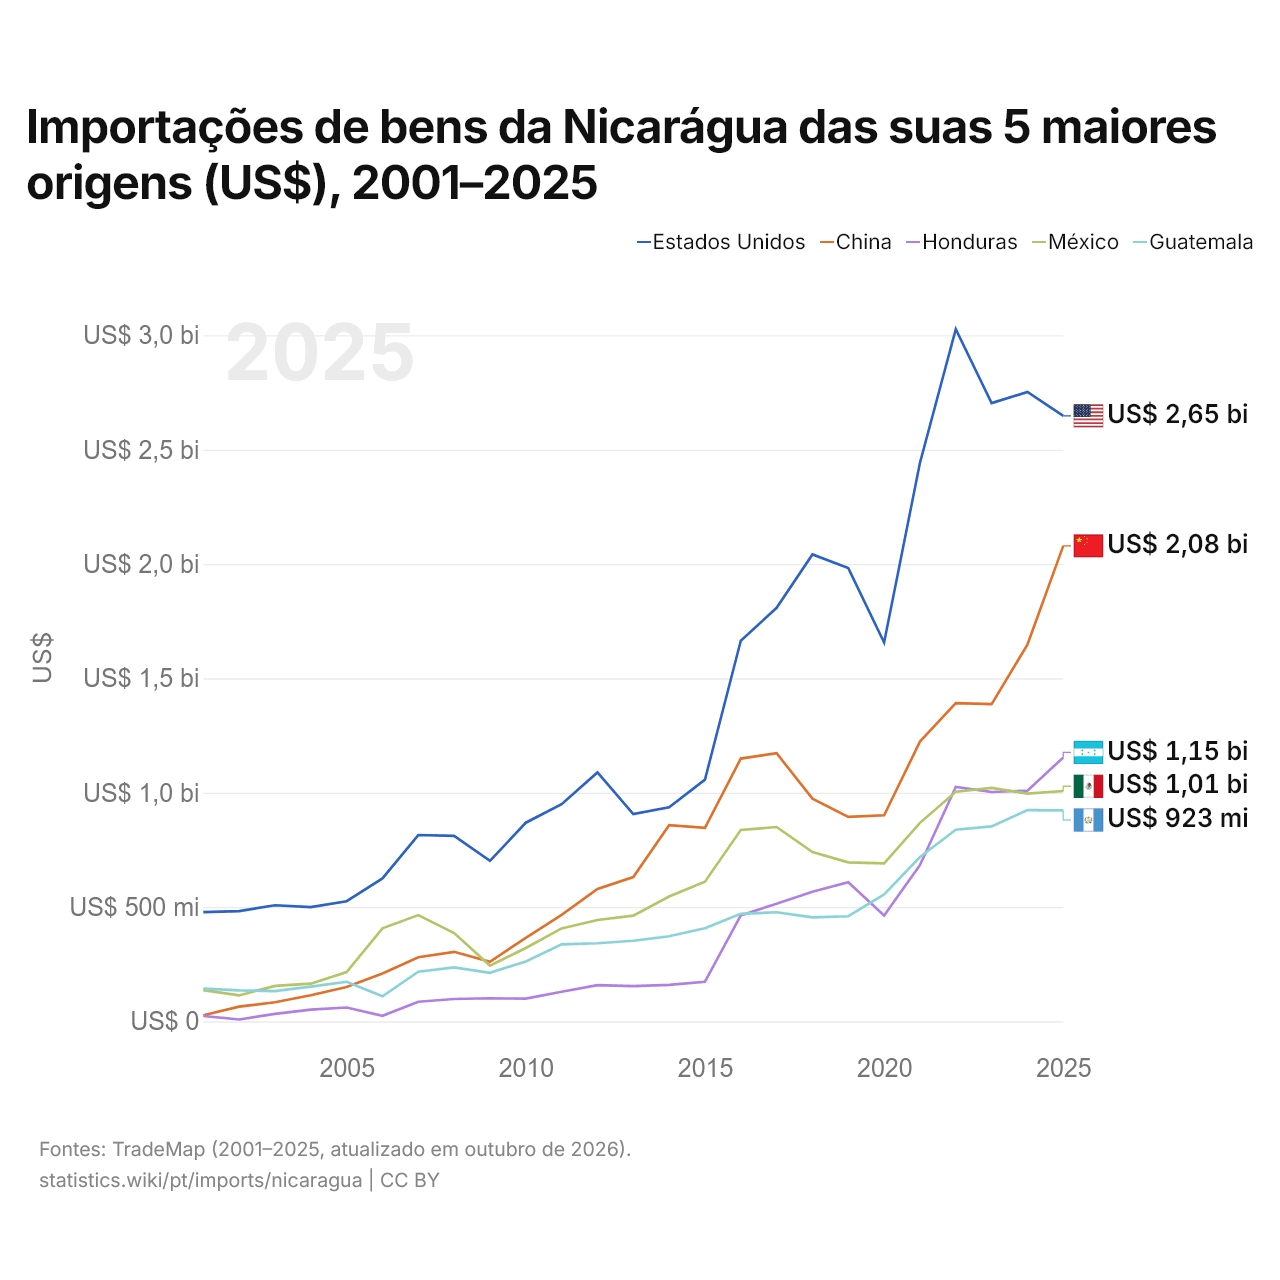
Importações de bens da Nicarágua das suas 5 maiores origens (US$), 2001–2025
| Ano | US$ | ||||
|---|---|---|---|---|---|
| Estados Unidos | China | Honduras | México | Guatemala | |
| 2025 | US$ 2.647.653.000 | US$ 2.079.184.000 | US$ 1.154.143.000 | US$ 1.007.323.000 | US$ 922.814.000 |
| 2024 | US$ 2.752.194.000 | US$ 1.647.457.000 | US$ 1.008.668.000 | US$ 995.835.000 | US$ 923.760.000 |
| 2023 | US$ 2.703.379.000 | US$ 1.386.926.000 | US$ 1.002.684.000 | US$ 1.020.778.000 | US$ 852.226.000 |
| 2022 | US$ 3.026.689.000 | US$ 1.391.665.000 | US$ 1.024.638.000 | US$ 1.004.163.000 | US$ 837.667.000 |
| 2021 | US$ 2.442.406.000 | US$ 1.223.170.000 | US$ 683.160.000 | US$ 867.960.000 | US$ 718.435.000 |
| 2020 | US$ 1.656.488.000 | US$ 900.891.000 | US$ 462.927.000 | US$ 690.900.000 | US$ 554.605.000 |
| 2019 | US$ 1.981.937.000 | US$ 893.851.000 | US$ 607.907.000 | US$ 695.324.000 | US$ 459.467.000 |
| 2018 | US$ 2.041.603.000 | US$ 973.553.000 | US$ 566.907.000 | US$ 740.407.000 | US$ 454.779.000 |
| 2017 | US$ 1.808.025.000 | US$ 1.172.354.000 | US$ 514.593.000 | US$ 849.814.000 | US$ 476.831.000 |
| 2016 | US$ 1.664.327.000 | US$ 1.149.017.000 | US$ 462.980.000 | US$ 836.554.000 | US$ 470.051.000 |
| 2015 | US$ 1.056.805.000 | US$ 846.151.000 | US$ 173.092.000 | US$ 610.294.000 | US$ 406.853.000 |
| 2014 | US$ 935.713.000 | US$ 857.868.000 | US$ 159.440.000 | US$ 545.839.000 | US$ 372.068.000 |
| 2013 | US$ 905.967.000 | US$ 630.844.000 | US$ 153.844.000 | US$ 461.982.000 | US$ 352.524.000 |
| 2012 | US$ 1.088.343.000 | US$ 578.585.000 | US$ 158.430.000 | US$ 443.335.000 | US$ 341.380.000 |
| 2011 | US$ 949.295.000 | US$ 465.356.000 | US$ 129.610.000 | US$ 406.335.000 | US$ 336.695.000 |
| 2010 | US$ 868.550.000 | US$ 365.453.000 | US$ 99.128.000 | US$ 320.906.000 | US$ 261.835.000 |
| 2009 | US$ 701.676.000 | US$ 260.457.000 | US$ 100.771.000 | US$ 243.619.000 | US$ 212.328.000 |
| 2008 | US$ 810.865.000 | US$ 303.995.000 | US$ 97.576.000 | US$ 386.018.000 | US$ 235.648.000 |
| 2007 | US$ 814.661.000 | US$ 280.315.000 | US$ 85.667.000 | US$ 464.679.000 | US$ 216.818.000 |
| 2006 | US$ 624.744.000 | US$ 208.959.000 | US$ 24.248.000 | US$ 406.878.000 | US$ 109.451.000 |
| 2005 | US$ 525.364.000 | US$ 149.890.000 | US$ 60.412.000 | US$ 215.742.000 | US$ 173.046.000 |
| 2004 | US$ 499.130.000 | US$ 114.060.000 | US$ 51.468.000 | US$ 164.558.000 | US$ 152.001.000 |
| 2003 | US$ 507.437.000 | US$ 83.336.000 | US$ 32.763.000 | US$ 154.979.000 | US$ 132.160.000 |
| 2002 | US$ 482.002.000 | US$ 64.274.000 | US$ 8.210.000 | US$ 113.320.000 | US$ 135.292.000 |
| 2001 | US$ 477.494.000 | US$ 26.521.000 | US$ 23.363.000 | US$ 136.694.000 | US$ 142.897.000 |
Em 2025, as importações de bens foram de US$ 2,65 bilhões dos Estados Unidos, US$ 2,08 bilhões da China, US$ 1,15 bilhão de Honduras, US$ 1,01 bilhão do México e US$ 923 milhões da Guatemala. O primeiro lugar dos cinco fornecedores da Nicarágua ficou com os Estados Unidos em todos os anos desde 2001. A mudança mais recente nessa ordem foi em 2024, quando as importações da Nicarágua vindas de Honduras superaram as vindas do México.
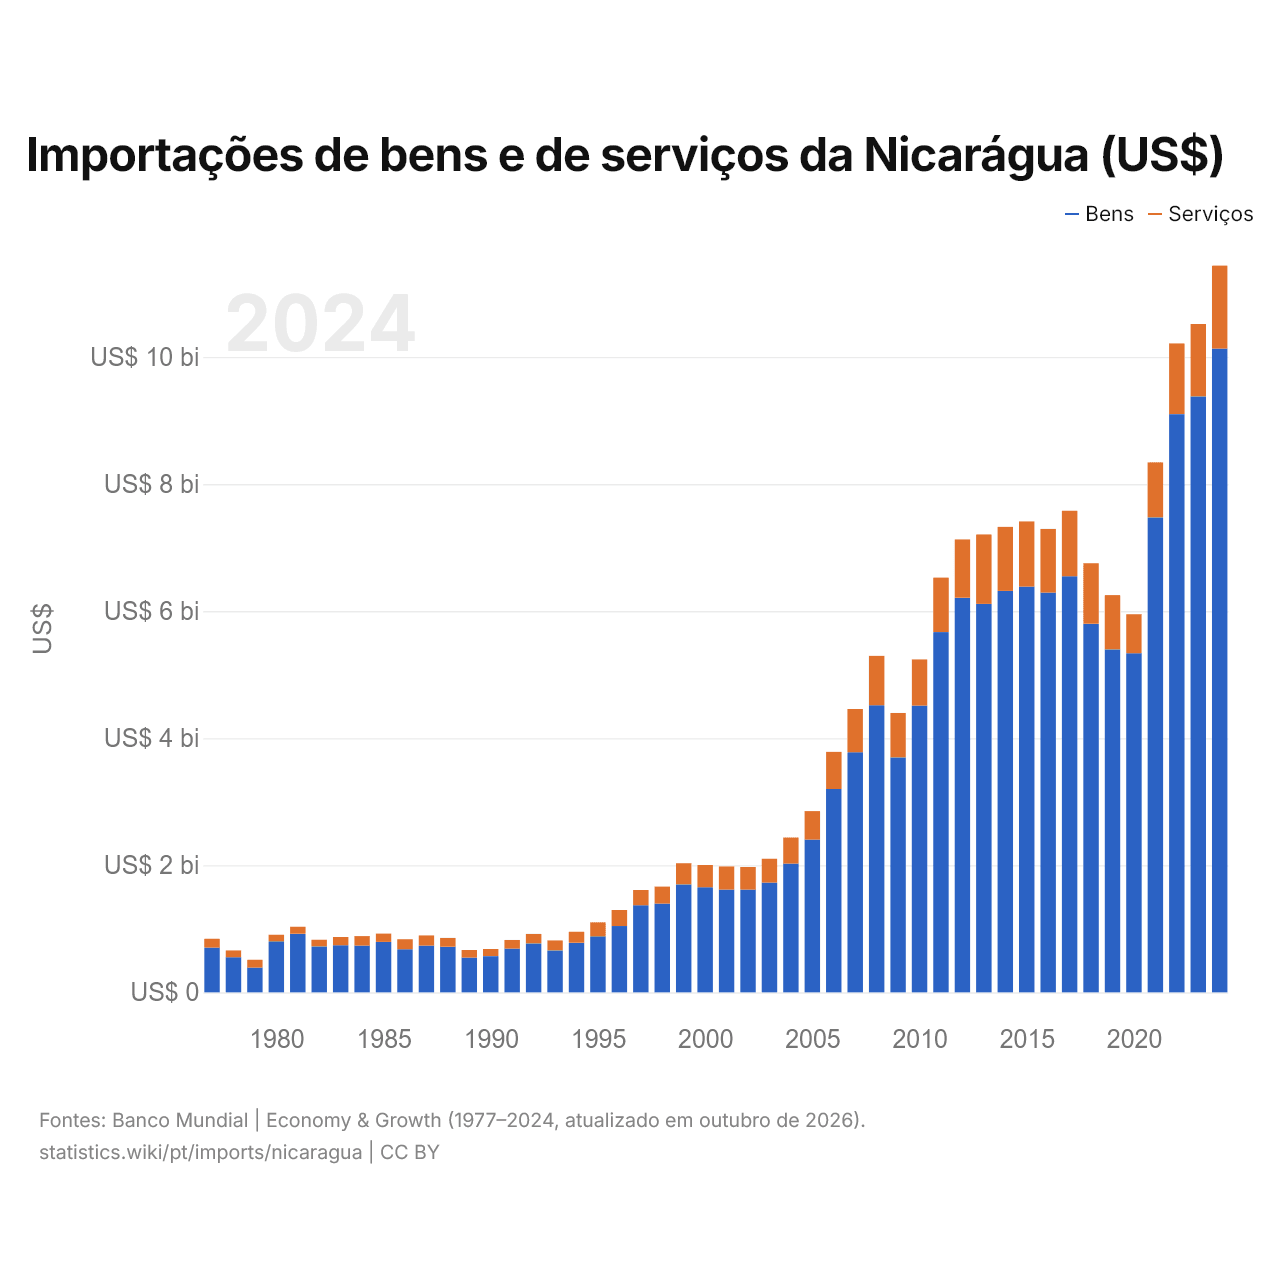
Importações de bens e de serviços da Nicarágua (US$)
| Ano | US$ | |
|---|---|---|
| Bens | Serviços | |
| 2024 | US$ 10.131.300.000 | US$ 1.306.000.000 |
| 2023 | US$ 9.380.200.000 | US$ 1.138.600.000 |
| 2022 | US$ 9.100.500.000 | US$ 1.112.500.000 |
| 2021 | US$ 7.474.700.000 | US$ 867.100.000 |
| 2020 | US$ 5.338.500.000 | US$ 613.000.000 |
| 2019 | US$ 5.396.900.000 | US$ 854.600.000 |
| 2018 | US$ 5.801.500.000 | US$ 952.700.000 |
| 2017 | US$ 6.549.100.000 | US$ 1.030.500.000 |
| 2016 | US$ 6.291.600.000 | US$ 1.002.100.000 |
| 2015 | US$ 6.387.600.000 | US$ 1.024.200.000 |
| 2014 | US$ 6.318.700.000 | US$ 1.006.800.000 |
| 2013 | US$ 6.113.900.000 | US$ 1.092.200.000 |
| 2012 | US$ 6.209.800.000 | US$ 918.800.000 |
| 2011 | US$ 5.669.600.000 | US$ 857.800.000 |
| 2010 | US$ 4.512.900.000 | US$ 725.800.000 |
| 2009 | US$ 3.697.300.000 | US$ 699.800.000 |
| 2008 | US$ 4.518.300.000 | US$ 778.100.000 |
| 2007 | US$ 3.778.100.000 | US$ 681.600.000 |
| 2006 | US$ 3.200.600.000 | US$ 584.500.000 |
| 2005 | US$ 2.404.600.000 | US$ 448.200.000 |
| 2004 | US$ 2.027.700.000 | US$ 409.000.000 |
| 2003 | US$ 1.726.100.000 | US$ 376.800.000 |
| 2002 | US$ 1.617.500.000 | US$ 355.400.000 |
| 2001 | US$ 1.617.300.000 | US$ 363.700.000 |
| 2000 | US$ 1.653.200.000 | US$ 350.700.000 |
| 1999 | US$ 1.698.100.000 | US$ 334.700.000 |
| 1998 | US$ 1.397.000.000 | US$ 267.800.000 |
| 1997 | US$ 1.370.600.000 | US$ 239.400.000 |
| 1996 | US$ 1.043.400.000 | US$ 252.800.000 |
| 1995 | US$ 881.400.000 | US$ 220.500.000 |
| 1994 | US$ 780.500.000 | US$ 172.900.000 |
| 1993 | US$ 659.400.000 | US$ 156.600.000 |
| 1992 | US$ 770.800.000 | US$ 148.300.000 |
| 1991 | US$ 688.000.000 | US$ 136.200.000 |
| 1990 | US$ 569.700.000 | US$ 112.300.000 |
| 1989 | US$ 547.300.000 | US$ 119.200.000 |
| 1988 | US$ 718.300.000 | US$ 138.100.000 |
| 1987 | US$ 734.400.000 | US$ 160.500.000 |
| 1986 | US$ 677.400.000 | US$ 159.100.000 |
| 1985 | US$ 794.100.000 | US$ 129.600.000 |
| 1984 | US$ 735.300.000 | US$ 149.000.000 |
| 1983 | US$ 742.300.000 | US$ 128.200.000 |
| 1982 | US$ 723.500.000 | US$ 103.500.000 |
| 1981 | US$ 922.400.000 | US$ 110.200.000 |
| 1980 | US$ 802.900.000 | US$ 103.700.000 |
| 1979 | US$ 388.900.000 | US$ 123.600.000 |
| 1978 | US$ 553.300.000 | US$ 106.600.000 |
| 1977 | US$ 704.200.000 | US$ 139.200.000 |
As importações de bens da Nicarágua são de US$ 10,1 bilhões (2024) e as de serviços, de US$ 1,31 bilhão; os serviços representam 11,4% do total, ante 16,5% em 1977.
A Nicarágua na classificação mundial de importações, 2025
| Posição | País | Importações | Participação mundial | |
|---|---|---|---|---|
| 110 |
 Somália |
US$ 12,8 bi | 0,04% | |
| 111 |
 Moçambique |
US$ 12,4 bi | 0,04% | |
| 112 |
 Moldávia |
US$ 12,4 bi | 0,04% | |
| 113 |
 Nicarágua |
US$ 12,2 bi | 0,04% | |
| 114 |
 Maurício |
US$ 12,1 bi | 0,04% | |
| 115 |
 Afeganistão |
US$ 12,1 bi (2024) | 0,04% | |
| 116 |
 Camarões |
US$ 12,0 bi | 0,04% |
Importações de bens e serviços da Nicarágua, % do PIB, 1960–2025
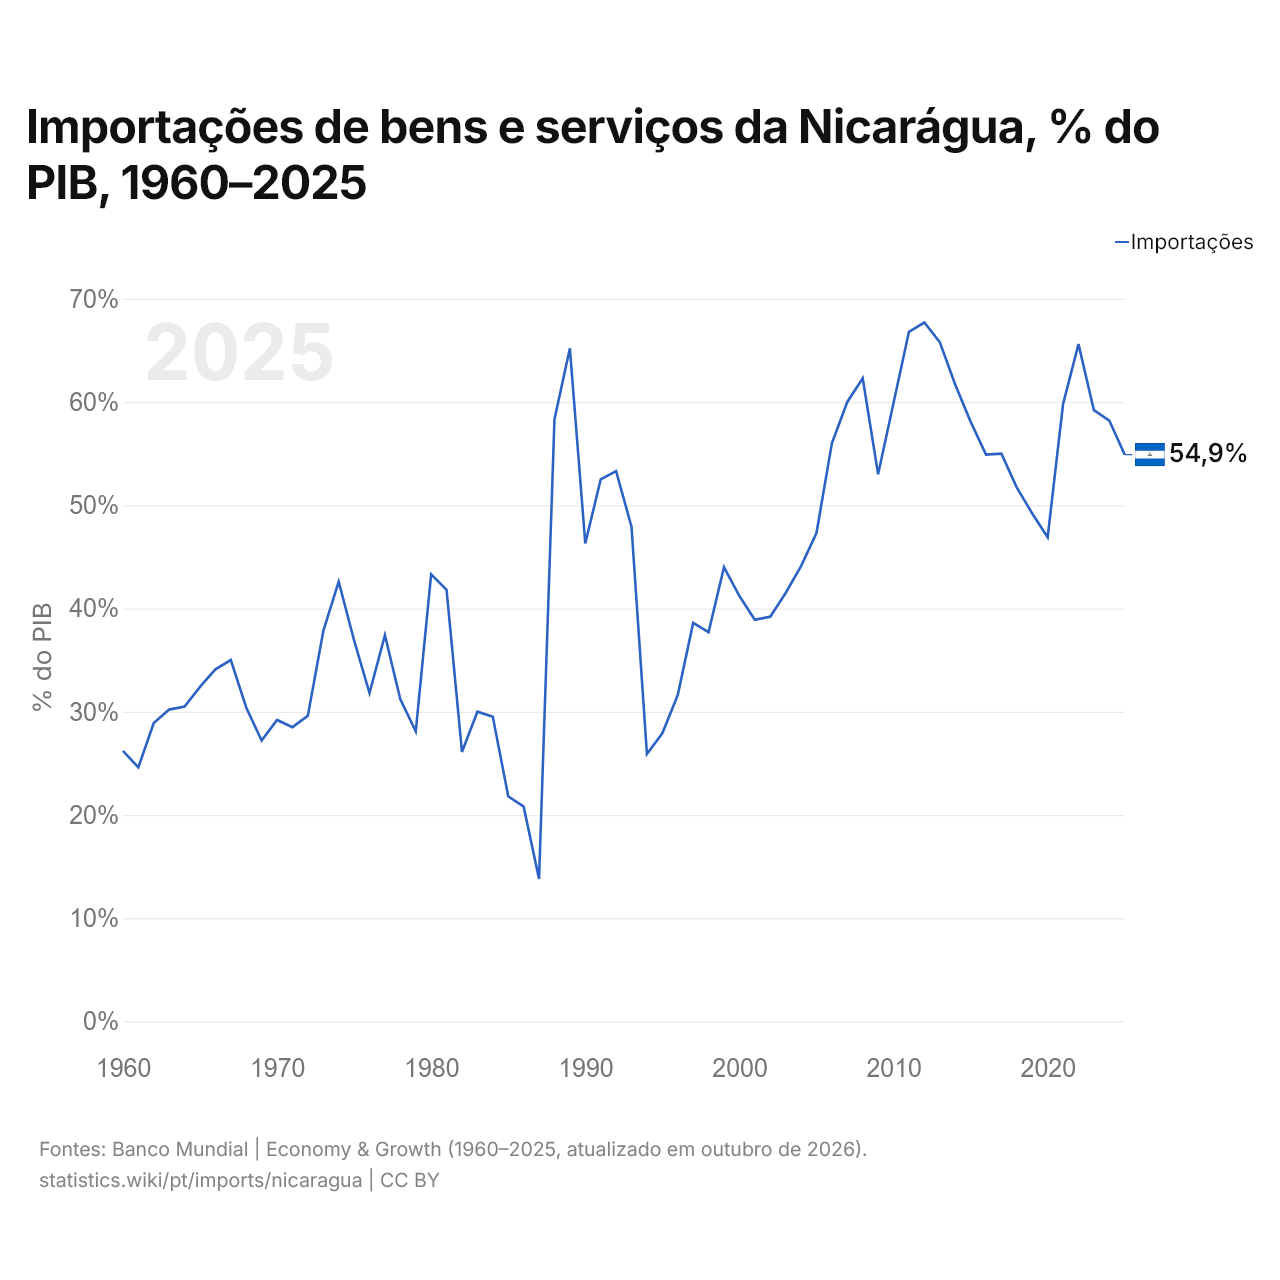
Em 2025, as importações de bens e serviços da Nicarágua equivaleram a 54,9% do seu PIB, ante 26,2% em 1960. A maior participação foi de 67,7%, em 2012.
Comparar as importações da Nicarágua com as de outros países
Fontes:
- Banco Mundial | Economy & Growth (1960–2025, atualizado em outubro de 2026)
- TradeMap (2001–2025, atualizado em outubro de 2026)
Creative Commons Atribuição (CC BY): você pode copiar, compartilhar, adaptar e reutilizar este conteúdo, inclusive para fins comerciais, desde que cite o statistics.wiki e indique as alterações que fizer. As fontes listadas acima podem ter suas próprias condições de licença.