
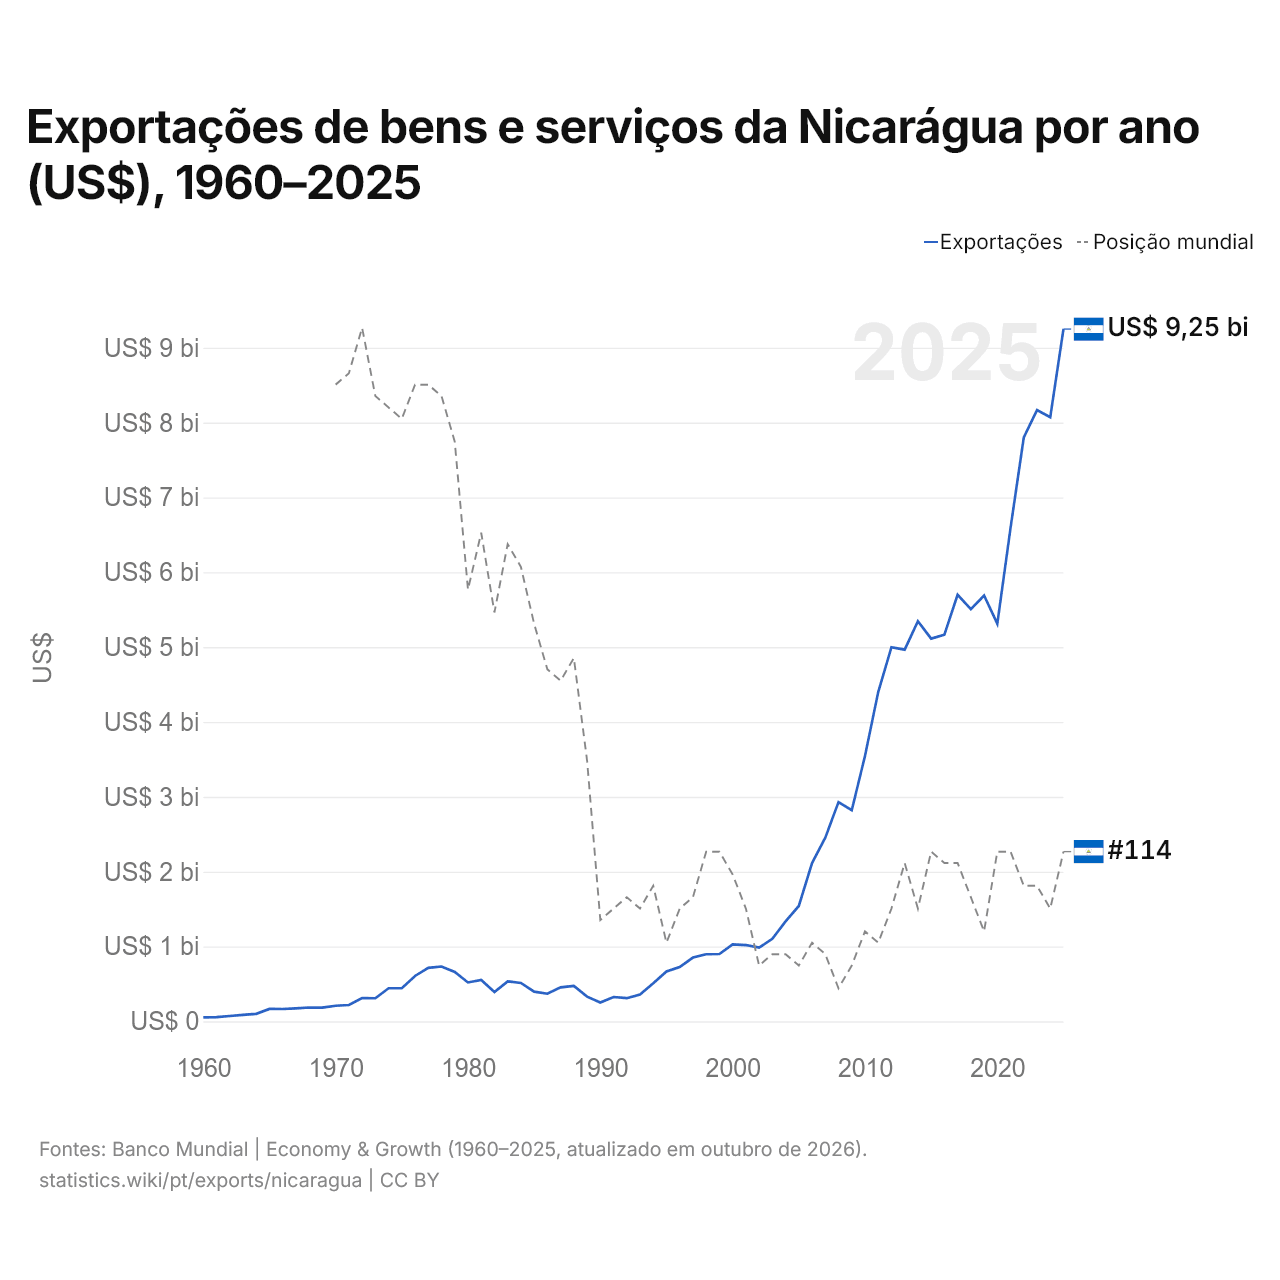
Exportações de bens e serviços da Nicarágua por ano (US$), 1960–2025
| Ano | US$ | Posição mundial |
|---|---|---|
| Exportações | Posição mundial | |
| 2025 | US$ 9.249.209.962 | #114 |
| 2024 | US$ 8.072.799.619 | #119 |
| 2023 | US$ 8.166.793.679 | #117 |
| 2022 | US$ 7.800.991.077 | #117 |
| 2021 | US$ 6.593.588.346 | #114 |
| 2020 | US$ 5.312.785.104 | #114 |
| 2019 | US$ 5.689.725.119 | #121 |
| 2018 | US$ 5.506.692.298 | #118 |
| 2017 | US$ 5.698.946.073 | #115 |
| 2016 | US$ 5.165.902.338 | #115 |
| 2015 | US$ 5.113.365.846 | #114 |
| 2014 | US$ 5.347.156.490 | #119 |
| 2013 | US$ 4.965.877.905 | #115 |
| 2012 | US$ 4.999.461.750 | #119 |
| 2011 | US$ 4.400.107.700 | #122 |
| 2010 | US$ 3.544.353.652 | #121 |
| 2009 | US$ 2.820.023.106 | #124 |
| 2008 | US$ 2.928.943.987 | #126 |
| 2007 | US$ 2.454.433.020 | #123 |
| 2006 | US$ 2.114.772.341 | #122 |
| 2005 | US$ 1.541.273.560 | #124 |
| 2004 | US$ 1.335.841.956 | #123 |
| 2003 | US$ 1.101.967.322 | #123 |
| 2002 | US$ 984.522.983 | #124 |
| 2001 | US$ 1.019.075.853 | #119 |
| 2000 | US$ 1.027.444.240 | #116 |
| 1999 | US$ 899.835.239 | #114 |
| 1998 | US$ 896.218.483 | #114 |
| 1997 | US$ 852.512.885 | #118 |
| 1996 | US$ 725.843.474 | #119 |
| 1995 | US$ 666.412.218 | #122 |
| 1994 | US$ 507.617.768 | #117 |
| 1993 | US$ 358.807.190 | #119 |
| 1992 | US$ 309.280.000 | #118 |
| 1991 | US$ 324.886.598 | #119 |
| 1990 | US$ 251.842.581 | #120 |
| 1989 | US$ 329.660.036 | #106 |
| 1988 | US$ 473.058.950 | #97 |
| 1987 | US$ 453.312.553 | #99 |
| 1986 | US$ 368.698.848 | #98 |
| 1985 | US$ 396.280.490 | #94 |
| 1984 | US$ 512.628.154 | #89 |
| 1983 | US$ 534.109.825 | #87 |
| 1982 | US$ 392.200.153 | #93 |
| 1981 | US$ 552.951.120 | #86 |
| 1980 | US$ 519.538.168 | #91 |
| 1979 | US$ 658.777.312 | #78 |
| 1978 | US$ 732.135.142 | #74 |
| 1977 | US$ 714.673.957 | #73 |
| 1976 | US$ 606.080.025 | #73 |
| 1975 | US$ 443.524.241 | #76 |
| 1974 | US$ 442.345.370 | #75 |
| 1973 | US$ 308.310.585 | #74 |
| 1972 | US$ 310.040.793 | #68 |
| 1971 | US$ 217.911.328 | #72 |
| 1970 | US$ 208.130.437 | #73 |
| 1969 | US$ 182.894.687 | - |
| 1968 | US$ 184.888.776 | - |
| 1967 | US$ 173.891.684 | - |
| 1966 | US$ 164.627.049 | - |
| 1965 | US$ 165.339.903 | - |
| 1964 | US$ 100.227.288 | - |
| 1963 | US$ 85.701.582 | - |
| 1962 | US$ 71.175.904 | - |
| 1961 | US$ 57.134.379 | - |
| 1960 | US$ 53.745.065 | - |
Em 2025, as exportações de bens e serviços da Nicarágua foram de US$ 9,25 bilhões, ante US$ 53,7 milhões em 1960. Foram as 114ª maiores do mundo; em 2024, eram as 119ª. Sua melhor posição foi o 68º lugar, ocupado pela última vez em 1972.
Em 2025, as exportações de bens e serviços da Nicarágua foram as 19ª maiores de 27 países da América Latina. As importações de bens e serviços da Nicarágua foram de US$ 12,2 bilhões em 2025, as 113ª maiores do mundo. Em 2025, as importações da Nicarágua superaram as exportações em US$ 2,95 bilhões, um déficit comercial.
Exportações de bens da Nicarágua por categoria, 2025
Exportações de bens, 2025: US$ 8,72 bi
Em 2025, a maior categoria das exportações de bens da Nicarágua foi metais preciosos, pedras preciosas, joias, relógios, instrumentos musicais e arte, com 23,0%, seguida de têxteis, roupas, calçados, móveis e brinquedos, com 21,1%.
Destinos das exportações de bens da Nicarágua: os 10 principais, 2025
| Posição | País | Exportações de bens | Participação | |
|---|---|---|---|---|
| 1 |
 Estados Unidos |
US$ 4,02 bi | 46,1% | |
| 2 |
 México |
US$ 1,06 bi | 12,2% | |
| 3 |
 Canadá |
US$ 932 mi | 10,7% | |
| 4 |
 El Salvador |
US$ 530 mi | 6,08% | |
| 5 |
 Honduras |
US$ 470 mi | 5,39% | |
| 6 |
 Bélgica |
US$ 212 mi | 2,44% | |
| 7 |
 Costa Rica |
US$ 204 mi | 2,34% | vs Costa Rica |
| 8 |
 Guatemala |
US$ 152 mi | 1,75% | |
| 9 |
 China |
US$ 102 mi | 1,17% | |
| 10 |
 Alemanha |
US$ 101 mi | 1,16% | |
| Outros parceiros e não especificados | US$ 931 mi | 10,7% |
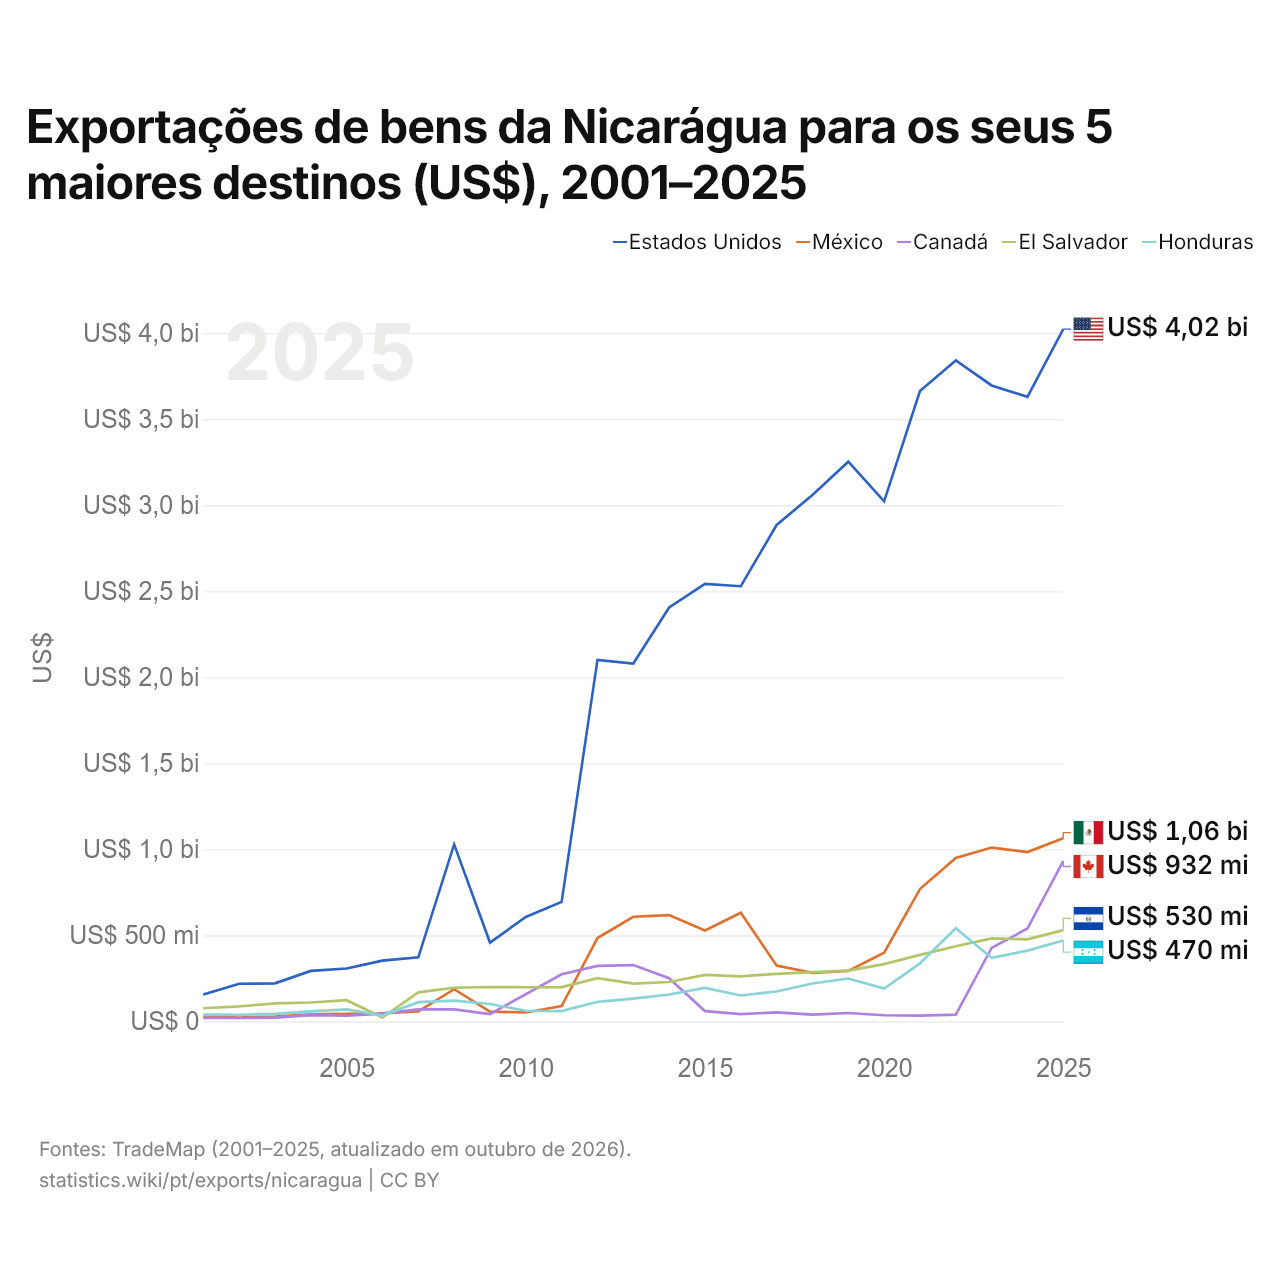
Exportações de bens da Nicarágua para os seus 5 maiores destinos (US$), 2001–2025
| Ano | US$ | ||||
|---|---|---|---|---|---|
| Estados Unidos | México | Canadá | El Salvador | Honduras | |
| 2025 | US$ 4.022.793.000 | US$ 1.063.880.000 | US$ 932.381.000 | US$ 529.880.000 | US$ 470.088.000 |
| 2024 | US$ 3.629.168.000 | US$ 983.425.000 | US$ 539.246.000 | US$ 476.316.000 | US$ 410.908.000 |
| 2023 | US$ 3.695.300.000 | US$ 1.009.725.000 | US$ 426.734.000 | US$ 482.227.000 | US$ 368.448.000 |
| 2022 | US$ 3.841.095.000 | US$ 948.980.000 | US$ 39.046.000 | US$ 436.636.000 | US$ 540.518.000 |
| 2021 | US$ 3.663.099.000 | US$ 768.630.000 | US$ 33.366.000 | US$ 386.385.000 | US$ 336.997.000 |
| 2020 | US$ 3.022.087.000 | US$ 398.606.000 | US$ 35.369.000 | US$ 332.522.000 | US$ 190.101.000 |
| 2019 | US$ 3.252.275.000 | US$ 293.318.000 | US$ 48.617.000 | US$ 294.649.000 | US$ 248.915.000 |
| 2018 | US$ 3.059.214.000 | US$ 282.034.000 | US$ 38.652.000 | US$ 285.608.000 | US$ 220.042.000 |
| 2017 | US$ 2.884.637.000 | US$ 323.754.000 | US$ 51.780.000 | US$ 276.058.000 | US$ 173.613.000 |
| 2016 | US$ 2.528.651.000 | US$ 631.346.000 | US$ 41.605.000 | US$ 261.678.000 | US$ 150.074.000 |
| 2015 | US$ 2.541.637.000 | US$ 528.042.000 | US$ 59.481.000 | US$ 269.606.000 | US$ 194.262.000 |
| 2014 | US$ 2.405.533.000 | US$ 617.446.000 | US$ 250.317.000 | US$ 228.472.000 | US$ 155.940.000 |
| 2013 | US$ 2.079.255.000 | US$ 607.664.000 | US$ 326.974.000 | US$ 218.856.000 | US$ 132.263.000 |
| 2012 | US$ 2.100.452.000 | US$ 484.204.000 | US$ 321.836.000 | US$ 250.806.000 | US$ 113.358.000 |
| 2011 | US$ 694.153.000 | US$ 88.713.000 | US$ 273.363.000 | US$ 198.877.000 | US$ 59.421.000 |
| 2010 | US$ 606.559.000 | US$ 51.586.000 | US$ 157.390.000 | US$ 198.184.000 | US$ 61.683.000 |
| 2009 | US$ 457.595.000 | US$ 56.759.000 | US$ 42.296.000 | US$ 199.353.000 | US$ 100.581.000 |
| 2008 | US$ 1.028.381.000 | US$ 186.638.000 | US$ 69.439.000 | US$ 194.961.000 | US$ 120.368.000 |
| 2007 | US$ 372.105.000 | US$ 57.961.000 | US$ 69.449.000 | US$ 168.329.000 | US$ 111.399.000 |
| 2006 | US$ 353.021.000 | US$ 46.930.000 | US$ 45.173.000 | US$ 22.354.000 | US$ 33.707.000 |
| 2005 | US$ 306.775.000 | US$ 44.085.000 | US$ 32.471.000 | US$ 122.795.000 | US$ 69.738.000 |
| 2004 | US$ 293.167.000 | US$ 40.708.000 | US$ 35.983.000 | US$ 109.586.000 | US$ 58.031.000 |
| 2003 | US$ 220.909.000 | US$ 27.880.000 | US$ 21.349.000 | US$ 104.289.000 | US$ 43.377.000 |
| 2002 | US$ 218.446.000 | US$ 21.351.000 | US$ 19.413.000 | US$ 86.675.000 | US$ 38.428.000 |
| 2001 | US$ 156.127.000 | US$ 27.053.000 | US$ 19.629.000 | US$ 75.852.000 | US$ 38.615.000 |
Em 2025, as exportações de bens foram de US$ 4,02 bilhões para os Estados Unidos, US$ 1,06 bilhão para o México, US$ 932 milhões para o Canadá, US$ 530 milhões para El Salvador e US$ 470 milhões para Honduras. O primeiro lugar dos cinco destinos da Nicarágua ficou com os Estados Unidos em todos os anos desde 2001. A mudança mais recente nessa ordem foi em 2024, quando as exportações da Nicarágua para o Canadá superaram as exportações para El Salvador.
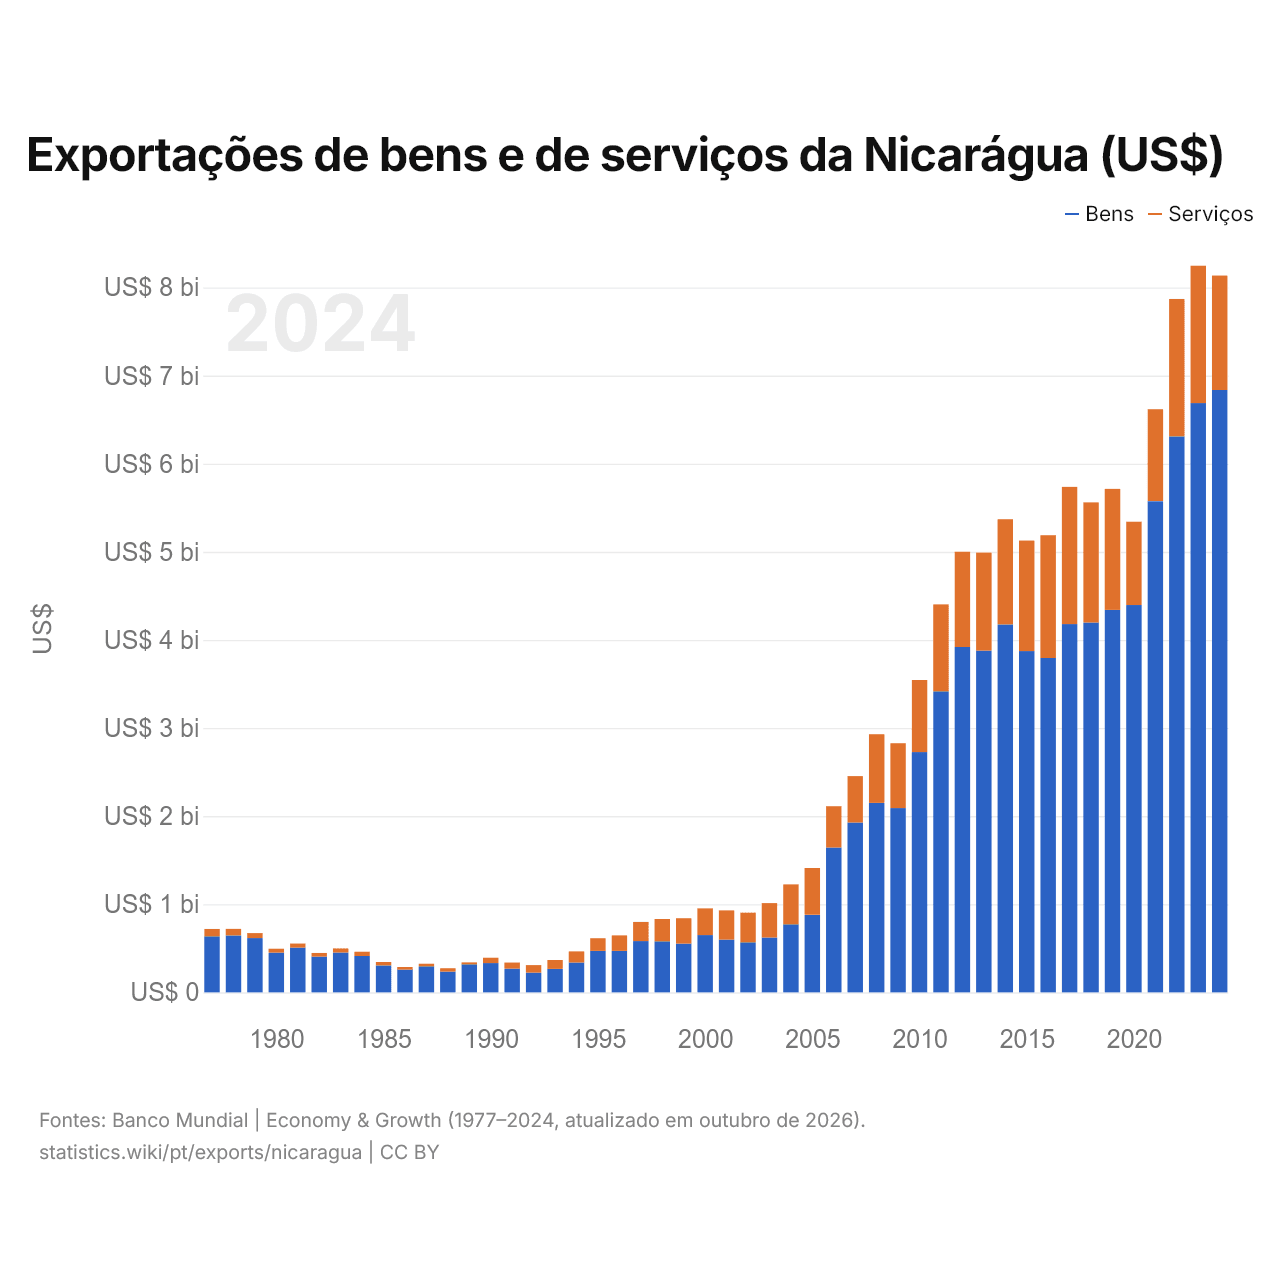
Exportações de bens e de serviços da Nicarágua (US$)
| Ano | US$ | |
|---|---|---|
| Bens | Serviços | |
| 2024 | US$ 6.836.600.000 | US$ 1.298.118.290 |
| 2023 | US$ 6.688.300.000 | US$ 1.559.200.000 |
| 2022 | US$ 6.309.700.000 | US$ 1.559.800.000 |
| 2021 | US$ 5.574.100.000 | US$ 1.043.621.142 |
| 2020 | US$ 4.395.800.000 | US$ 946.300.000 |
| 2019 | US$ 4.341.000.000 | US$ 1.373.100.000 |
| 2018 | US$ 4.197.400.000 | US$ 1.363.600.000 |
| 2017 | US$ 4.179.500.000 | US$ 1.557.600.000 |
| 2016 | US$ 3.794.600.000 | US$ 1.394.100.000 |
| 2015 | US$ 3.873.400.000 | US$ 1.253.400.000 |
| 2014 | US$ 4.175.800.000 | US$ 1.193.900.000 |
| 2013 | US$ 3.879.000.000 | US$ 1.111.900.000 |
| 2012 | US$ 3.919.400.000 | US$ 1.080.400.000 |
| 2011 | US$ 3.416.100.000 | US$ 986.500.000 |
| 2010 | US$ 2.726.100.000 | US$ 818.900.000 |
| 2009 | US$ 2.091.400.000 | US$ 735.700.000 |
| 2008 | US$ 2.151.300.000 | US$ 778.800.000 |
| 2007 | US$ 1.927.200.000 | US$ 526.400.000 |
| 2006 | US$ 1.644.000.000 | US$ 468.700.000 |
| 2005 | US$ 880.430.000 | US$ 530.700.000 |
| 2004 | US$ 772.300.000 | US$ 452.800.000 |
| 2003 | US$ 622.300.000 | US$ 390.400.000 |
| 2002 | US$ 567.400.000 | US$ 337.000.000 |
| 2001 | US$ 599.000.000 | US$ 331.600.000 |
| 2000 | US$ 649.900.000 | US$ 303.700.000 |
| 1999 | US$ 552.300.000 | US$ 288.822.000 |
| 1998 | US$ 579.400.000 | US$ 252.664.000 |
| 1997 | US$ 581.700.000 | US$ 217.434.000 |
| 1996 | US$ 470.900.000 | US$ 174.828.000 |
| 1995 | US$ 469.800.000 | US$ 143.720.506 |
| 1994 | US$ 338.600.000 | US$ 126.092.000 |
| 1993 | US$ 267.000.000 | US$ 100.200.000 |
| 1992 | US$ 223.100.000 | US$ 86.200.000 |
| 1991 | US$ 268.100.000 | US$ 70.200.000 |
| 1990 | US$ 332.400.000 | US$ 59.800.000 |
| 1989 | US$ 318.700.000 | US$ 22.000.000 |
| 1988 | US$ 235.700.000 | US$ 37.400.000 |
| 1987 | US$ 295.100.000 | US$ 29.500.000 |
| 1986 | US$ 257.800.000 | US$ 29.500.000 |
| 1985 | US$ 305.100.000 | US$ 39.300.000 |
| 1984 | US$ 412.400.000 | US$ 48.400.000 |
| 1983 | US$ 451.900.000 | US$ 46.100.000 |
| 1982 | US$ 406.000.000 | US$ 40.800.000 |
| 1981 | US$ 508.200.000 | US$ 45.100.000 |
| 1980 | US$ 450.400.000 | US$ 44.400.000 |
| 1979 | US$ 615.900.000 | US$ 56.300.000 |
| 1978 | US$ 646.000.000 | US$ 74.200.000 |
| 1977 | US$ 636.200.000 | US$ 83.100.000 |
As exportações de bens da Nicarágua são de US$ 6,84 bilhões (2024) e as de serviços, de US$ 1,3 bilhão; os serviços representam 16,0% do total, ante 11,6% em 1977.
A Nicarágua na classificação mundial de exportações, 2025
| Posição | País | Exportações | Participação mundial | |
|---|---|---|---|---|
| 111 |
 Brunei |
US$ 10,8 bi | 0,03% | |
| 112 |
 Maurício |
US$ 10,5 bi | 0,03% | |
| 113 |
 Burkina Faso |
US$ 9,67 bi | 0,03% | |
| 114 |
 Nicarágua |
US$ 9,25 bi | 0,03% | |
| 115 |
 Moçambique |
US$ 9,24 bi | 0,03% | |
| 116 |
 Zâmbia |
US$ 8,85 bi (2024) | 0,03% | |
| 117 |
 Cuba |
US$ 8,77 bi (2020) | 0,04% | vs Cuba |
Exportações de bens e serviços da Nicarágua, % do PIB, 1960–2025
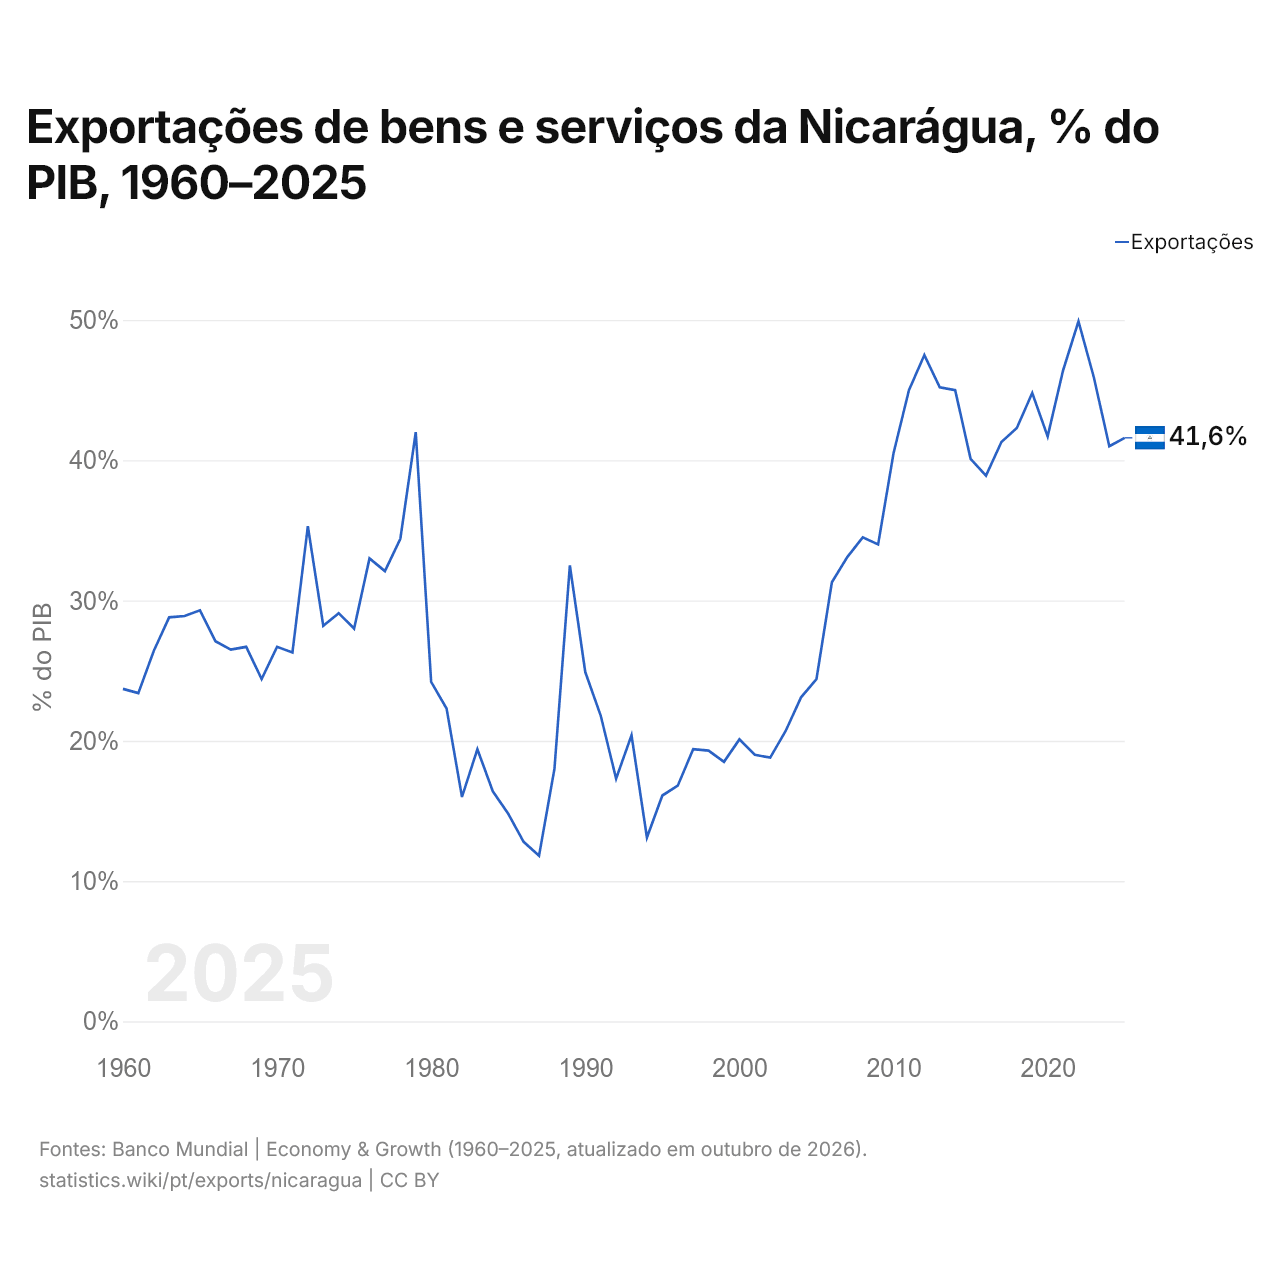
Em 2025, as exportações de bens e serviços da Nicarágua equivaleram a 41,6% do seu PIB, ante 23,7% em 1960. A maior participação foi de 49,9%, em 2022.
Comparar as exportações da Nicarágua com as de outros países
Fontes:
- Banco Mundial | Economy & Growth (1960–2025, atualizado em outubro de 2026)
- TradeMap (2001–2025, atualizado em outubro de 2026)
Creative Commons Atribuição (CC BY): você pode copiar, compartilhar, adaptar e reutilizar este conteúdo, inclusive para fins comerciais, desde que cite o statistics.wiki e indique as alterações que fizer. As fontes listadas acima podem ter suas próprias condições de licença.