
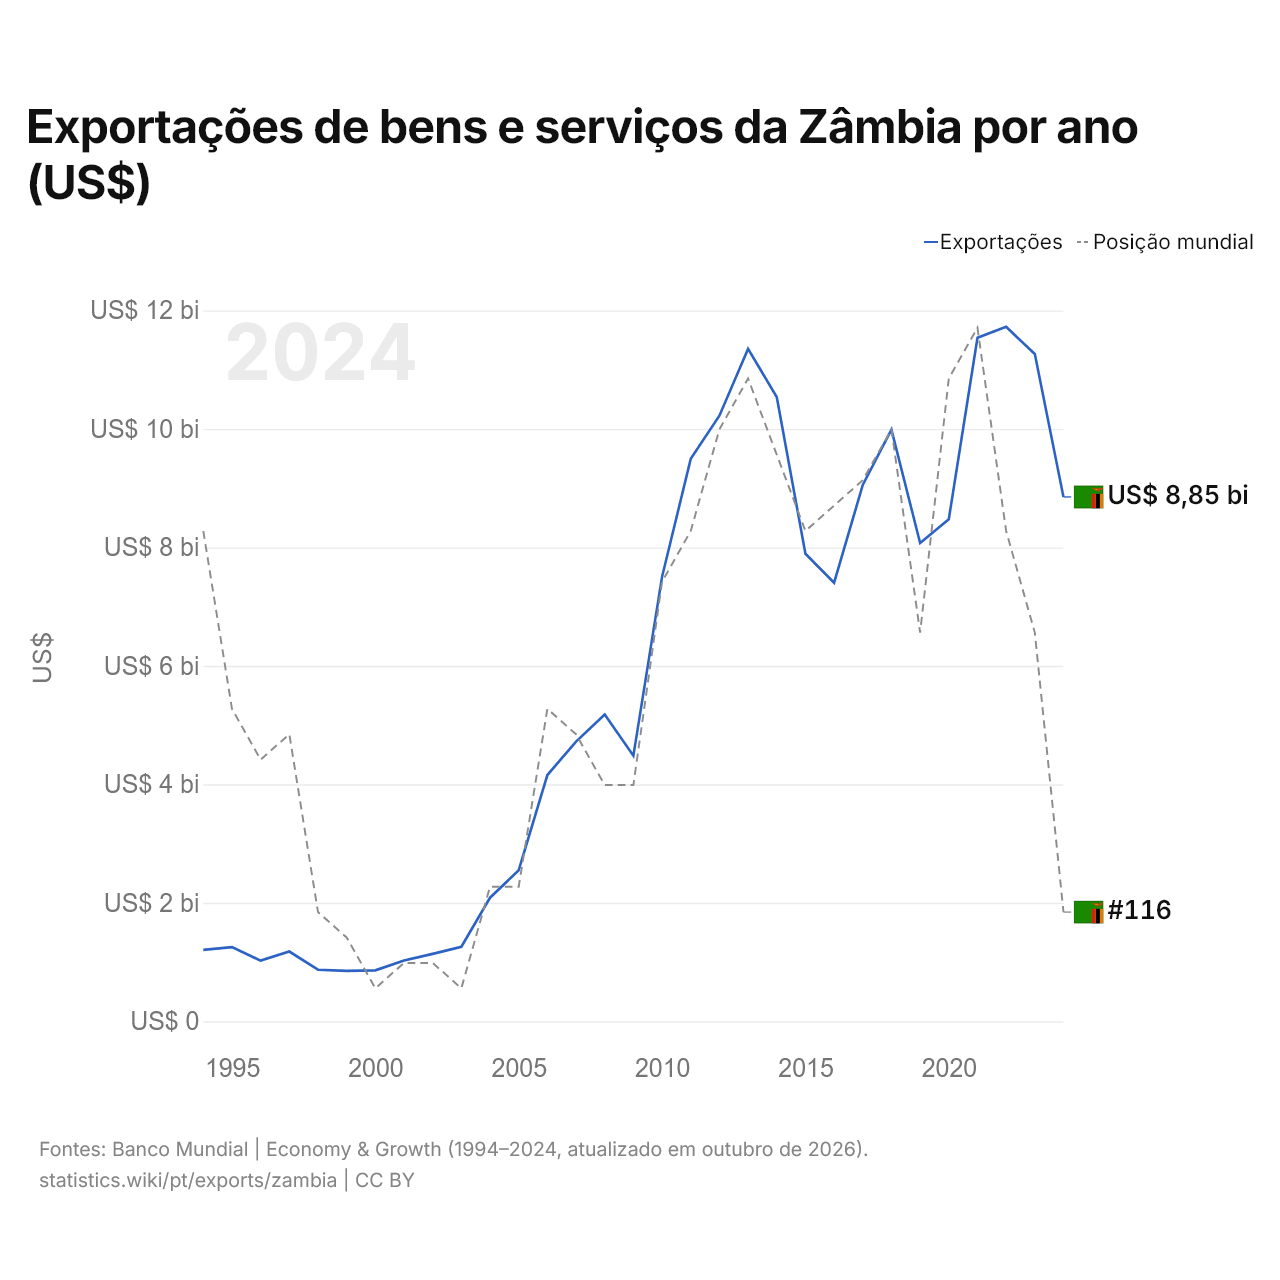
Exportações de bens e serviços da Zâmbia por ano (US$)
| Ano | US$ | Posição mundial |
|---|---|---|
| Exportações | Posição mundial | |
| 2024 | US$ 8.851.528.098 | #116 |
| 2023 | US$ 11.264.526.288 | #105 |
| 2022 | US$ 11.722.089.926 | #101 |
| 2021 | US$ 11.537.884.956 | #93 |
| 2020 | US$ 8.473.997.597 | #95 |
| 2019 | US$ 8.073.235.066 | #105 |
| 2018 | US$ 9.987.165.259 | #97 |
| 2017 | US$ 9.053.912.488 | #99 |
| 2016 | US$ 7.403.491.271 | #100 |
| 2015 | US$ 7.892.388.634 | #101 |
| 2014 | US$ 10.536.766.856 | #98 |
| 2013 | US$ 11.350.236.220 | #95 |
| 2012 | US$ 10.222.369.009 | #97 |
| 2011 | US$ 9.494.352.665 | #101 |
| 2010 | US$ 7.503.512.539 | #103 |
| 2009 | US$ 4.483.693.050 | #111 |
| 2008 | US$ 5.179.705.636 | #111 |
| 2007 | US$ 4.721.899.913 | #109 |
| 2006 | US$ 4.157.837.751 | #108 |
| 2005 | US$ 2.550.444.808 | #115 |
| 2004 | US$ 2.086.559.263 | #115 |
| 2003 | US$ 1.258.994.467 | #119 |
| 2002 | US$ 1.137.945.890 | #118 |
| 2001 | US$ 1.028.101.891 | #118 |
| 2000 | US$ 861.410.215 | #119 |
| 1999 | US$ 852.338.277 | #117 |
| 1998 | US$ 870.912.947 | #116 |
| 1997 | US$ 1.177.864.173 | #109 |
| 1996 | US$ 1.024.449.292 | #110 |
| 1995 | US$ 1.252.536.630 | #108 |
| 1994 | US$ 1.204.932.093 | #101 |
As exportações de bens e serviços da Zâmbia são de US$ 8,85 bilhões (2024), ante US$ 1,2 bilhão em 1994. O máximo foi de US$ 11,7 bilhões, em 2022. São as 116ª maiores do mundo; no ano anterior, eram as 105ª. Sua melhor posição foi o 93º lugar, ocupado pela última vez em 2021.
As exportações de bens e serviços da Zâmbia são as 21ª maiores de 50 países da África. As importações de bens e serviços da Zâmbia são de US$ 6,97 bilhões (2024), as 129ª maiores do mundo. As exportações da Zâmbia superam as importações em US$ 1,88 bilhão, um superávit comercial (2024).
Exportações de bens da Zâmbia por categoria, 2025
Exportações de bens, 2025: US$ 13,3 bi
Em 2025, a maior categoria das exportações de bens da Zâmbia foi metais comuns (ferro, aço, cobre, alumínio), com 67,1%, seguida de petróleo, gás, minérios e outras matérias-primas, com 14,7%.
Destinos das exportações de bens da Zâmbia: os 10 principais, 2025
| Posição | País | Exportações de bens | Participação | |
|---|---|---|---|---|
| 1 |
 Canadá |
US$ 3,44 bi | 25,8% | |
| 2 |
 Suíça |
US$ 2,20 bi | 16,5% | |
| 3 |
 Singapura |
US$ 1,83 bi | 13,7% | |
| 4 |
 RDC |
US$ 1,59 bi | 12% | vs RDC |
| 5 |
 China |
US$ 1,17 bi | 8,8% | |
| 6 |
 EAU |
US$ 735 mi | 5,52% | |
| 7 |
 África do Sul |
US$ 463 mi | 3,48% | |
| 8 |
 Zimbábue |
US$ 354 mi | 2,65% | vs Zimbábue |
| 9 |
 Tanzânia |
US$ 292 mi | 2,19% | vs Tanzânia |
| 10 |
 Namíbia |
US$ 240 mi | 1,8% | vs Namíbia |
| Outros parceiros e não especificados | US$ 1,02 bi | 7,63% |
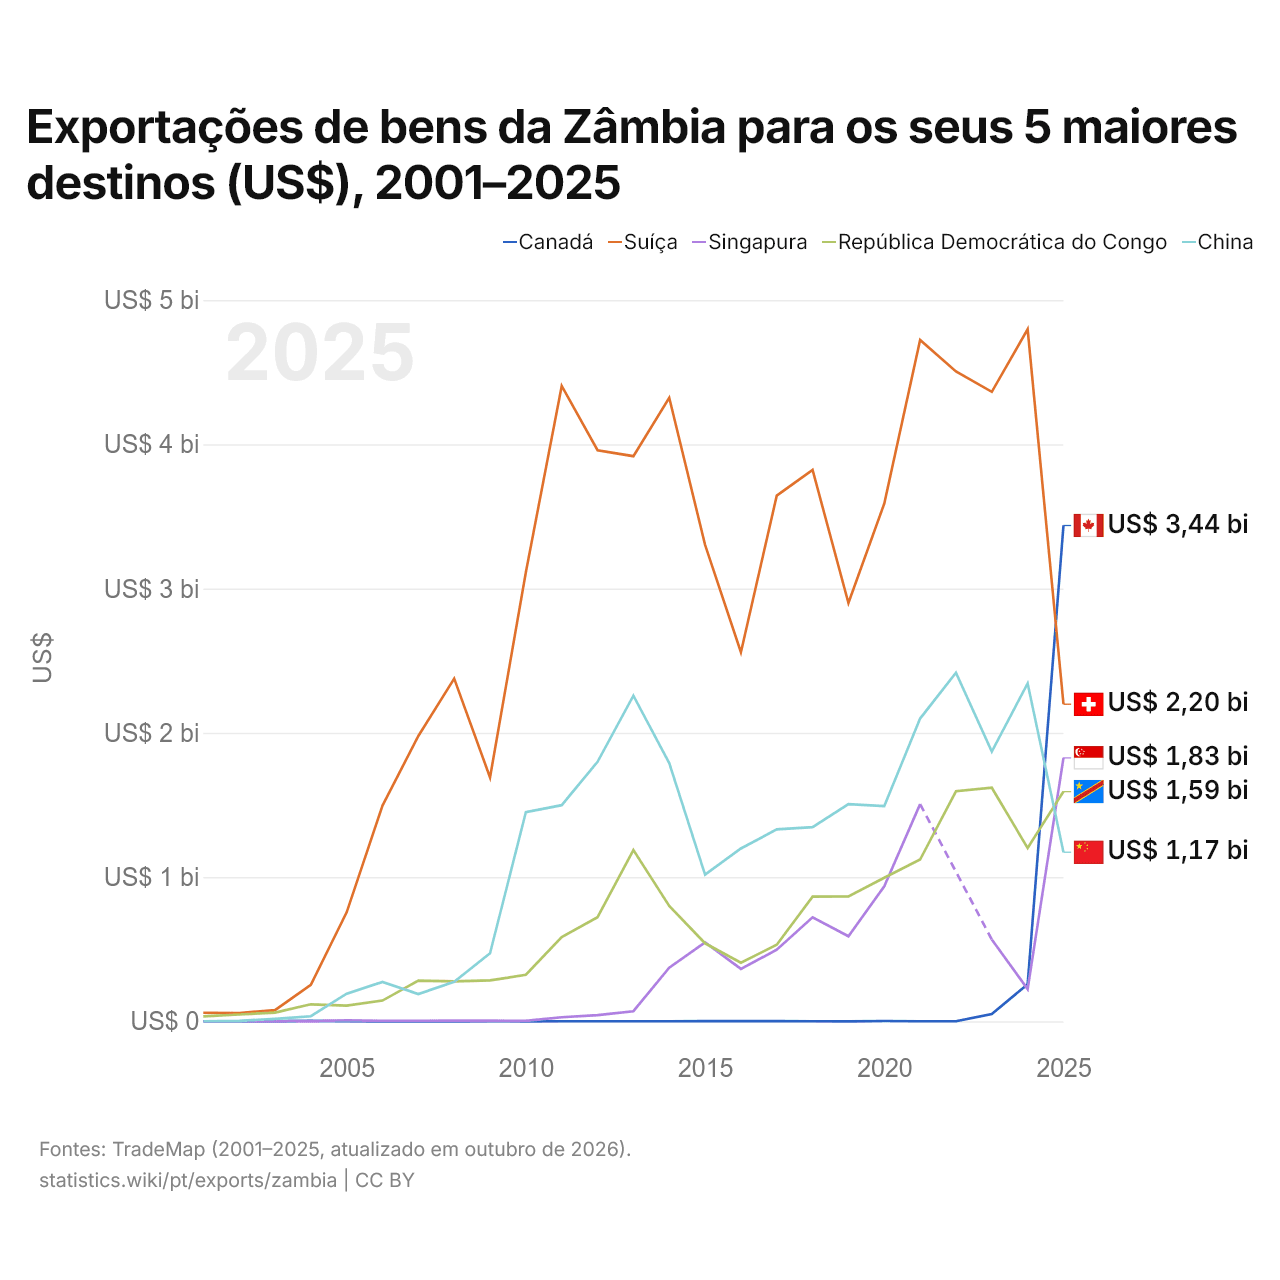
Exportações de bens da Zâmbia para os seus 5 maiores destinos (US$), 2001–2025
| Ano | US$ | ||||
|---|---|---|---|---|---|
| Canadá | Suíça | Singapura | República Democrática do Congo | China | |
| 2025 | US$ 3.437.592.000 | US$ 2.198.326.000 | US$ 1.826.594.000 | US$ 1.593.019.000 | US$ 1.172.479.000 |
| 2024 | US$ 257.428.000 | US$ 4.797.775.000 | US$ 223.271.000 | US$ 1.201.625.000 | US$ 2.342.788.000 |
| 2023 | US$ 50.359.000 | US$ 4.364.103.000 | US$ 567.411.000 | US$ 1.619.352.000 | US$ 1.869.446.000 |
| 2022 | US$ 314.000 | US$ 4.505.556.000 | - | US$ 1.594.892.000 | US$ 2.416.479.000 |
| 2021 | US$ 764.000 | US$ 4.723.507.000 | US$ 1.505.880.000 | US$ 1.121.576.000 | US$ 2.098.993.000 |
| 2020 | US$ 2.035.000 | US$ 3.589.581.000 | US$ 935.537.000 | US$ 995.024.000 | US$ 1.492.493.000 |
| 2019 | US$ 132.000 | US$ 2.899.572.000 | US$ 589.677.000 | US$ 866.133.000 | US$ 1.506.024.000 |
| 2018 | US$ 297.000 | US$ 3.822.432.000 | US$ 721.417.000 | US$ 864.636.000 | US$ 1.346.134.000 |
| 2017 | US$ 1.251.000 | US$ 3.644.395.000 | US$ 496.331.000 | US$ 531.102.000 | US$ 1.331.136.000 |
| 2016 | US$ 1.463.000 | US$ 2.559.060.000 | US$ 363.386.000 | US$ 406.202.000 | US$ 1.198.457.000 |
| 2015 | US$ 1.277.000 | US$ 3.303.296.000 | US$ 547.230.000 | US$ 541.020.000 | US$ 1.017.494.000 |
| 2014 | US$ 458.000 | US$ 4.323.207.000 | US$ 371.816.000 | US$ 800.061.000 | US$ 1.789.814.000 |
| 2013 | US$ 406.000 | US$ 3.917.967.000 | US$ 70.004.000 | US$ 1.187.937.000 | US$ 2.257.462.000 |
| 2012 | US$ 386.000 | US$ 3.959.038.000 | US$ 43.453.000 | US$ 722.318.000 | US$ 1.799.292.000 |
| 2011 | US$ 487.000 | US$ 4.405.329.000 | US$ 28.321.000 | US$ 584.144.000 | US$ 1.498.462.000 |
| 2010 | US$ 158.000 | US$ 3.113.584.000 | US$ 3.346.000 | US$ 322.512.000 | US$ 1.450.412.000 |
| 2009 | US$ 609.000 | US$ 1.690.956.000 | US$ 4.921.000 | US$ 283.820.000 | US$ 472.056.000 |
| 2008 | US$ 224.000 | US$ 2.375.770.000 | US$ 4.824.000 | US$ 276.504.000 | US$ 274.705.000 |
| 2007 | US$ 204.000 | US$ 1.978.186.000 | US$ 3.657.000 | US$ 282.665.000 | US$ 189.362.000 |
| 2006 | US$ 246.000 | US$ 1.496.290.000 | US$ 3.724.000 | US$ 143.955.000 | US$ 273.438.000 |
| 2005 | US$ 303.000 | US$ 755.667.000 | US$ 7.387.000 | US$ 108.668.000 | US$ 192.123.000 |
| 2004 | US$ 2.709.000 | US$ 253.247.000 | US$ 479.000 | US$ 118.066.000 | US$ 35.208.000 |
| 2003 | US$ 2.016.000 | US$ 77.358.000 | US$ 395.000 | US$ 60.628.000 | US$ 16.820.000 |
| 2002 | US$ 730.000 | US$ 57.436.000 | US$ 590.000 | US$ 47.525.000 | US$ 3.717.000 |
| 2001 | US$ 473.000 | US$ 59.696.000 | US$ 342.000 | US$ 33.910.000 | US$ 588.000 |
Em 2025, as exportações de bens foram de US$ 3,44 bilhões para o Canadá, US$ 2,2 bilhões para a Suíça, US$ 1,83 bilhão para Singapura, US$ 1,59 bilhão para a República Democrática do Congo e US$ 1,17 bilhão para a China. A mudança mais recente nessa ordem foi em 2025, quando as exportações da Zâmbia para o Canadá superaram as exportações para a Suíça.
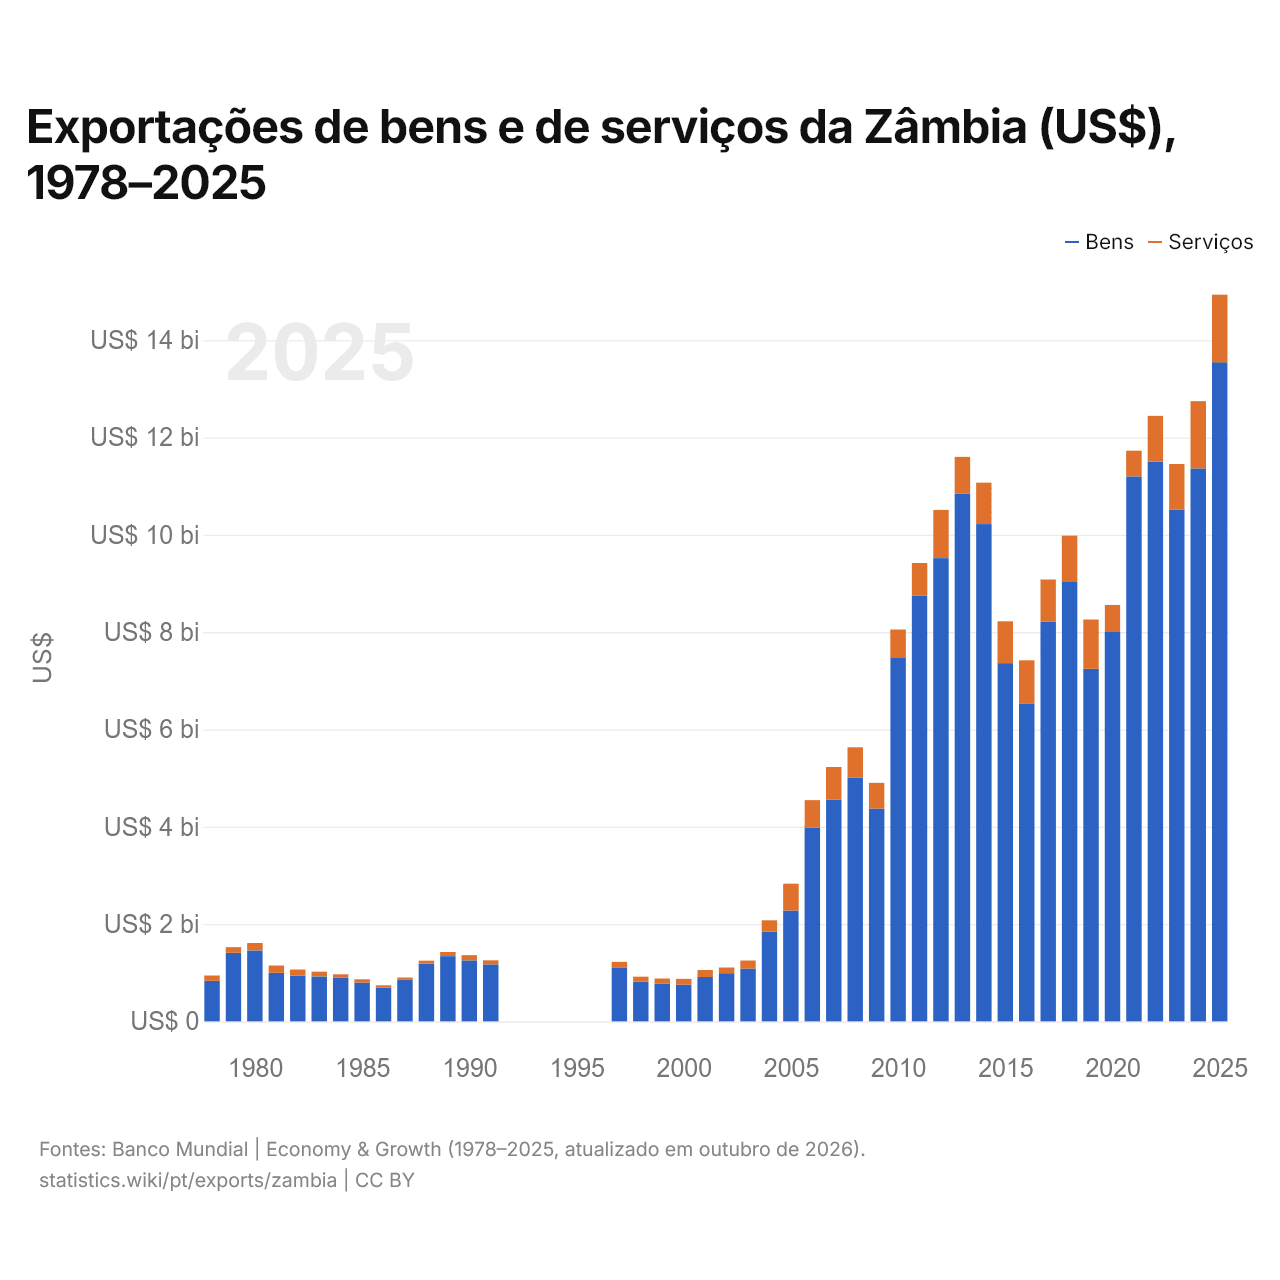
Exportações de bens e de serviços da Zâmbia (US$), 1978–2025
| Ano | US$ | |
|---|---|---|
| Bens | Serviços | |
| 2025 | US$ 13.547.013.332 | US$ 1.388.167.370 |
| 2024 | US$ 11.366.787.901 | US$ 1.379.861.354 |
| 2023 | US$ 10.521.101.209 | US$ 932.798.981 |
| 2022 | US$ 11.504.782.266 | US$ 938.916.418 |
| 2021 | US$ 11.201.979.700 | US$ 525.541.832 |
| 2020 | US$ 8.002.853.405 | US$ 555.624.814 |
| 2019 | US$ 7.246.057.821 | US$ 1.011.822.350 |
| 2018 | US$ 9.029.401.556 | US$ 953.204.795 |
| 2017 | US$ 8.215.549.658 | US$ 864.940.287 |
| 2016 | US$ 6.534.819.286 | US$ 885.102.775 |
| 2015 | US$ 7.361.953.250 | US$ 861.512.074 |
| 2014 | US$ 10.220.151.404 | US$ 850.866.424 |
| 2013 | US$ 10.843.374.324 | US$ 758.019.429 |
| 2012 | US$ 9.520.790.727 | US$ 990.095.738 |
| 2011 | US$ 8.753.615.653 | US$ 665.404.102 |
| 2010 | US$ 7.483.488.751 | US$ 570.852.570 |
| 2009 | US$ 4.371.909.782 | US$ 528.549.368 |
| 2008 | US$ 5.013.122.980 | US$ 618.541.334 |
| 2007 | US$ 4.555.622.325 | US$ 671.525.767 |
| 2006 | US$ 3.984.807.086 | US$ 562.284.084 |
| 2005 | US$ 2.278.227.201 | US$ 549.467.860 |
| 2004 | US$ 1.844.506.000 | US$ 231.800.000 |
| 2003 | US$ 1.086.517.000 | US$ 165.000.000 |
| 2002 | US$ 989.149.000 | US$ 115.320.000 |
| 2001 | US$ 910.785.000 | US$ 144.040.000 |
| 2000 | US$ 756.960.000 | US$ 115.010.000 |
| 1999 | US$ 772.000.000 | US$ 106.600.000 |
| 1998 | US$ 814.400.000 | US$ 102.400.000 |
| 1997 | US$ 1.110.400.000 | US$ 111.900.000 |
| 1996 | - | - |
| 1995 | - | - |
| 1994 | - | - |
| 1993 | - | - |
| 1992 | - | - |
| 1991 | US$ 1.172.200.000 | US$ 82.900.000 |
| 1990 | US$ 1.253.500.000 | US$ 106.800.000 |
| 1989 | US$ 1.340.000.000 | US$ 85.300.000 |
| 1988 | US$ 1.189.500.000 | US$ 58.100.000 |
| 1987 | US$ 852.100.000 | US$ 47.700.000 |
| 1986 | US$ 692.500.000 | US$ 47.000.000 |
| 1985 | US$ 797.000.000 | US$ 68.100.000 |
| 1984 | US$ 892.600.000 | US$ 75.500.000 |
| 1983 | US$ 923.100.000 | US$ 98.600.000 |
| 1982 | US$ 942.000.000 | US$ 121.700.000 |
| 1981 | US$ 996.200.000 | US$ 152.800.000 |
| 1980 | US$ 1.457.300.000 | US$ 151.400.000 |
| 1979 | US$ 1.407.800.000 | US$ 115.500.000 |
| 1978 | US$ 830.700.000 | US$ 112.700.000 |
Em 2025, as exportações de bens da Zâmbia foram de US$ 13,5 bilhões e as de serviços, de US$ 1,39 bilhão; os serviços representaram 9,3% do total, ante 11,9% em 1978.
A Zâmbia na classificação mundial de exportações
| Posição | País | Exportações | Participação mundial | |
|---|---|---|---|---|
| 113 |
 Burkina Faso |
US$ 9,67 bi (2025) | 0,03% | vs Burkina Faso |
| 114 |
 Nicarágua |
US$ 9,25 bi (2025) | 0,03% | |
| 115 |
 Moçambique |
US$ 9,24 bi (2025) | 0,03% | vs Moçambique |
| 116 |
 Zâmbia |
US$ 8,85 bi | 0,03% | |
| 117 |
 Cuba |
US$ 8,77 bi (2020) | 0,04% | |
| 118 |
 República do Congo |
US$ 7,83 bi (2025) | 0,02% | |
| 119 |
 Camarões |
US$ 7,71 bi (2025) | 0,02% |
Exportações de bens e serviços da Zâmbia, % do PIB
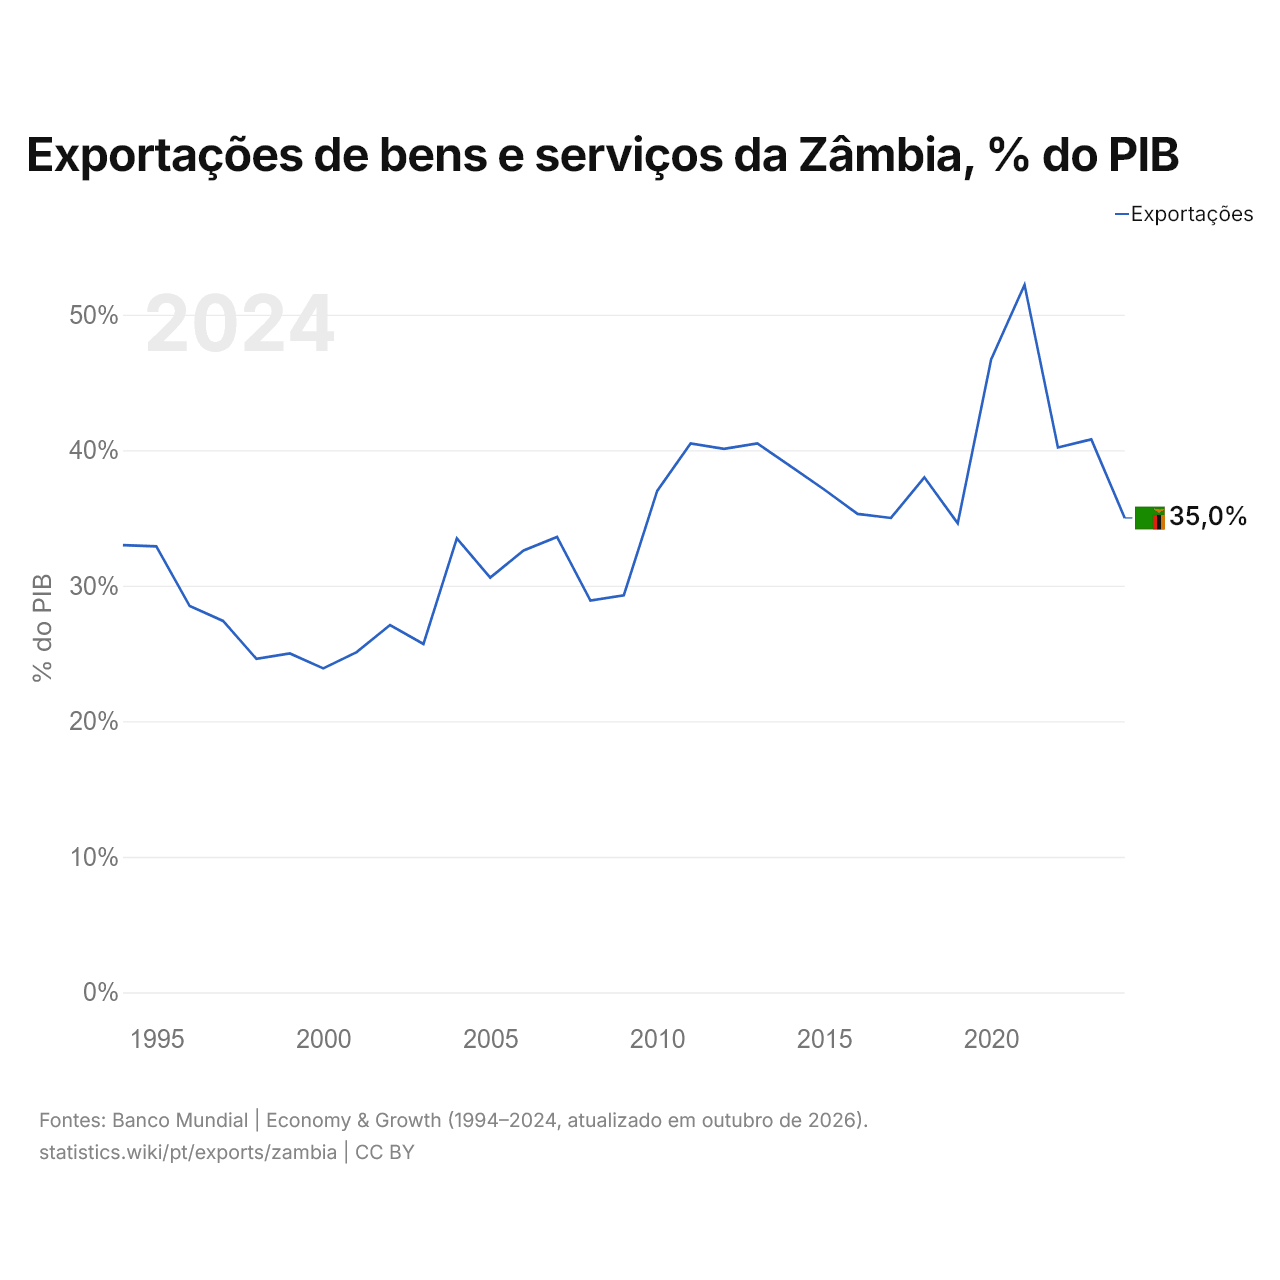
As exportações de bens e serviços da Zâmbia equivalem a 35,0% do seu PIB (2024), ante 33,0% em 1994. A maior participação foi de 52,2%, em 2021.
Comparar as exportações da Zâmbia com as de outros países
Fontes:
- TradeMap (2001–2025, atualizado em outubro de 2026)
- Banco Mundial | Economy & Growth (1978–2025, atualizado em outubro de 2026)
Creative Commons Atribuição (CC BY): você pode copiar, compartilhar, adaptar e reutilizar este conteúdo, inclusive para fins comerciais, desde que cite o statistics.wiki e indique as alterações que fizer. As fontes listadas acima podem ter suas próprias condições de licença.