
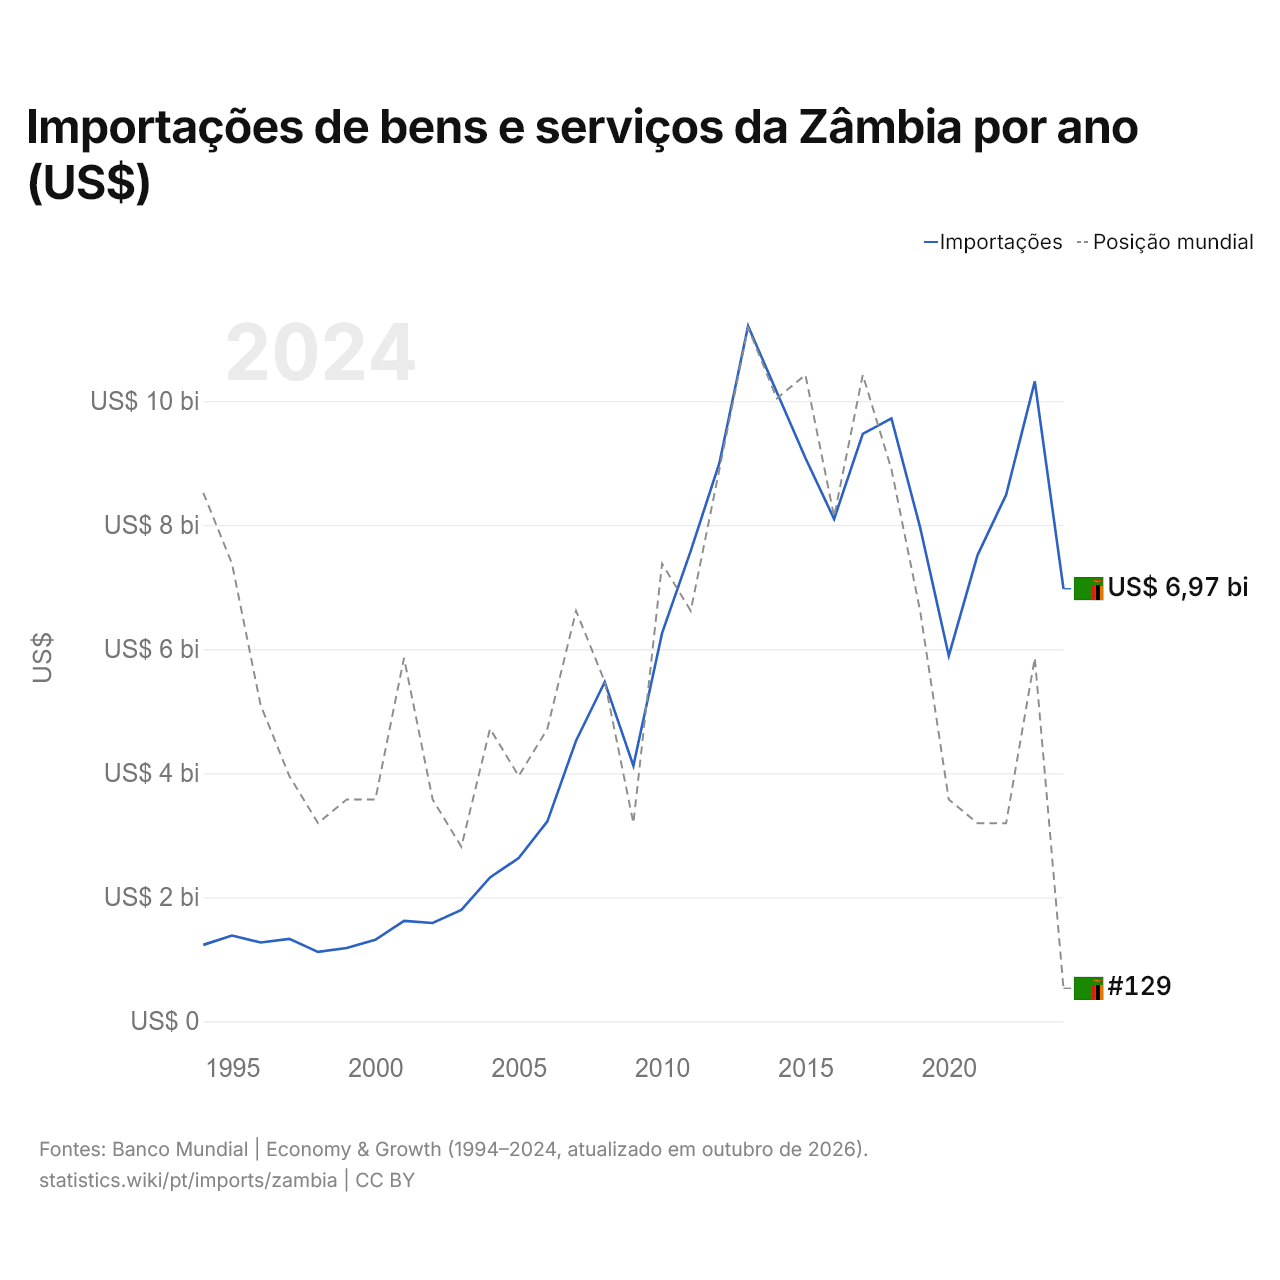
Importações de bens e serviços da Zâmbia por ano (US$)
| Ano | US$ | Posição mundial |
|---|---|---|
| Importações | Posição mundial | |
| 2024 | US$ 6.971.790.366 | #129 |
| 2023 | US$ 10.312.987.263 | #115 |
| 2022 | US$ 8.487.628.172 | #122 |
| 2021 | US$ 7.511.107.108 | #122 |
| 2020 | US$ 5.892.354.558 | #121 |
| 2019 | US$ 7.961.078.355 | #113 |
| 2018 | US$ 9.717.093.537 | #107 |
| 2017 | US$ 9.467.884.707 | #103 |
| 2016 | US$ 8.097.049.104 | #109 |
| 2015 | US$ 9.079.952.777 | #103 |
| 2014 | US$ 10.142.928.855 | #104 |
| 2013 | US$ 11.207.472.737 | #101 |
| 2012 | US$ 8.998.703.573 | #107 |
| 2011 | US$ 7.583.102.928 | #113 |
| 2010 | US$ 6.256.988.597 | #111 |
| 2009 | US$ 4.118.784.328 | #122 |
| 2008 | US$ 5.469.175.508 | #116 |
| 2007 | US$ 4.523.566.396 | #113 |
| 2006 | US$ 3.222.874.997 | #118 |
| 2005 | US$ 2.632.001.949 | #120 |
| 2004 | US$ 2.318.800.178 | #118 |
| 2003 | US$ 1.795.500.025 | #123 |
| 2002 | US$ 1.584.554.909 | #121 |
| 2001 | US$ 1.619.702.986 | #115 |
| 2000 | US$ 1.312.920.384 | #121 |
| 1999 | US$ 1.182.318.859 | #121 |
| 1998 | US$ 1.119.077.757 | #122 |
| 1997 | US$ 1.329.785.211 | #120 |
| 1996 | US$ 1.271.350.443 | #117 |
| 1995 | US$ 1.382.915.200 | #111 |
| 1994 | US$ 1.232.350.968 | #108 |
As importações de bens e serviços da Zâmbia são de US$ 6,97 bilhões (2024), ante US$ 1,23 bilhão em 1994. O máximo foi de US$ 11,2 bilhões, em 2013. São as 129ª maiores do mundo; no ano anterior, eram as 115ª. Sua melhor posição foi o 101º lugar, ocupado pela última vez em 2013.
As importações de bens e serviços da Zâmbia são as 27ª maiores de 50 países da África. As exportações da Zâmbia superam as importações em US$ 1,88 bilhão, um superávit comercial (2024). O comércio da Zâmbia, exportações e importações somadas, equivale a 62,5% do seu PIB (2024), o 113º lugar do mundo.
Importações de bens da Zâmbia por categoria, 2025
Importações de bens, 2025: US$ 13,2 bi
Em 2025, a maior categoria das importações de bens da Zâmbia foi petróleo, gás, minérios e outras matérias-primas, com 34,5%, seguida de máquinas, eletrônicos e veículos, com 32,5%.
Origens das importações de bens da Zâmbia: as 10 principais, 2025
| Posição | País | Importações de bens | Participação | |
|---|---|---|---|---|
| 1 |
 África do Sul |
US$ 3,18 bi | 24,1% | |
| 2 |
 China |
US$ 2,68 bi | 20,3% | |
| 3 |
 EAU |
US$ 1,05 bi | 7,94% | |
| 4 |
 Índia |
US$ 595 mi | 4,51% | |
| 5 |
 Tanzânia |
US$ 527 mi | 3,99% | vs Tanzânia |
| 6 |
 Japão |
US$ 526 mi | 3,98% | |
| 7 |
 RDC |
US$ 418 mi | 3,17% | vs RDC |
| 8 |
 Bahrein |
US$ 335 mi | 2,54% | |
| 9 |
 Singapura |
US$ 291 mi | 2,2% | |
| 10 |
 Estados Unidos |
US$ 290 mi | 2,19% | |
| Outros parceiros e não especificados | US$ 3,31 bi | 25,1% |
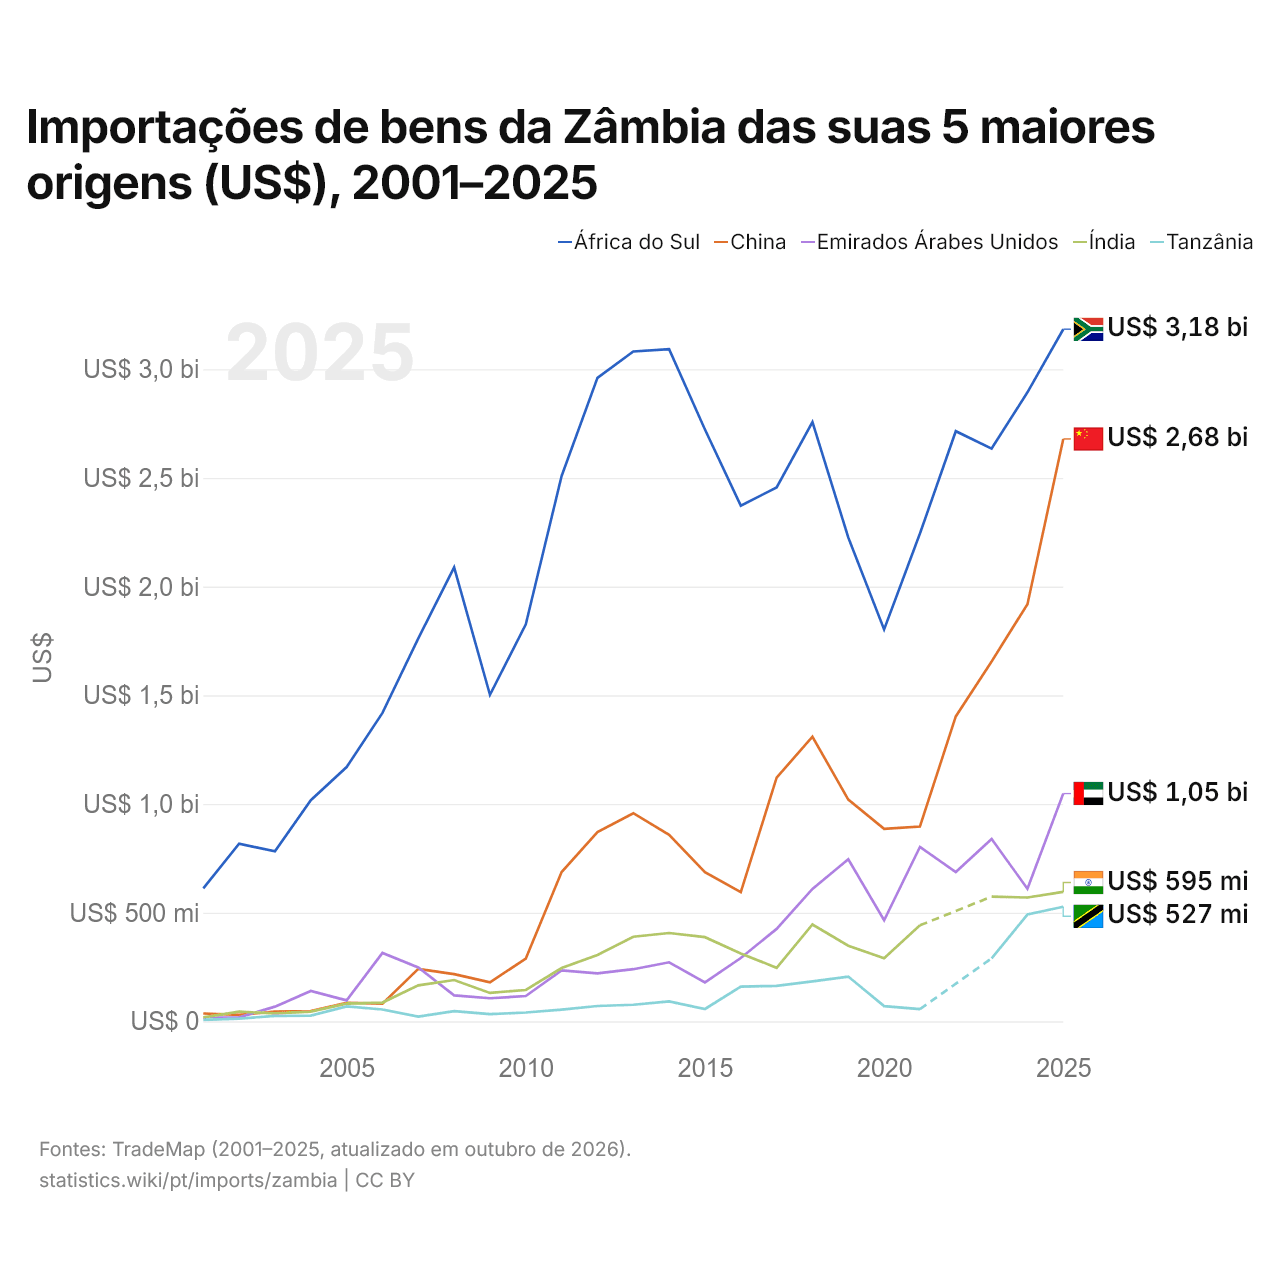
Importações de bens da Zâmbia das suas 5 maiores origens (US$), 2001–2025
| Ano | US$ | ||||
|---|---|---|---|---|---|
| África do Sul | China | Emirados Árabes Unidos | Índia | Tanzânia | |
| 2025 | US$ 3.184.333.000 | US$ 2.679.447.000 | US$ 1.047.989.000 | US$ 595.352.000 | US$ 526.949.000 |
| 2024 | US$ 2.893.740.000 | US$ 1.919.205.000 | US$ 609.933.000 | US$ 569.888.000 | US$ 491.250.000 |
| 2023 | US$ 2.635.062.000 | US$ 1.655.576.000 | US$ 838.665.000 | US$ 573.580.000 | US$ 289.561.000 |
| 2022 | US$ 2.715.109.000 | US$ 1.402.954.000 | US$ 686.973.000 | - | - |
| 2021 | US$ 2.243.949.000 | US$ 896.317.000 | US$ 802.431.000 | US$ 441.743.000 | US$ 56.147.000 |
| 2020 | US$ 1.802.851.000 | US$ 885.892.000 | US$ 464.891.000 | US$ 290.366.000 | US$ 69.889.000 |
| 2019 | US$ 2.226.055.000 | US$ 1.019.957.000 | US$ 745.545.000 | US$ 347.975.000 | US$ 206.000.000 |
| 2018 | US$ 2.757.052.000 | US$ 1.309.533.000 | US$ 609.450.000 | US$ 445.658.000 | US$ 184.106.000 |
| 2017 | US$ 2.456.246.000 | US$ 1.121.110.000 | US$ 425.258.000 | US$ 246.286.000 | US$ 163.450.000 |
| 2016 | US$ 2.372.552.000 | US$ 594.568.000 | US$ 291.240.000 | US$ 312.520.000 | US$ 159.501.000 |
| 2015 | US$ 2.722.613.000 | US$ 686.378.000 | US$ 178.996.000 | US$ 387.205.000 | US$ 56.852.000 |
| 2014 | US$ 3.092.452.000 | US$ 857.662.000 | US$ 271.673.000 | US$ 406.190.000 | US$ 91.698.000 |
| 2013 | US$ 3.081.867.000 | US$ 957.562.000 | US$ 239.861.000 | US$ 389.196.000 | US$ 76.110.000 |
| 2012 | US$ 2.960.630.000 | US$ 870.303.000 | US$ 220.363.000 | US$ 305.221.000 | US$ 70.739.000 |
| 2011 | US$ 2.509.084.000 | US$ 687.165.000 | US$ 234.509.000 | US$ 245.372.000 | US$ 54.116.000 |
| 2010 | US$ 1.826.863.000 | US$ 288.649.000 | US$ 116.271.000 | US$ 144.366.000 | US$ 40.768.000 |
| 2009 | US$ 1.502.221.000 | US$ 179.726.000 | US$ 106.062.000 | US$ 130.603.000 | US$ 32.999.000 |
| 2008 | US$ 2.088.847.000 | US$ 217.004.000 | US$ 119.514.000 | US$ 190.078.000 | US$ 46.730.000 |
| 2007 | US$ 1.761.537.000 | US$ 241.529.000 | US$ 248.114.000 | US$ 165.503.000 | US$ 21.789.000 |
| 2006 | US$ 1.418.829.000 | US$ 81.146.000 | US$ 314.649.000 | US$ 86.322.000 | US$ 54.294.000 |
| 2005 | US$ 1.169.610.000 | US$ 85.393.000 | US$ 96.427.000 | US$ 81.703.000 | US$ 68.477.000 |
| 2004 | US$ 1.017.406.000 | US$ 47.667.000 | US$ 139.667.000 | US$ 44.905.000 | US$ 26.613.000 |
| 2003 | US$ 782.476.000 | US$ 44.771.000 | US$ 67.535.000 | US$ 36.349.000 | US$ 24.904.000 |
| 2002 | US$ 816.943.000 | US$ 29.927.000 | US$ 18.576.000 | US$ 44.295.000 | US$ 12.270.000 |
| 2001 | US$ 612.039.000 | US$ 36.189.000 | US$ 17.579.000 | US$ 18.000.000 | US$ 6.742.000 |
Em 2025, as importações de bens foram de US$ 3,18 bilhões da África do Sul, US$ 2,68 bilhões da China, US$ 1,05 bilhão dos Emirados Árabes Unidos, US$ 595 milhões da Índia e US$ 527 milhões da Tanzânia. O primeiro lugar dos cinco fornecedores da Zâmbia ficou com a África do Sul em todos os anos desde 2001. A mudança mais recente nessa ordem foi em 2017, quando as importações da Zâmbia vindas dos Emirados Árabes Unidos superaram as vindas da Índia.
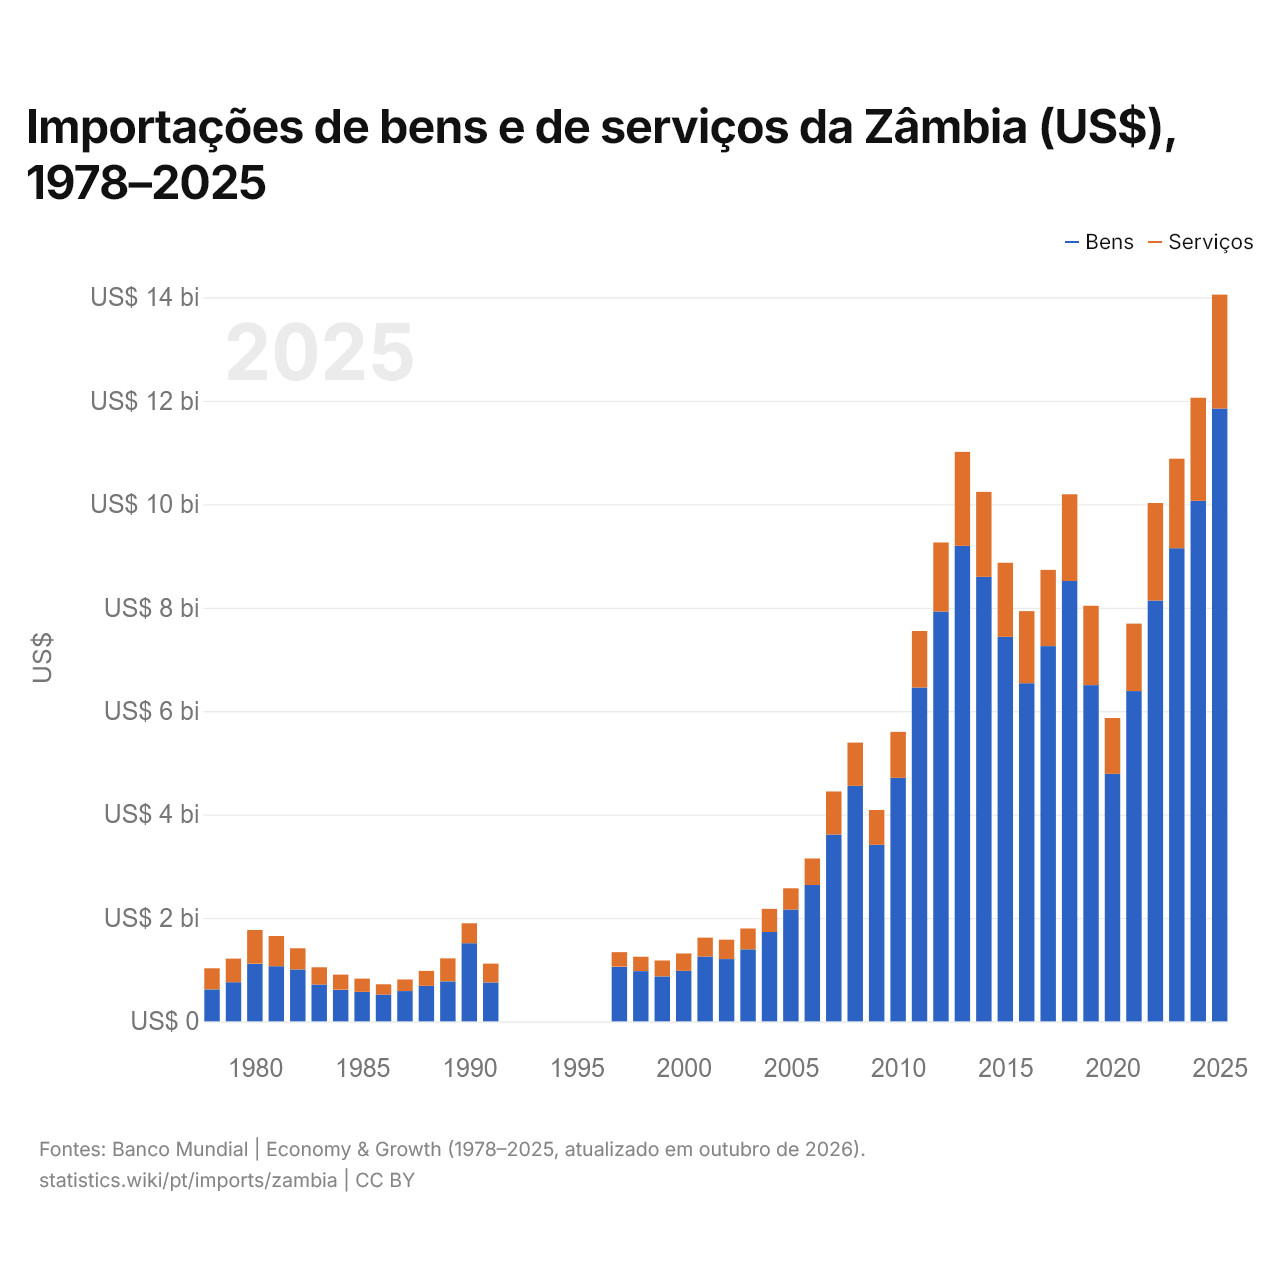
Importações de bens e de serviços da Zâmbia (US$), 1978–2025
| Ano | US$ | |
|---|---|---|
| Bens | Serviços | |
| 2025 | US$ 11.851.032.564 | US$ 2.200.889.833 |
| 2024 | US$ 10.065.613.554 | US$ 1.992.304.746 |
| 2023 | US$ 9.148.247.753 | US$ 1.731.999.218 |
| 2022 | US$ 8.136.943.619 | US$ 1.885.210.021 |
| 2021 | US$ 6.385.838.009 | US$ 1.304.928.009 |
| 2020 | US$ 4.786.845.598 | US$ 1.079.349.933 |
| 2019 | US$ 6.501.712.345 | US$ 1.533.998.038 |
| 2018 | US$ 8.515.497.781 | US$ 1.677.527.474 |
| 2017 | US$ 7.255.368.979 | US$ 1.474.251.547 |
| 2016 | US$ 6.538.529.821 | US$ 1.393.289.892 |
| 2015 | US$ 7.436.213.013 | US$ 1.432.401.478 |
| 2014 | US$ 8.594.794.743 | US$ 1.644.387.981 |
| 2013 | US$ 9.195.362.059 | US$ 1.816.236.562 |
| 2012 | US$ 7.925.533.924 | US$ 1.333.943.758 |
| 2011 | US$ 6.454.224.834 | US$ 1.093.019.088 |
| 2010 | US$ 4.709.901.003 | US$ 888.111.628 |
| 2009 | US$ 3.413.402.100 | US$ 671.765.200 |
| 2008 | US$ 4.554.252.761 | US$ 834.726.858 |
| 2007 | US$ 3.610.543.500 | US$ 834.994.092 |
| 2006 | US$ 2.635.803.000 | US$ 514.040.595 |
| 2005 | US$ 2.160.746.100 | US$ 412.244.225 |
| 2004 | US$ 1.726.940.000 | US$ 447.300.000 |
| 2003 | US$ 1.392.530.000 | US$ 403.400.000 |
| 2002 | US$ 1.203.990.000 | US$ 374.800.000 |
| 2001 | US$ 1.252.930.000 | US$ 366.626.600 |
| 2000 | US$ 977.690.000 | US$ 334.626.600 |
| 1999 | US$ 870.000.000 | US$ 305.800.000 |
| 1998 | US$ 971.000.000 | US$ 278.000.000 |
| 1997 | US$ 1.056.000.000 | US$ 281.700.000 |
| 1996 | - | - |
| 1995 | - | - |
| 1994 | - | - |
| 1993 | - | - |
| 1992 | - | - |
| 1991 | US$ 752.200.000 | US$ 362.800.000 |
| 1990 | US$ 1.511.000.000 | US$ 386.100.000 |
| 1989 | US$ 773.600.000 | US$ 443.900.000 |
| 1988 | US$ 687.200.000 | US$ 289.100.000 |
| 1987 | US$ 585.300.000 | US$ 223.000.000 |
| 1986 | US$ 517.800.000 | US$ 198.800.000 |
| 1985 | US$ 571.400.000 | US$ 254.500.000 |
| 1984 | US$ 612.100.000 | US$ 290.500.000 |
| 1983 | US$ 711.100.000 | US$ 334.000.000 |
| 1982 | US$ 1.003.500.000 | US$ 408.600.000 |
| 1981 | US$ 1.065.300.000 | US$ 584.500.000 |
| 1980 | US$ 1.114.100.000 | US$ 651.100.000 |
| 1979 | US$ 756.000.000 | US$ 456.000.000 |
| 1978 | US$ 618.000.000 | US$ 407.600.000 |
Em 2025, as importações de bens da Zâmbia foram de US$ 11,9 bilhões e as de serviços, de US$ 2,2 bilhões; os serviços representaram 15,7% do total, ante 39,7% em 1978.
A Zâmbia na classificação mundial de importações
| Posição | País | Importações | Participação mundial | |
|---|---|---|---|---|
| 126 |
 Brunei |
US$ 7,82 bi (2025) | 0,02% | |
| 127 |
 Botsuana |
US$ 7,48 bi (2025) | 0,02% | vs Botsuana |
| 128 |
 República do Congo |
US$ 7,12 bi (2025) | 0,02% | |
| 129 |
 Zâmbia |
US$ 6,97 bi | 0,02% | |
| 130 |
 Turcomenistão |
US$ 6,82 bi (2025) | 0,02% | |
| 131 |
 Síria |
US$ 6,80 bi (2022) | 0,02% | |
| 132 |
 Bahamas |
US$ 6,56 bi | 0,02% |
Importações de bens e serviços da Zâmbia, % do PIB
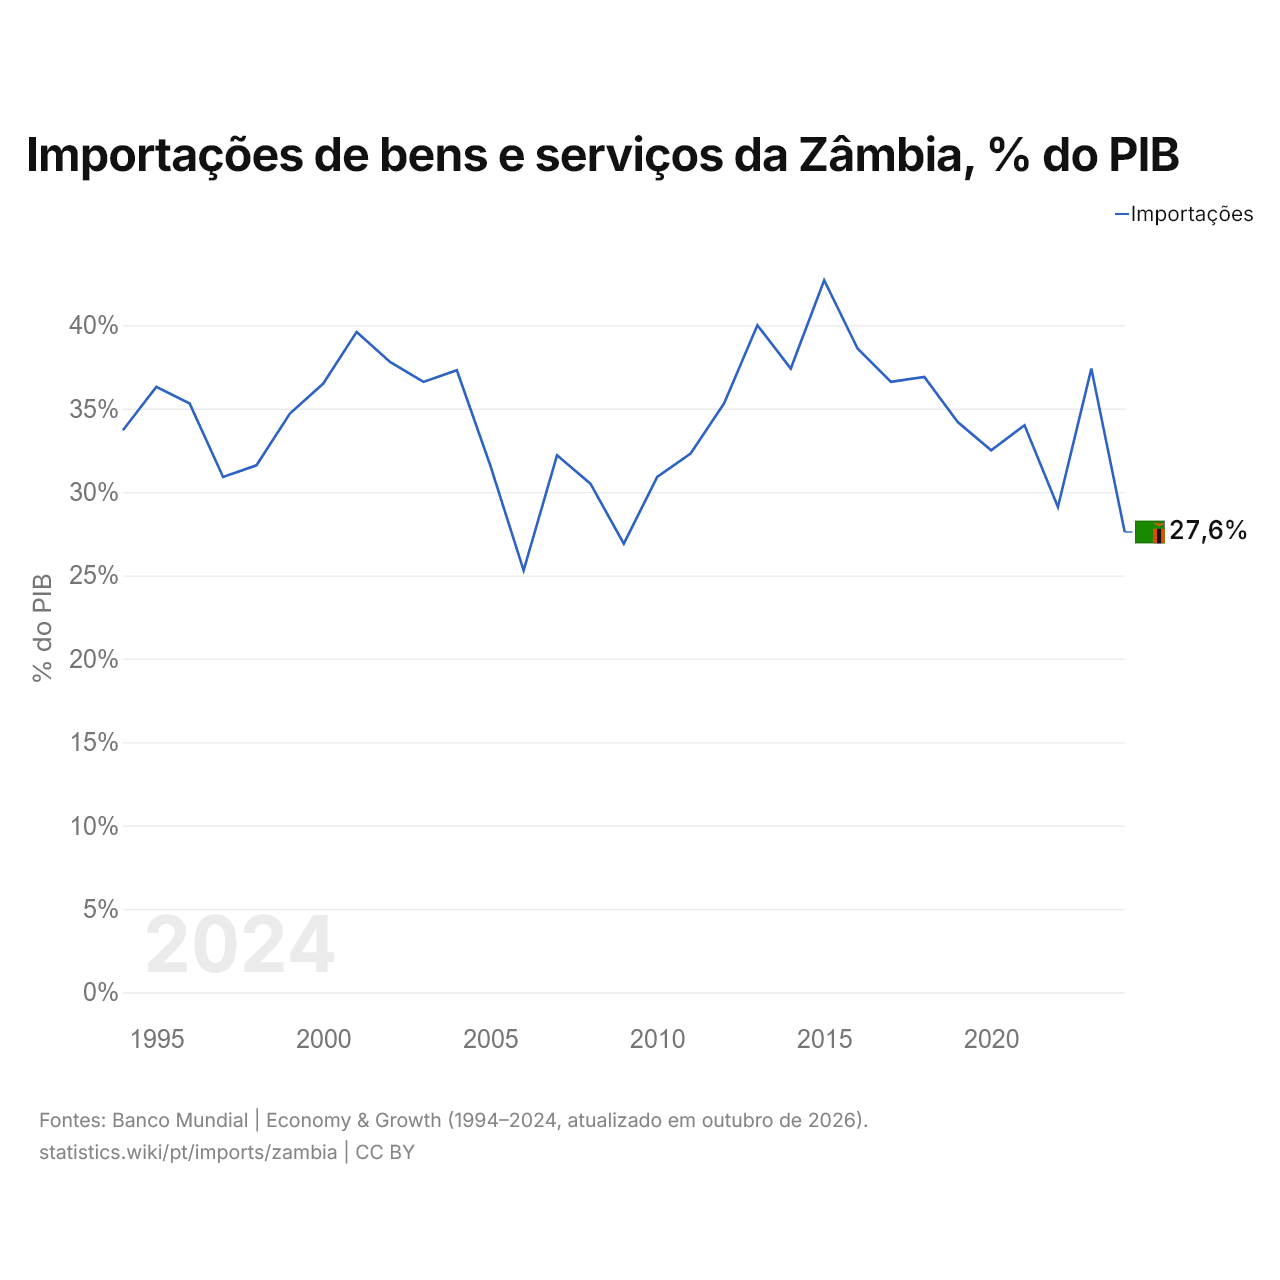
As importações de bens e serviços da Zâmbia equivalem a 27,6% do seu PIB (2024), ante 33,7% em 1994. A maior participação foi de 42,7%, em 2015.
Comparar as importações da Zâmbia com as de outros países
Fontes:
- TradeMap (2001–2025, atualizado em outubro de 2026)
- Banco Mundial | Economy & Growth (1978–2025, atualizado em outubro de 2026)
Creative Commons Atribuição (CC BY): você pode copiar, compartilhar, adaptar e reutilizar este conteúdo, inclusive para fins comerciais, desde que cite o statistics.wiki e indique as alterações que fizer. As fontes listadas acima podem ter suas próprias condições de licença.