
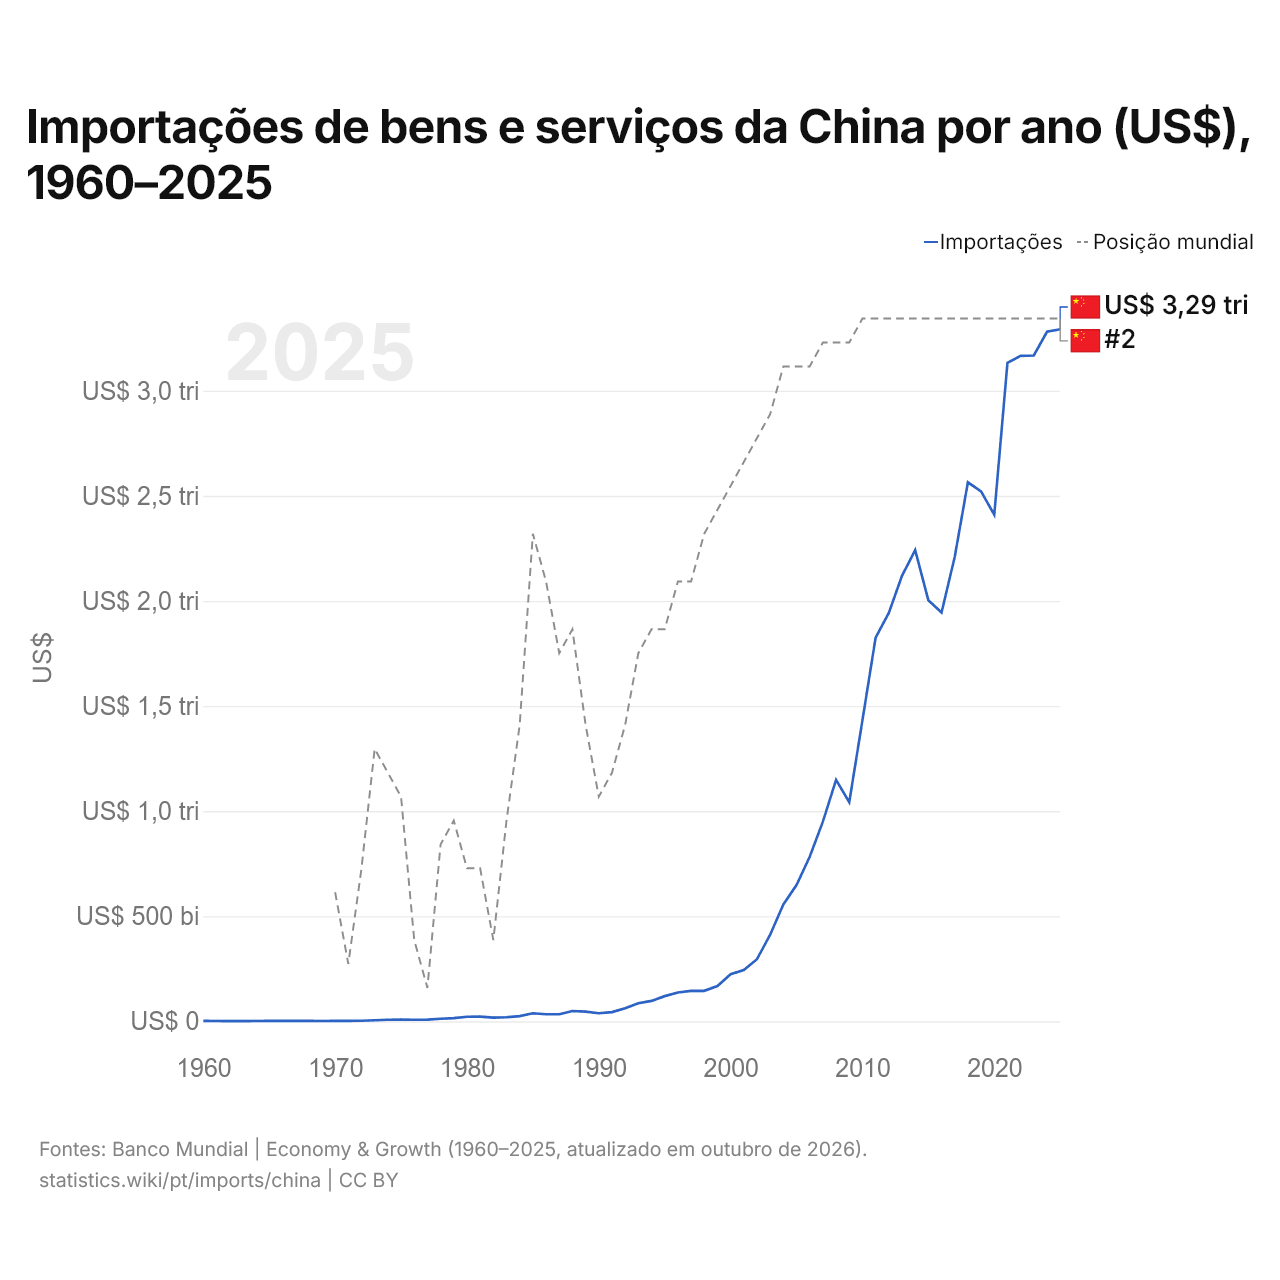
Importações de bens e serviços da China por ano (US$), 1960–2025
| Ano | US$ | Posição mundial |
|---|---|---|
| Importações | Posição mundial | |
| 2025 | US$ 3.292.280.901.123 | #2 |
| 2024 | US$ 3.280.170.243.047 | #2 |
| 2023 | US$ 3.167.502.597.276 | #2 |
| 2022 | US$ 3.166.016.135.468 | #2 |
| 2021 | US$ 3.132.116.155.606 | #2 |
| 2020 | US$ 2.409.650.385.964 | #2 |
| 2019 | US$ 2.521.036.548.137 | #2 |
| 2018 | US$ 2.564.121.910.995 | #2 |
| 2017 | US$ 2.208.518.918.632 | #2 |
| 2016 | US$ 1.944.490.534.275 | #2 |
| 2015 | US$ 2.003.260.696.069 | #2 |
| 2014 | US$ 2.241.276.198.979 | #2 |
| 2013 | US$ 2.119.392.421.428 | #2 |
| 2012 | US$ 1.943.205.232.867 | #2 |
| 2011 | US$ 1.825.413.639.206 | #2 |
| 2010 | US$ 1.432.422.435.977 | #2 |
| 2009 | US$ 1.042.533.759.653 | #3 |
| 2008 | US$ 1.149.036.249.786 | #3 |
| 2007 | US$ 950.020.767.157 | #3 |
| 2006 | US$ 782.812.463.260 | #4 |
| 2005 | US$ 648.712.207.880 | #4 |
| 2004 | US$ 556.182.551.585 | #4 |
| 2003 | US$ 412.137.124.715 | #6 |
| 2002 | US$ 295.619.639.659 | #7 |
| 2001 | US$ 243.973.790.218 | #8 |
| 2000 | US$ 224.306.238.158 | #9 |
| 1999 | US$ 168.058.444.268 | #10 |
| 1998 | US$ 144.913.704.696 | #11 |
| 1997 | US$ 144.623.820.000 | #13 |
| 1996 | US$ 137.261.877.000 | #13 |
| 1995 | US$ 119.900.826.000 | #15 |
| 1994 | US$ 97.250.445.198 | #15 |
| 1993 | US$ 86.072.328.750 | #16 |
| 1992 | US$ 61.849.400.129 | #19 |
| 1991 | US$ 43.941.659.170 | #21 |
| 1990 | US$ 38.461.758.920 | #22 |
| 1989 | US$ 46.118.793.490 | #19 |
| 1988 | US$ 48.984.701.330 | #15 |
| 1987 | US$ 33.781.853.910 | #16 |
| 1986 | US$ 33.592.580.690 | #13 |
| 1985 | US$ 38.302.403.274 | #11 |
| 1984 | US$ 24.710.305.081 | #19 |
| 1983 | US$ 19.385.304.449 | #23 |
| 1982 | US$ 17.788.124.795 | #28 |
| 1981 | US$ 22.219.750.000 | #25 |
| 1980 | US$ 21.842.710.000 | #25 |
| 1979 | US$ 15.535.283.000 | #23 |
| 1978 | US$ 12.261.700.000 | #24 |
| 1977 | US$ 8.060.398.000 | #30 |
| 1976 | US$ 7.349.809.000 | #28 |
| 1975 | US$ 8.355.050.000 | #22 |
| 1974 | US$ 7.716.198.000 | #21 |
| 1973 | US$ 5.257.791.000 | #20 |
| 1972 | US$ 2.916.450.000 | #25 |
| 1971 | US$ 2.233.127.000 | #29 |
| 1970 | US$ 2.201.560.000 | #26 |
| 1969 | US$ 1.731.190.000 | - |
| 1968 | US$ 1.845.220.000 | - |
| 1967 | US$ 1.919.860.000 | - |
| 1966 | US$ 2.185.300.000 | - |
| 1965 | US$ 1.916.420.000 | - |
| 1964 | US$ 1.481.100.000 | - |
| 1963 | US$ 1.210.670.000 | - |
| 1962 | US$ 1.127.720.000 | - |
| 1961 | US$ 1.408.090.000 | - |
| 1960 | US$ 1.890.590.000 | - |
Em 2025, as importações de bens e serviços da China foram de US$ 3,29 trilhões, ante US$ 1,89 bilhão em 1960. O mínimo foi de US$ 1,13 bilhão, em 1962. Foram as 2ª maiores do mundo, posição que mantêm desde 2010.
Em 2025, as importações de bens e serviços da China foram as maiores de 44 países da Ásia. Em 2025, as exportações da China superaram as importações em US$ 816 bilhões, um superávit comercial. O comércio da China, exportações e importações somadas, equivaleu a 38,0% do seu PIB em 2025, o 155º lugar do mundo.
Importações de bens da China por categoria, 2025
Importações de bens, 2025: US$ 2,58 tri
Em 2025, a maior categoria das importações de bens da China foi máquinas, eletrônicos e veículos, com 39,4%, seguida de petróleo, gás, minérios e outras matérias-primas, com 29,8%.
Origens das importações de bens da China: as 10 principais, 2025
| Posição | País | Importações de bens | Participação | |
|---|---|---|---|---|
| 1 |
 Coreia do Sul |
US$ 187 bi | 7,26% | vs Coreia do Sul |
| 2 |
 Japão |
US$ 165 bi | 6,4% | vs Japão |
| 3 |
 Estados Unidos |
US$ 141 bi | 5,48% | vs EUA |
| 4 |
 Austrália |
US$ 128 bi | 4,97% | vs Austrália |
| 5 |
 Rússia |
US$ 124 bi | 4,81% | vs Rússia |
| 6 |
 Brasil |
US$ 116 bi | 4,51% | vs Brasil |
| 7 |
 Vietnã |
US$ 98,0 bi | 3,8% | vs Vietnã |
| 8 |
 Alemanha |
US$ 92,9 bi | 3,6% | vs Alemanha |
| 9 |
 Malásia |
US$ 88,1 bi | 3,42% | vs Malásia |
| 10 |
 Indonésia |
US$ 82,3 bi | 3,19% | vs Indonésia |
| Outros parceiros e não especificados | US$ 1,36 tri | 52,6% |
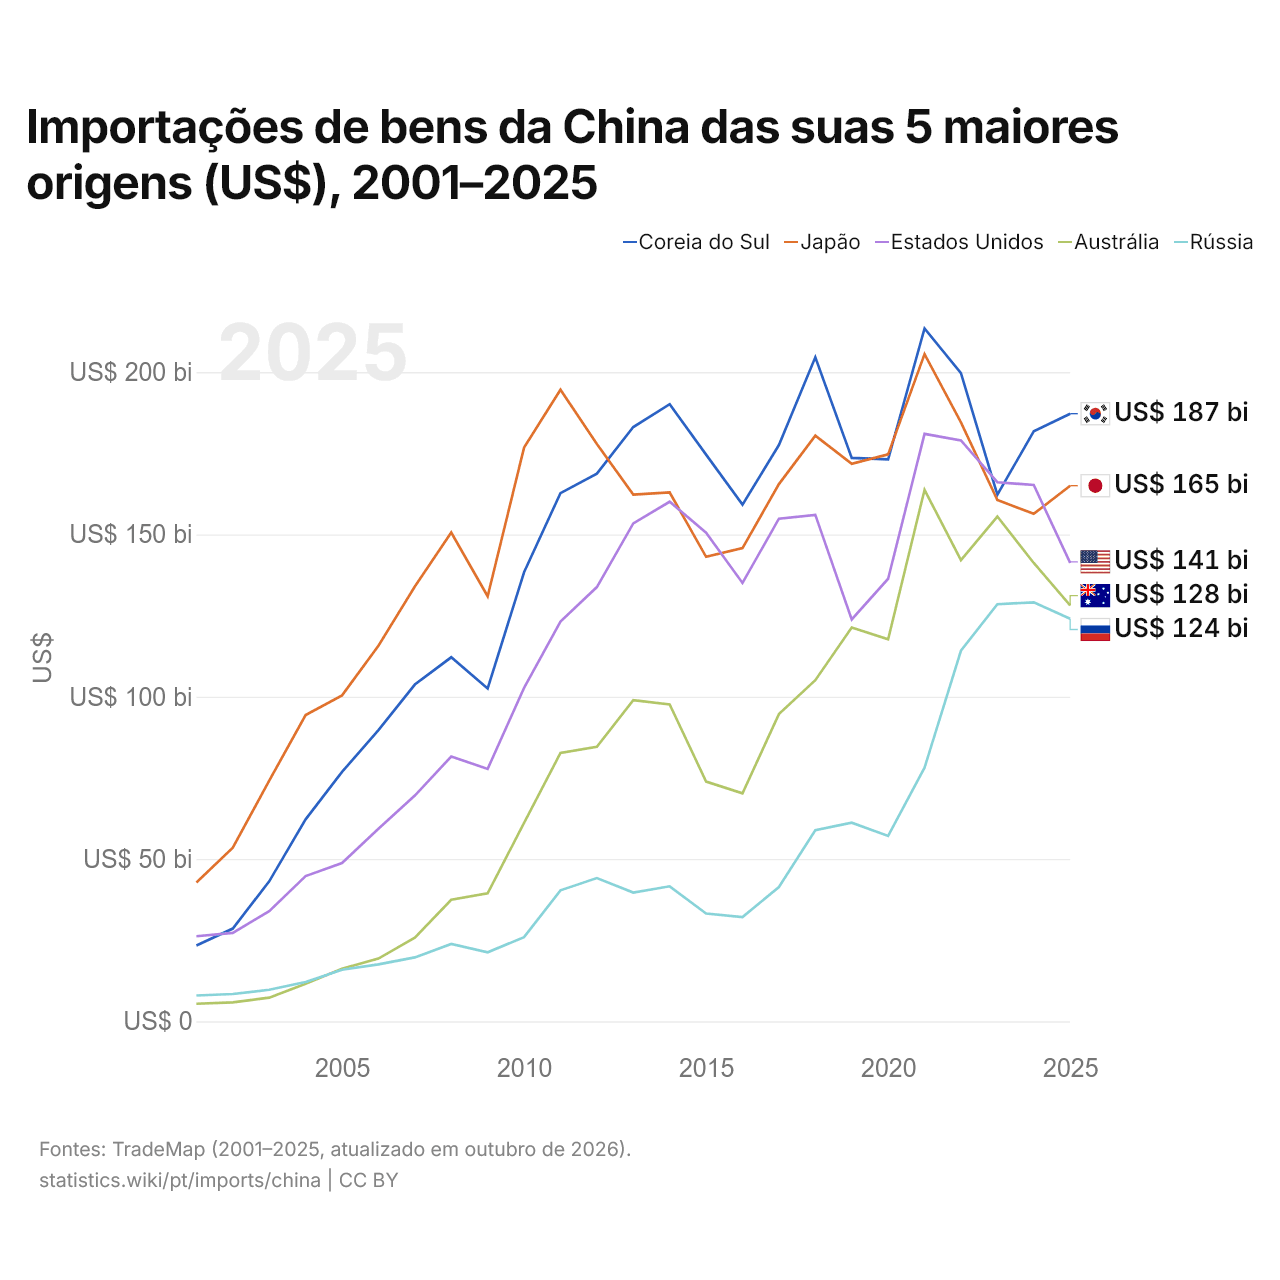
Importações de bens da China das suas 5 maiores origens (US$), 2001–2025
| Ano | US$ | ||||
|---|---|---|---|---|---|
| Coreia do Sul | Japão | Estados Unidos | Austrália | Rússia | |
| 2025 | US$ 187.182.282.000 | US$ 164.992.016.000 | US$ 141.224.094.000 | US$ 128.121.208.000 | US$ 124.005.929.000 |
| 2024 | US$ 181.772.497.000 | US$ 156.332.649.000 | US$ 165.204.208.000 | US$ 141.184.675.000 | US$ 129.070.643.000 |
| 2023 | US$ 162.212.043.000 | US$ 160.577.404.000 | US$ 166.071.580.000 | US$ 155.507.964.000 | US$ 128.484.735.000 |
| 2022 | US$ 199.667.118.000 | US$ 184.496.995.000 | US$ 178.956.846.000 | US$ 142.091.499.000 | US$ 114.148.971.000 |
| 2021 | US$ 213.445.080.000 | US$ 205.523.715.000 | US$ 180.971.848.000 | US$ 163.729.736.000 | US$ 78.142.344.000 |
| 2020 | US$ 173.100.171.000 | US$ 174.655.179.000 | US$ 136.339.521.000 | US$ 117.693.743.000 | US$ 57.114.667.000 |
| 2019 | US$ 173.559.029.000 | US$ 171.768.696.000 | US$ 123.792.117.000 | US$ 121.289.666.000 | US$ 61.190.632.000 |
| 2018 | US$ 204.566.451.000 | US$ 180.401.786.000 | US$ 156.004.357.000 | US$ 105.083.923.000 | US$ 58.887.066.000 |
| 2017 | US$ 177.523.904.000 | US$ 165.494.647.000 | US$ 154.839.684.000 | US$ 94.632.692.000 | US$ 41.351.921.000 |
| 2016 | US$ 159.168.781.000 | US$ 145.771.152.000 | US$ 135.047.253.000 | US$ 70.233.044.000 | US$ 32.131.140.000 |
| 2015 | US$ 174.563.830.000 | US$ 143.092.949.000 | US$ 150.543.984.000 | US$ 73.871.388.000 | US$ 33.216.612.000 |
| 2014 | US$ 190.108.773.000 | US$ 162.920.512.000 | US$ 160.064.514.000 | US$ 97.630.887.000 | US$ 41.593.505.000 |
| 2013 | US$ 183.072.918.000 | US$ 162.245.573.000 | US$ 153.394.862.000 | US$ 98.954.088.000 | US$ 39.667.828.000 |
| 2012 | US$ 168.728.402.000 | US$ 177.832.336.000 | US$ 133.765.823.000 | US$ 84.568.209.000 | US$ 44.138.279.000 |
| 2011 | US$ 162.716.843.000 | US$ 194.567.856.000 | US$ 123.124.010.000 | US$ 82.667.477.000 | US$ 40.362.600.000 |
| 2010 | US$ 138.339.223.000 | US$ 176.736.084.000 | US$ 102.734.185.000 | US$ 61.105.168.000 | US$ 25.913.994.000 |
| 2009 | US$ 102.551.712.000 | US$ 130.937.525.000 | US$ 77.755.101.000 | US$ 39.438.780.000 | US$ 21.282.952.000 |
| 2008 | US$ 112.137.921.000 | US$ 150.600.041.000 | US$ 81.585.556.000 | US$ 37.435.133.000 | US$ 23.832.762.000 |
| 2007 | US$ 103.751.686.000 | US$ 133.950.504.000 | US$ 69.547.964.000 | US$ 25.801.494.000 | US$ 19.688.579.000 |
| 2006 | US$ 89.724.142.000 | US$ 115.672.581.000 | US$ 59.314.270.000 | US$ 19.323.299.000 | US$ 17.554.327.000 |
| 2005 | US$ 76.820.404.000 | US$ 100.407.681.000 | US$ 48.741.359.000 | US$ 16.193.627.000 | US$ 15.889.943.000 |
| 2004 | US$ 62.234.102.000 | US$ 94.326.727.000 | US$ 44.747.869.000 | US$ 11.552.489.000 | US$ 12.127.411.000 |
| 2003 | US$ 43.128.054.000 | US$ 74.148.125.000 | US$ 33.944.166.000 | US$ 7.300.072.000 | US$ 9.728.068.000 |
| 2002 | US$ 28.568.008.000 | US$ 53.465.999.000 | US$ 27.261.097.000 | US$ 5.850.572.000 | US$ 8.406.690.000 |
| 2001 | US$ 23.376.945.000 | US$ 42.787.308.000 | US$ 26.217.375.000 | US$ 5.425.925.000 | US$ 7.958.795.000 |
Em 2025, as importações de bens foram de US$ 187 bilhões da Coreia do Sul, US$ 165 bilhões do Japão, US$ 141 bilhões dos Estados Unidos, US$ 128 bilhões da Austrália e US$ 124 bilhões da Rússia. O primeiro lugar dos cinco fornecedores da China fica com a Coreia do Sul desde 2024. A mudança mais recente nessa ordem foi em 2025, quando as importações da China vindas do Japão superaram as vindas dos Estados Unidos.
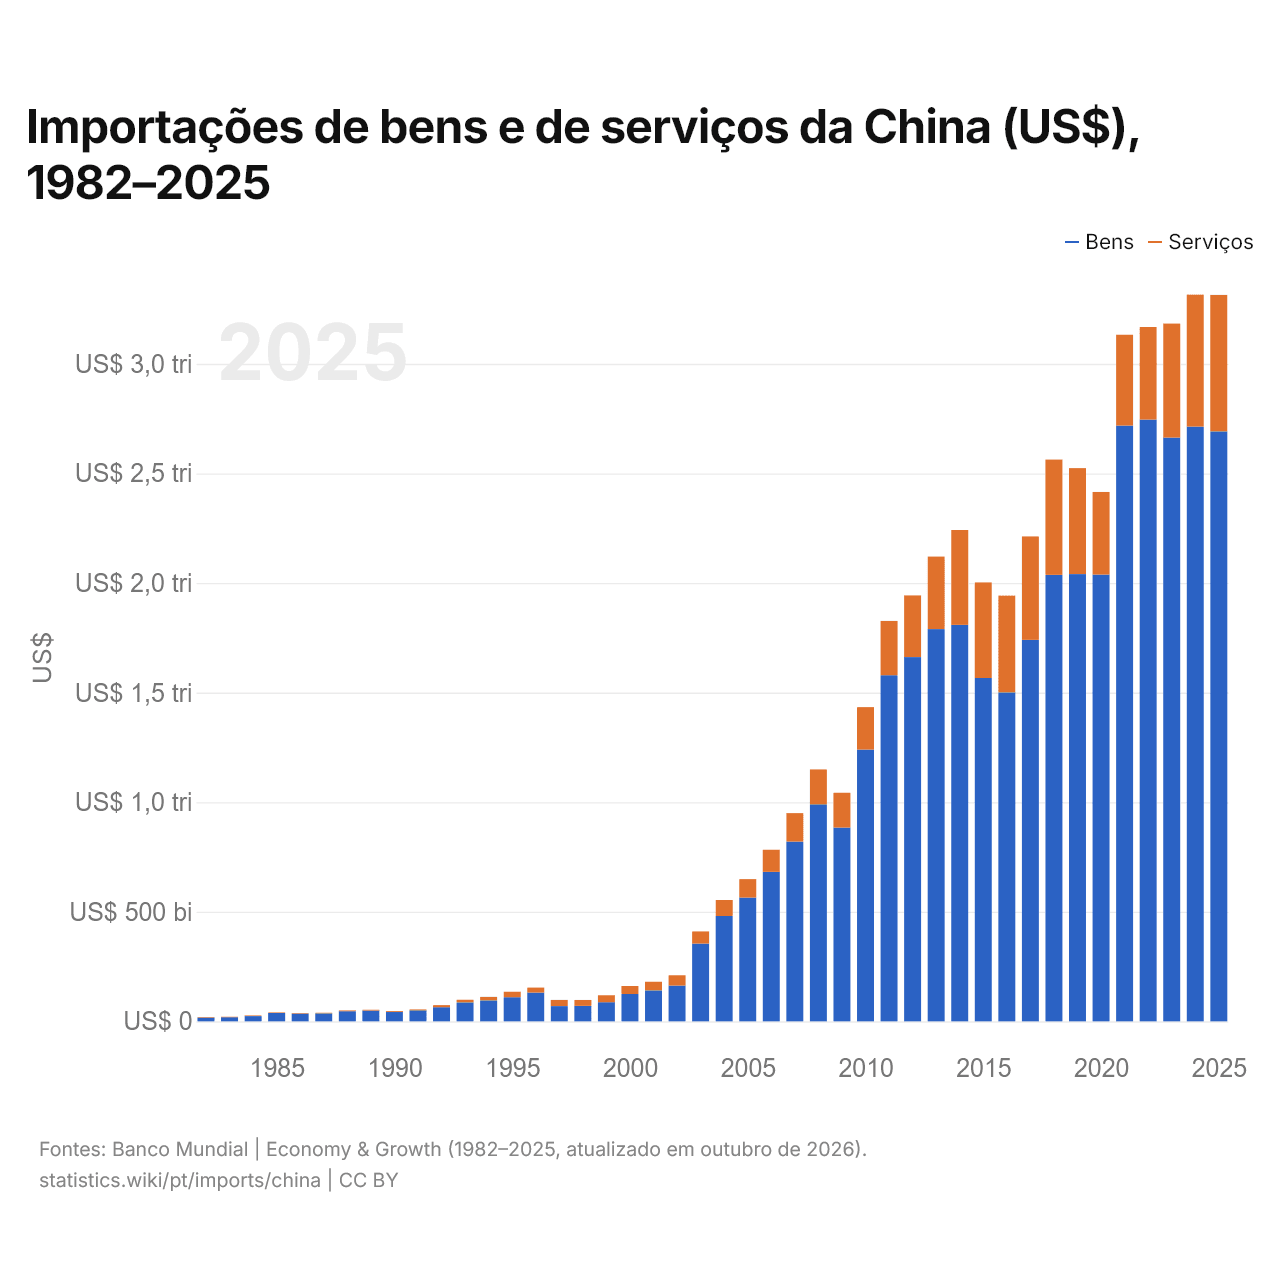
Importações de bens e de serviços da China (US$), 1982–2025
| Ano | US$ | |
|---|---|---|
| Bens | Serviços | |
| 2025 | US$ 2.691.602.720.990 | US$ 622.791.224.625 |
| 2024 | US$ 2.713.541.699.376 | US$ 601.934.439.616 |
| 2023 | US$ 2.662.973.882.422 | US$ 520.683.027.483 |
| 2022 | US$ 2.745.664.159.894 | US$ 422.091.638.071 |
| 2021 | US$ 2.718.067.837.279 | US$ 414.496.341.546 |
| 2020 | US$ 2.038.570.404.224 | US$ 376.709.437.446 |
| 2019 | US$ 2.040.468.115.771 | US$ 483.610.283.331 |
| 2018 | US$ 2.037.369.286.974 | US$ 525.735.166.743 |
| 2017 | US$ 1.740.272.384.901 | US$ 471.995.071.371 |
| 2016 | US$ 1.500.635.639.563 | US$ 441.549.741.325 |
| 2015 | US$ 1.566.562.344.087 | US$ 435.719.343.941 |
| 2014 | US$ 1.808.719.657.195 | US$ 432.883.126.519 |
| 2013 | US$ 1.789.607.637.370 | US$ 330.607.538.824 |
| 2012 | US$ 1.661.946.659.669 | US$ 281.300.475.959 |
| 2011 | US$ 1.579.104.690.855 | US$ 247.844.018.720 |
| 2010 | US$ 1.239.986.291.933 | US$ 193.401.495.136 |
| 2009 | US$ 883.613.955.794 | US$ 158.919.803.859 |
| 2008 | US$ 990.087.588.240 | US$ 158.948.661.546 |
| 2007 | US$ 819.890.833.109 | US$ 130.129.934.048 |
| 2006 | US$ 681.974.284.757 | US$ 100.838.178.503 |
| 2005 | US$ 564.741.526.454 | US$ 83.970.681.426 |
| 2004 | US$ 480.719.715.648 | US$ 72.880.614.892 |
| 2003 | US$ 354.608.469.127 | US$ 55.546.608.068 |
| 2002 | US$ 163.480.624.560 | US$ 46.762.744.321 |
| 2001 | US$ 141.031.000.000 | US$ 39.457.000.000 |
| 2000 | US$ 124.897.211.000 | US$ 36.268.639.000 |
| 1999 | US$ 87.136.000.000 | US$ 32.107.000.000 |
| 1998 | US$ 70.323.000.000 | US$ 27.204.000.000 |
| 1997 | US$ 69.431.000.000 | US$ 28.278.000.000 |
| 1996 | US$ 131.542.000.000 | US$ 22.585.000.000 |
| 1995 | US$ 110.059.580.000 | US$ 25.222.820.000 |
| 1994 | US$ 95.271.000.000 | US$ 16.299.000.000 |
| 1993 | US$ 86.313.000.000 | US$ 12.036.000.000 |
| 1992 | US$ 64.385.000.000 | US$ 9.434.000.000 |
| 1991 | US$ 50.176.000.000 | US$ 4.121.000.000 |
| 1990 | US$ 42.354.000.000 | US$ 4.352.000.000 |
| 1989 | US$ 48.840.000.000 | US$ 3.910.000.000 |
| 1988 | US$ 46.369.000.000 | US$ 3.603.000.000 |
| 1987 | US$ 36.395.000.000 | US$ 2.485.000.000 |
| 1986 | US$ 34.896.000.000 | US$ 2.276.000.000 |
| 1985 | US$ 38.231.000.000 | US$ 2.524.000.000 |
| 1984 | US$ 23.891.000.000 | US$ 2.857.000.000 |
| 1983 | US$ 18.717.000.000 | US$ 1.994.000.000 |
| 1982 | US$ 16.876.000.000 | US$ 2.024.000.000 |
Em 2025, as importações de bens da China foram de US$ 2,69 trilhões e as de serviços, de US$ 623 bilhões; os serviços representaram 18,8% do total, ante 10,7% em 1982.
A China na classificação mundial de importações, 2025
| Posição | País | Importações | Participação mundial | |
|---|---|---|---|---|
| 1 |
Estados Unidos
|
US$ 4,36 tri | 12,9% | vs EUA |
| 2 |
 China |
US$ 3,29 tri | 9,76% | |
| 3 |
Alemanha
|
US$ 1,92 tri | 5,7% | vs Alemanha |
| 4 |
 Reino Unido |
US$ 1,28 tri | 3,78% | vs RU |
| 5 |
 França |
US$ 1,14 tri | 3,37% | vs França |
| 6 |
Japão
|
US$ 998 bi | 2,96% | vs Japão |
| 7 |
 Índia |
US$ 950 bi | 2,82% | vs Índia |
Importações de bens e serviços da China, % do PIB, 1960–2025
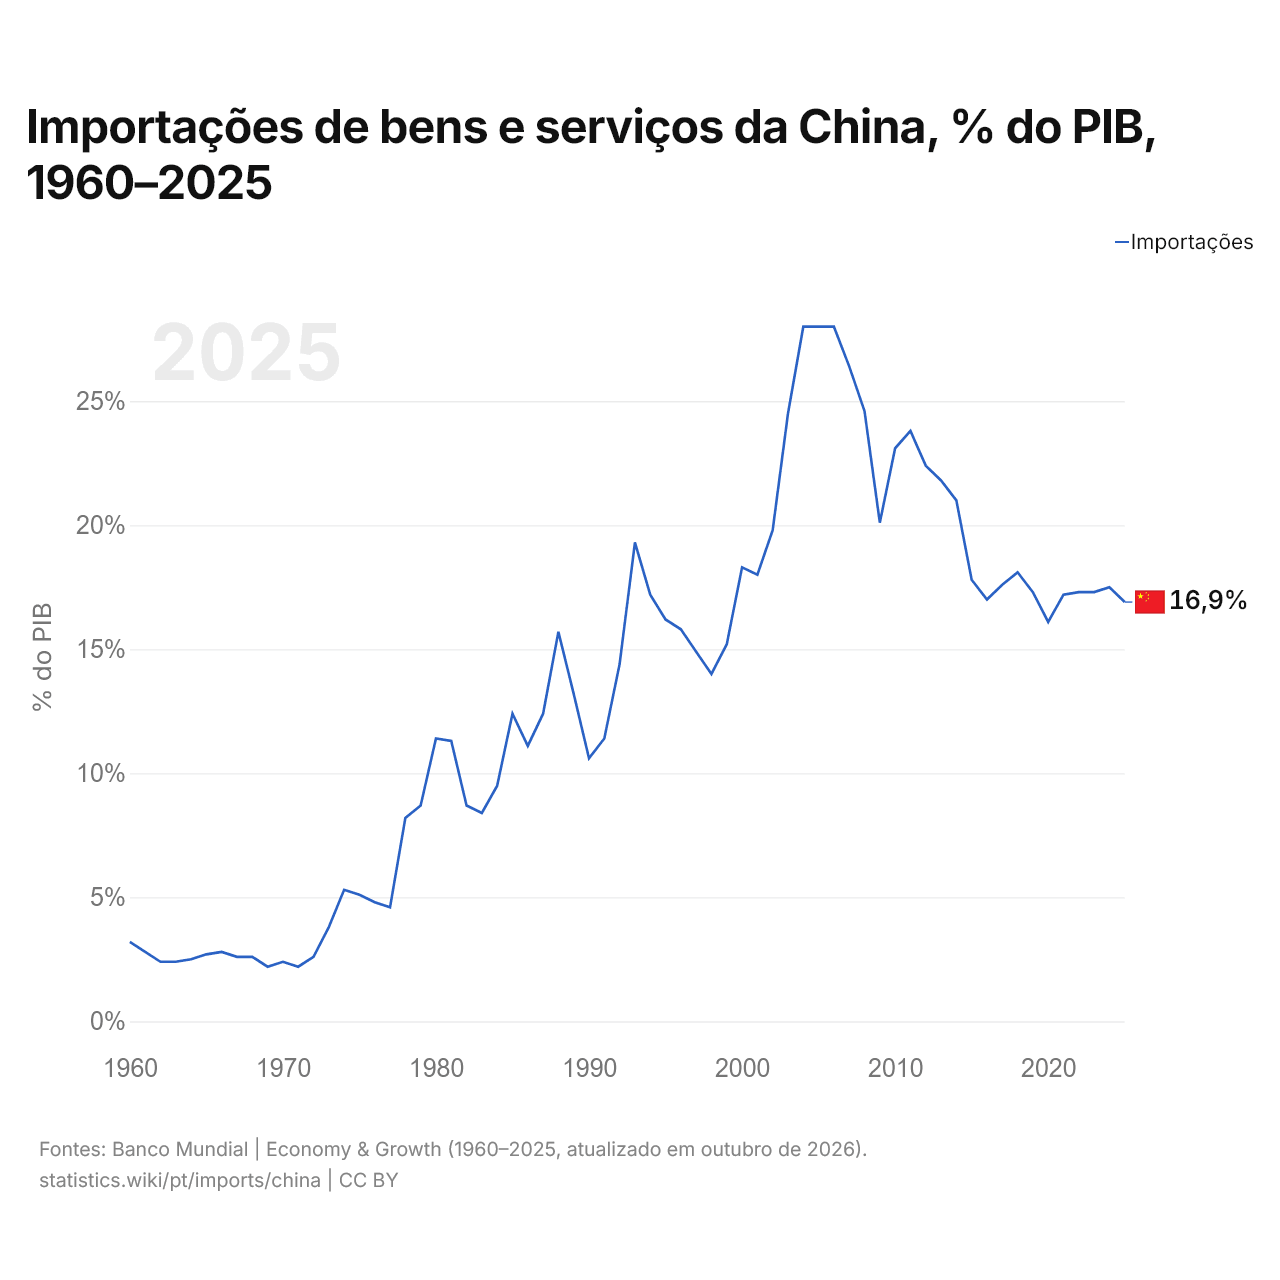
Em 2025, as importações de bens e serviços da China equivaleram a 16,9% do seu PIB, ante 3,2% em 1960. A maior participação foi de 28,0%, em 2006.
Comparar as importações da China com as de outros países
Fontes:
- TradeMap (2001–2025, atualizado em outubro de 2026)
- Banco Mundial | Economy & Growth (1960–2025, atualizado em outubro de 2026)
Creative Commons Atribuição (CC BY): você pode copiar, compartilhar, adaptar e reutilizar este conteúdo, inclusive para fins comerciais, desde que cite o statistics.wiki e indique as alterações que fizer. As fontes listadas acima podem ter suas próprias condições de licença.