
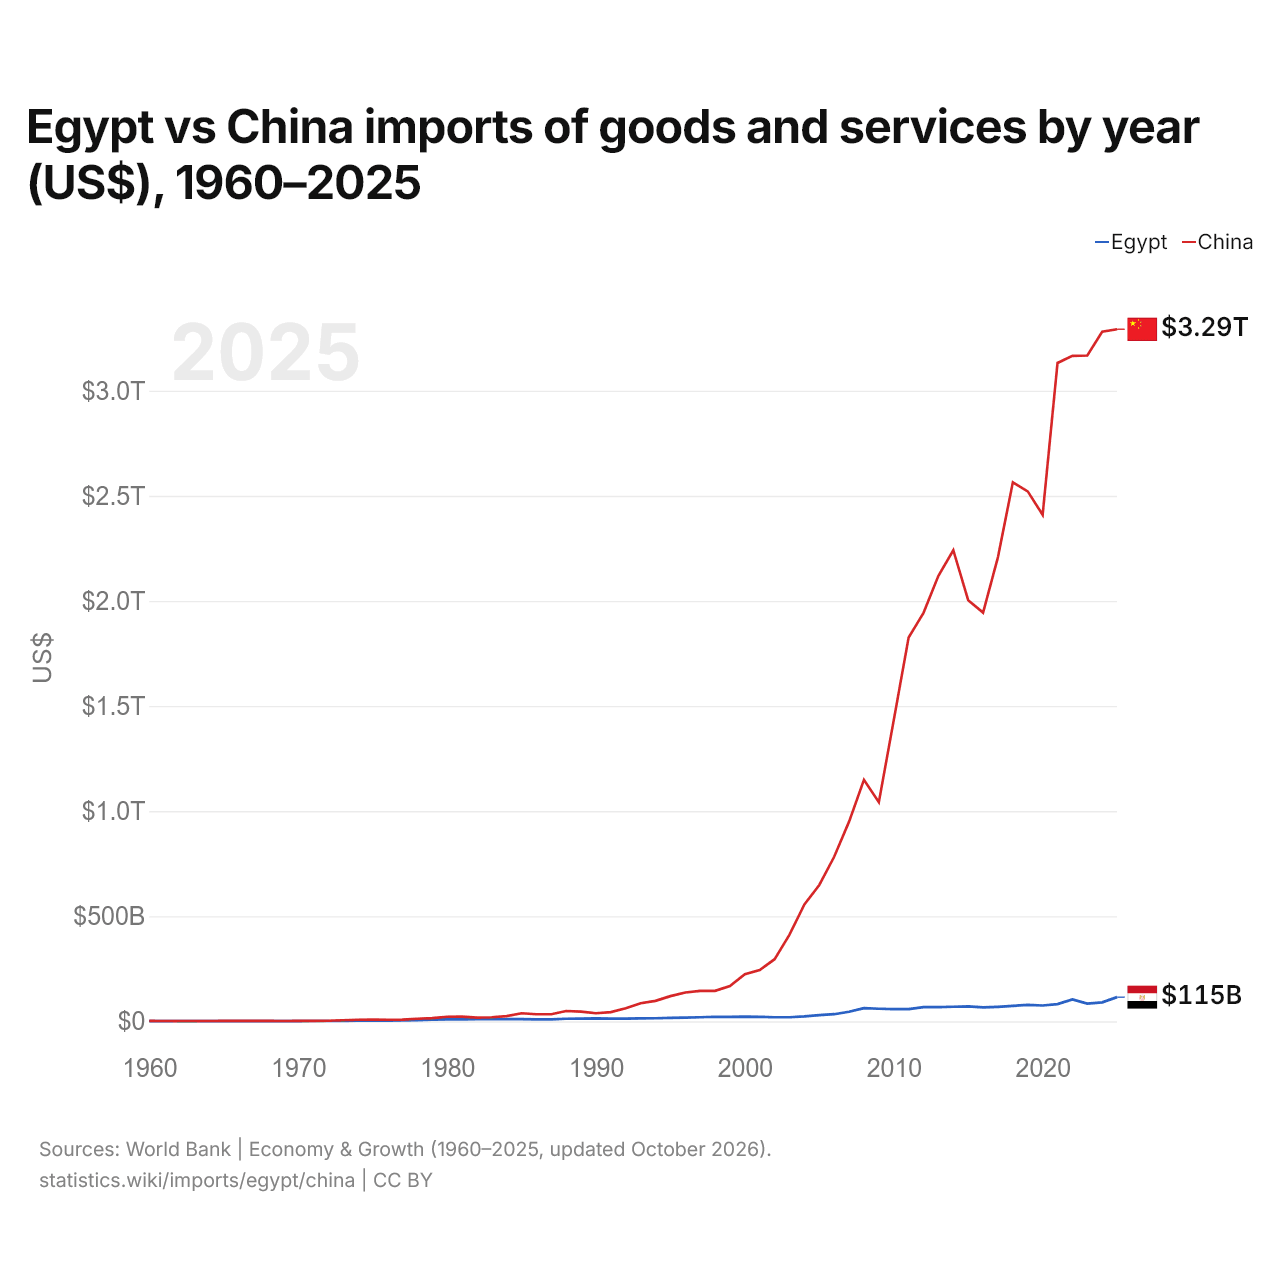
Egito vs China: importações de bens e serviços por ano (US$), 1960–2025
1x
| Ano | US$ | |
|---|---|---|
 Egito |
 China |
|
| 2025 | US$ 115.107.510.878 | US$ 3.292.280.901.123 |
| 2024 | US$ 90.357.257.364 | US$ 3.280.170.243.047 |
| 2023 | US$ 84.507.685.810 | US$ 3.167.502.597.276 |
| 2022 | US$ 104.389.057.751 | US$ 3.166.016.135.468 |
| 2021 | US$ 81.943.913.321 | US$ 3.132.116.155.606 |
| 2020 | US$ 75.433.562.071 | US$ 2.409.650.385.964 |
| 2019 | US$ 78.012.528.474 | US$ 2.521.036.548.137 |
| 2018 | US$ 73.331.457.513 | US$ 2.564.121.910.995 |
| 2017 | US$ 69.089.673.913 | US$ 2.208.518.918.632 |
| 2016 | US$ 66.159.509.202 | US$ 1.944.490.534.275 |
| 2015 | US$ 71.347.708.895 | US$ 2.003.260.696.069 |
| 2014 | US$ 69.296.987.088 | US$ 2.241.276.198.979 |
| 2013 | US$ 67.364.341.085 | US$ 2.119.392.421.428 |
| 2012 | US$ 67.866.666.667 | US$ 1.943.205.232.867 |
| 2011 | US$ 58.261.617.900 | US$ 1.825.413.639.206 |
| 2010 | US$ 58.221.415.608 | US$ 1.432.422.435.977 |
| 2009 | US$ 59.764.065.336 | US$ 1.042.533.759.653 |
| 2008 | US$ 62.909.090.909 | US$ 1.149.036.249.786 |
| 2007 | US$ 45.429.071.804 | US$ 950.020.767.157 |
| 2006 | US$ 33.913.043.478 | US$ 782.812.463.260 |
| 2005 | US$ 29.237.429.237 | US$ 648.712.207.880 |
| 2004 | US$ 23.311.688.312 | US$ 556.182.551.585 |
| 2003 | US$ 19.576.923.077 | US$ 412.137.124.715 |
| 2002 | US$ 19.303.370.787 | US$ 295.619.639.659 |
| 2001 | US$ 21.590.296.496 | US$ 243.973.790.218 |
| 2000 | US$ 22.779.979.451 | US$ 224.306.238.158 |
| 1999 | US$ 21.144.205.249 | US$ 168.058.444.268 |
| 1998 | US$ 21.812.278.630 | US$ 144.913.704.696 |
| 1997 | US$ 19.528.023.599 | US$ 144.623.820.000 |
| 1996 | US$ 17.718.160.377 | US$ 137.261.877.000 |
| 1995 | US$ 16.661.751.696 | US$ 119.900.826.000 |
| 1994 | US$ 14.561.091.340 | US$ 97.250.445.198 |
| 1993 | US$ 14.015.606.242 | US$ 86.072.328.750 |
| 1992 | US$ 12.938.946.228 | US$ 61.849.400.129 |
| 1991 | US$ 13.226.985.710 | US$ 43.941.659.170 |
| 1990 | US$ 13.997.308.210 | US$ 38.461.758.920 |
| 1989 | US$ 12.856.257.745 | US$ 46.118.793.490 |
| 1988 | US$ 12.322.544.009 | US$ 48.984.701.330 |
| 1987 | US$ 9.190.887.667 | US$ 33.781.853.910 |
| 1986 | US$ 9.167.446.211 | US$ 33.592.580.690 |
| 1985 | US$ 10.888.912.156 | US$ 38.302.403.274 |
| 1984 | US$ 10.857.880.026 | US$ 24.710.305.081 |
| 1983 | US$ 10.593.713.620 | US$ 19.385.304.449 |
| 1982 | US$ 10.472.660.099 | US$ 17.788.124.795 |
| 1981 | US$ 9.628.783.784 | US$ 22.219.750.000 |
| 1980 | US$ 9.289.542.760 | US$ 21.842.710.000 |
| 1979 | US$ 7.743.714.286 | US$ 15.535.283.000 |
| 1978 | US$ 5.026.531.231 | US$ 12.261.700.000 |
| 1977 | US$ 4.516.926.855 | US$ 8.060.398.000 |
| 1976 | US$ 3.717.576.961 | US$ 7.349.809.000 |
| 1975 | US$ 4.134.809.294 | US$ 8.355.050.000 |
| 1974 | US$ 2.888.427.176 | US$ 7.716.198.000 |
| 1973 | US$ 1.834.007.074 | US$ 5.257.791.000 |
| 1972 | US$ 1.615.822.130 | US$ 2.916.450.000 |
| 1971 | US$ 1.530.986.993 | US$ 2.233.127.000 |
| 1970 | US$ 1.374.780.206 | US$ 2.201.560.000 |
| 1969 | US$ 1.078.692.494 | US$ 1.731.190.000 |
| 1968 | US$ 1.035.981.308 | US$ 1.845.220.000 |
| 1967 | US$ 1.071.428.571 | US$ 1.919.860.000 |
| 1966 | US$ 1.081.156.918 | US$ 2.185.300.000 |
| 1965 | US$ 996.286.588 | US$ 1.916.420.000 |
| 1964 | US$ 1.171.388.946 | US$ 1.481.100.000 |
| 1963 | US$ 987.619.111 | US$ 1.210.670.000 |
| 1962 | US$ 787.660.480 | US$ 1.127.720.000 |
| 1961 | US$ 887.313.994 | US$ 1.408.090.000 |
| 1960 | US$ 918.039.754 | US$ 1.890.590.000 |
Em 2025, as importações de bens e serviços do Egito foram de US$ 115 bilhões e as da China, de US$ 3,29 trilhões: as da China foram 29 vezes maiores. Em 1960, as importações da China foram 2,1 vezes maiores: US$ 918 milhões do Egito e US$ 1,89 bilhão da China.
As importações de bens e serviços da China têm sido maiores que as do Egito todos os anos desde 1960.
Egito vs China: dados de importações
|
Egito
|
China
|
|
|---|---|---|
| Importações | US$ 115 bi (2025) | US$ 3,29 tri (2025) |
| Posição mundial | 46/174 | 2/174 |
| Participação mundial | 0,34% | 9,76% |
| % do PIB | 31,5% | 16,9% |
| Maior categoria de bens | Petróleo, gás, minérios e outras matérias-primas (25,2%, 2025) | Máquinas, eletrônicos e veículos (39,4%, 2025) |
| Principal origem dos bens | China (18,6%, 2025) | Coreia do Sul (7,26%, 2025) |
Comparar as importações de 2 países quaisquer
Fontes:
- Banco Mundial | Economy & Growth (1960–2025, atualizado em outubro de 2026)
- TradeMap (2001–2025, atualizado em outubro de 2026)
Creative Commons Atribuição (CC BY): você pode copiar, compartilhar, adaptar e reutilizar este conteúdo, inclusive para fins comerciais, desde que cite o statistics.wiki e indique as alterações que fizer. As fontes listadas acima podem ter suas próprias condições de licença.