
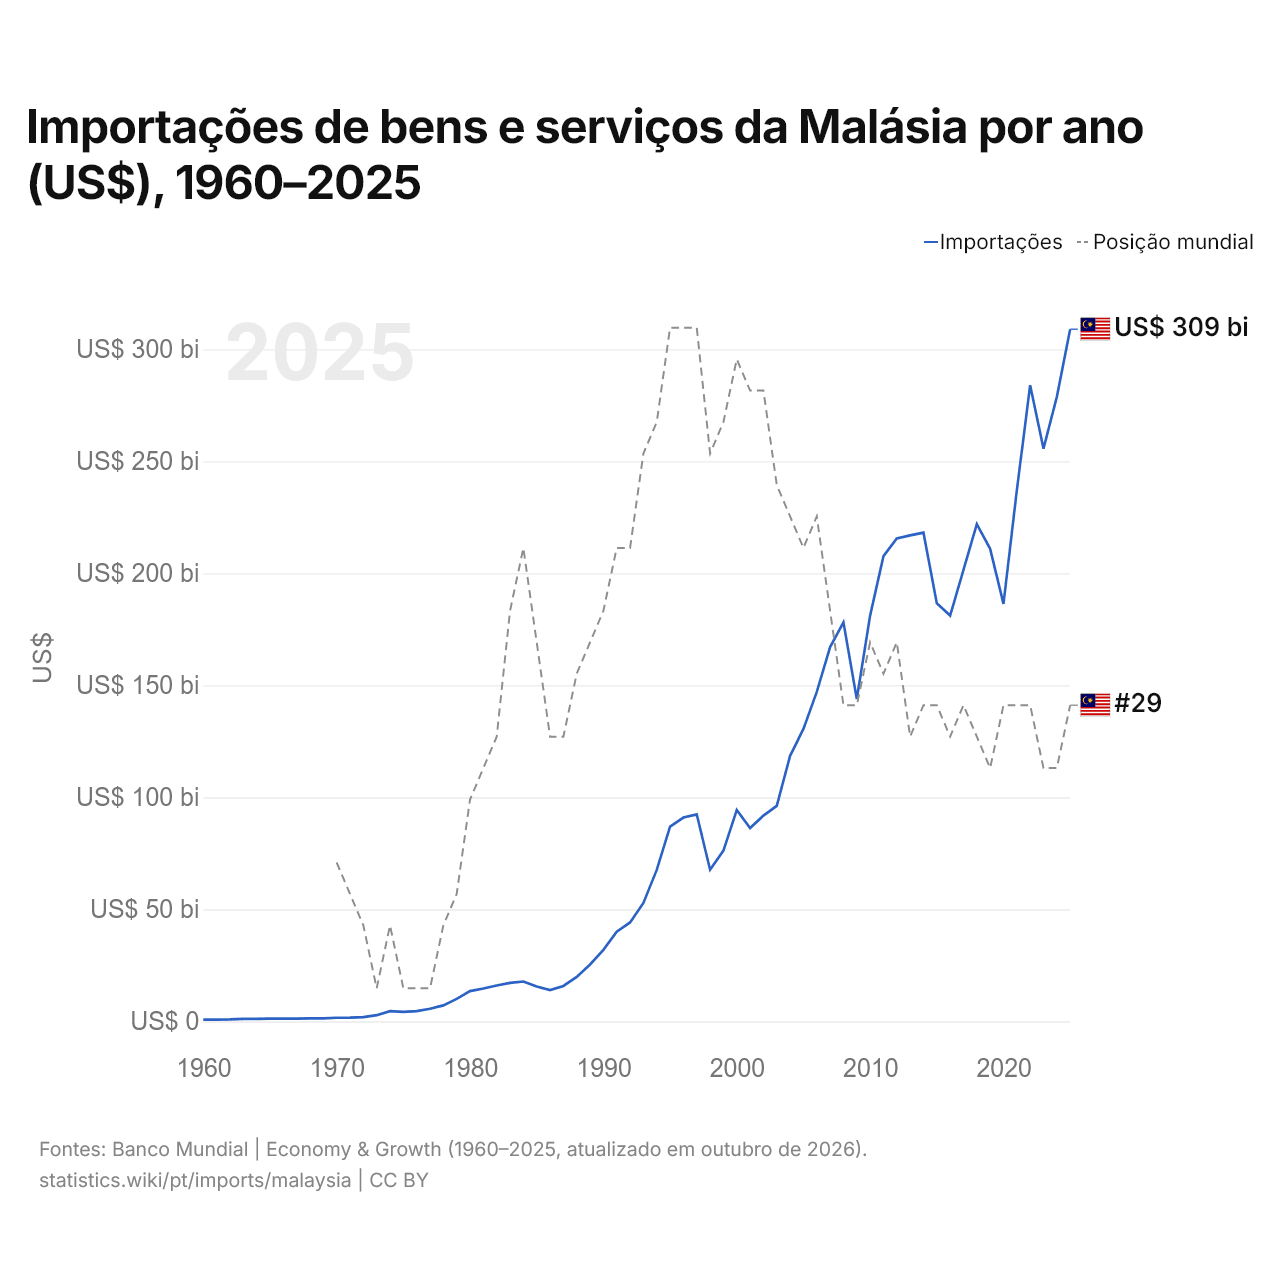
Importações de bens e serviços da Malásia por ano (US$), 1960–2025
| Ano | US$ | Posição mundial |
|---|---|---|
| Importações | Posição mundial | |
| 2025 | US$ 308.949.499.863 | #29 |
| 2024 | US$ 278.760.544.031 | #31 |
| 2023 | US$ 255.625.703.550 | #31 |
| 2022 | US$ 283.918.591.272 | #29 |
| 2021 | US$ 236.990.392.678 | #29 |
| 2020 | US$ 186.310.380.061 | #29 |
| 2019 | US$ 210.893.037.729 | #31 |
| 2018 | US$ 221.902.484.183 | #30 |
| 2017 | US$ 201.496.430.250 | #29 |
| 2016 | US$ 181.125.866.049 | #30 |
| 2015 | US$ 186.603.344.673 | #29 |
| 2014 | US$ 218.115.959.742 | #29 |
| 2013 | US$ 216.892.331.705 | #30 |
| 2012 | US$ 215.525.053.249 | #27 |
| 2011 | US$ 207.619.404.295 | #28 |
| 2010 | US$ 181.099.423.890 | #27 |
| 2009 | US$ 143.890.358.442 | #29 |
| 2008 | US$ 178.114.431.987 | #29 |
| 2007 | US$ 167.027.920.021 | #26 |
| 2006 | US$ 147.060.242.731 | #23 |
| 2005 | US$ 130.552.677.358 | #24 |
| 2004 | US$ 118.513.157.895 | #23 |
| 2003 | US$ 96.153.421.053 | #22 |
| 2002 | US$ 91.820.789.474 | #19 |
| 2001 | US$ 86.253.947.368 | #19 |
| 2000 | US$ 94.349.736.842 | #18 |
| 1999 | US$ 76.187.894.737 | #20 |
| 1998 | US$ 67.655.931.512 | #21 |
| 1997 | US$ 92.380.580.595 | #17 |
| 1996 | US$ 90.962.318.149 | #17 |
| 1995 | US$ 86.952.551.834 | #17 |
| 1994 | US$ 67.592.211.553 | #20 |
| 1993 | US$ 52.860.519.911 | #21 |
| 1992 | US$ 44.155.181.215 | #24 |
| 1991 | US$ 40.044.733.779 | #24 |
| 1990 | US$ 31.883.543.602 | #26 |
| 1989 | US$ 25.372.465.430 | #27 |
| 1988 | US$ 19.826.003.147 | #28 |
| 1987 | US$ 15.776.869.534 | #30 |
| 1986 | US$ 13.922.838.476 | #30 |
| 1985 | US$ 15.529.741.341 | #27 |
| 1984 | US$ 17.772.765.636 | #24 |
| 1983 | US$ 17.142.918.686 | #26 |
| 1982 | US$ 15.971.622.751 | #30 |
| 1981 | US$ 14.633.320.675 | #31 |
| 1980 | US$ 13.478.905.389 | #32 |
| 1979 | US$ 9.999.808.083 | #35 |
| 1978 | US$ 7.114.292.401 | #36 |
| 1977 | US$ 5.601.956.378 | #38 |
| 1976 | US$ 4.571.968.169 | #38 |
| 1975 | US$ 4.193.454.364 | #38 |
| 1974 | US$ 4.565.307.073 | #36 |
| 1973 | US$ 2.747.070.596 | #38 |
| 1972 | US$ 1.884.339.236 | #36 |
| 1971 | US$ 1.656.477.495 | #35 |
| 1970 | US$ 1.596.749.009 | #34 |
| 1969 | US$ 1.356.648.656 | - |
| 1968 | US$ 1.322.348.606 | - |
| 1967 | US$ 1.228.595.135 | - |
| 1966 | US$ 1.212.261.778 | - |
| 1965 | US$ 1.194.948.419 | - |
| 1964 | US$ 1.132.554.994 | - |
| 1963 | US$ 1.104.134.953 | - |
| 1962 | US$ 863.381.266 | - |
| 1961 | US$ 790.861.160 | - |
| 1960 | US$ 752.314.437 | - |
Em 2025, as importações de bens e serviços da Malásia foram de US$ 309 bilhões, ante US$ 752 milhões em 1960. Foram as 29ª maiores do mundo; em 2024, eram as 31ª. Sua melhor posição foi o 17º lugar, ocupado pela última vez em 1997.
Em 2025, as importações de bens e serviços da Malásia foram as 12ª maiores de 44 países da Ásia. Em 2025, as exportações da Malásia superaram as importações em US$ 26,2 bilhões, um superávit comercial. O comércio da Malásia, exportações e importações somadas, equivaleu a 136,4% do seu PIB em 2025, o 28º lugar do mundo.
Importações de bens da Malásia por categoria, 2025
Importações de bens, 2025: US$ 339 bi
Em 2025, a maior categoria das importações de bens da Malásia foi máquinas, eletrônicos e veículos, com 54,4%, seguida de petróleo, gás, minérios e outras matérias-primas, com 16,3%.
Origens das importações de bens da Malásia: as 10 principais, 2025
| Posição | País | Importações de bens | Participação | |
|---|---|---|---|---|
| 1 |
 China |
US$ 82,4 bi | 24,3% | vs China |
| 2 |
 Singapura |
US$ 35,7 bi | 10,5% | vs Singapura |
| 3 |
 Estados Unidos |
US$ 30,9 bi | 9,11% | |
| 4 |
 Japão |
US$ 15,6 bi | 4,59% | vs Japão |
| 5 |
 Coreia do Sul |
US$ 15,1 bi | 4,44% | vs Coreia do Sul |
| 6 |
 Indonésia |
US$ 14,6 bi | 4,31% | vs Indonésia |
| 7 |
 Tailândia |
US$ 12,7 bi | 3,75% | vs Tailândia |
| 8 |
 Vietnã |
US$ 8,62 bi | 2,54% | vs Vietnã |
| 9 |
 Alemanha |
US$ 7,13 bi | 2,1% | |
| 10 |
 Austrália |
US$ 7,01 bi | 2,07% | |
| Outros parceiros e não especificados | US$ 109 bi | 32,3% |
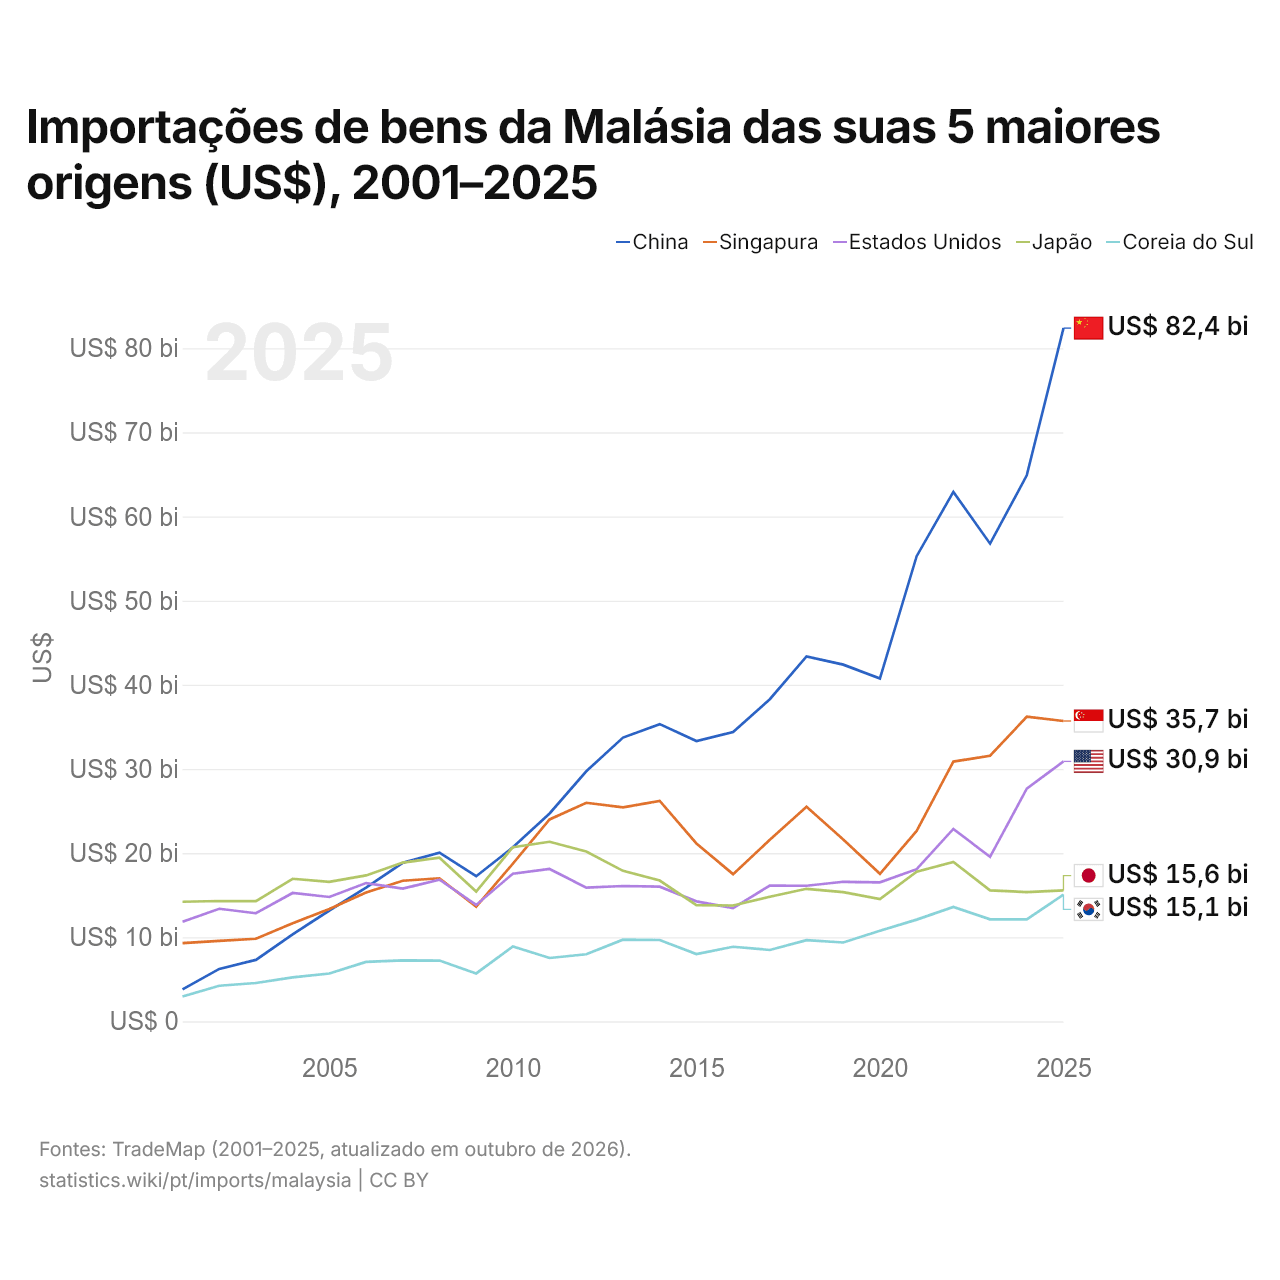
Importações de bens da Malásia das suas 5 maiores origens (US$), 2001–2025
| Ano | US$ | ||||
|---|---|---|---|---|---|
| China | Singapura | Estados Unidos | Japão | Coreia do Sul | |
| 2025 | US$ 82.394.835.000 | US$ 35.701.325.000 | US$ 30.896.268.000 | US$ 15.557.292.000 | US$ 15.071.524.000 |
| 2024 | US$ 64.894.112.000 | US$ 36.198.563.000 | US$ 27.649.738.000 | US$ 15.354.307.000 | US$ 12.124.714.000 |
| 2023 | US$ 56.772.167.000 | US$ 31.568.844.000 | US$ 19.554.627.000 | US$ 15.572.253.000 | US$ 12.116.782.000 |
| 2022 | US$ 62.927.993.000 | US$ 30.871.517.000 | US$ 22.872.112.000 | US$ 18.951.096.000 | US$ 13.603.333.000 |
| 2021 | US$ 55.285.162.000 | US$ 22.624.611.000 | US$ 18.083.190.000 | US$ 17.794.100.000 | US$ 12.089.502.000 |
| 2020 | US$ 40.754.170.000 | US$ 17.534.569.000 | US$ 16.525.903.000 | US$ 14.532.350.000 | US$ 10.764.806.000 |
| 2019 | US$ 42.395.009.000 | US$ 21.620.587.000 | US$ 16.584.568.000 | US$ 15.351.881.000 | US$ 9.369.094.000 |
| 2018 | US$ 43.378.353.000 | US$ 25.510.360.000 | US$ 16.116.608.000 | US$ 15.749.962.000 | US$ 9.650.585.000 |
| 2017 | US$ 38.286.785.000 | US$ 21.581.763.000 | US$ 16.146.742.000 | US$ 14.805.199.000 | US$ 8.482.126.000 |
| 2016 | US$ 34.387.414.000 | US$ 17.494.758.000 | US$ 13.450.062.000 | US$ 13.765.631.000 | US$ 8.862.705.000 |
| 2015 | US$ 33.319.278.000 | US$ 21.145.608.000 | US$ 14.260.332.000 | US$ 13.802.748.000 | US$ 7.998.385.000 |
| 2014 | US$ 35.322.309.000 | US$ 26.200.004.000 | US$ 16.009.272.000 | US$ 16.731.372.000 | US$ 9.667.998.000 |
| 2013 | US$ 33.728.561.000 | US$ 25.432.068.000 | US$ 16.087.775.000 | US$ 17.888.705.000 | US$ 9.710.622.000 |
| 2012 | US$ 29.723.042.000 | US$ 25.978.492.000 | US$ 15.884.979.000 | US$ 20.181.275.000 | US$ 7.965.934.000 |
| 2011 | US$ 24.710.273.000 | US$ 23.995.387.000 | US$ 18.106.865.000 | US$ 21.346.068.000 | US$ 7.530.378.000 |
| 2010 | US$ 20.679.866.000 | US$ 18.731.505.000 | US$ 17.551.425.000 | US$ 20.704.520.000 | US$ 8.891.365.000 |
| 2009 | US$ 17.245.921.000 | US$ 13.622.423.000 | US$ 13.835.476.000 | US$ 15.430.301.000 | US$ 5.694.372.000 |
| 2008 | US$ 20.046.602.000 | US$ 17.007.216.000 | US$ 16.834.425.000 | US$ 19.453.713.000 | US$ 7.220.972.000 |
| 2007 | US$ 18.841.698.000 | US$ 16.715.262.000 | US$ 15.776.161.000 | US$ 18.866.751.000 | US$ 7.238.240.000 |
| 2006 | US$ 15.883.589.000 | US$ 15.313.893.000 | US$ 16.434.447.000 | US$ 17.341.034.000 | US$ 7.061.968.000 |
| 2005 | US$ 13.173.660.000 | US$ 13.356.095.000 | US$ 14.776.362.000 | US$ 16.578.957.000 | US$ 5.679.022.000 |
| 2004 | US$ 10.335.270.000 | US$ 11.651.658.000 | US$ 15.258.594.000 | US$ 16.944.509.000 | US$ 5.223.822.000 |
| 2003 | US$ 7.299.652.000 | US$ 9.810.976.000 | US$ 12.850.600.000 | US$ 14.282.271.000 | US$ 4.554.628.000 |
| 2002 | US$ 6.228.932.000 | US$ 9.566.790.000 | US$ 13.376.906.000 | US$ 14.300.167.000 | US$ 4.234.674.000 |
| 2001 | US$ 3.804.427.000 | US$ 9.291.935.000 | US$ 11.838.633.000 | US$ 14.211.044.000 | US$ 2.948.124.000 |
Em 2025, as importações de bens foram de US$ 82,4 bilhões da China, US$ 35,7 bilhões de Singapura, US$ 30,9 bilhões dos Estados Unidos, US$ 15,6 bilhões do Japão e US$ 15,1 bilhões da Coreia do Sul. O primeiro lugar dos cinco fornecedores da Malásia fica com a China desde 2011. A mudança mais recente nessa ordem foi em 2017, quando as importações da Malásia vindas dos Estados Unidos superaram as vindas do Japão.
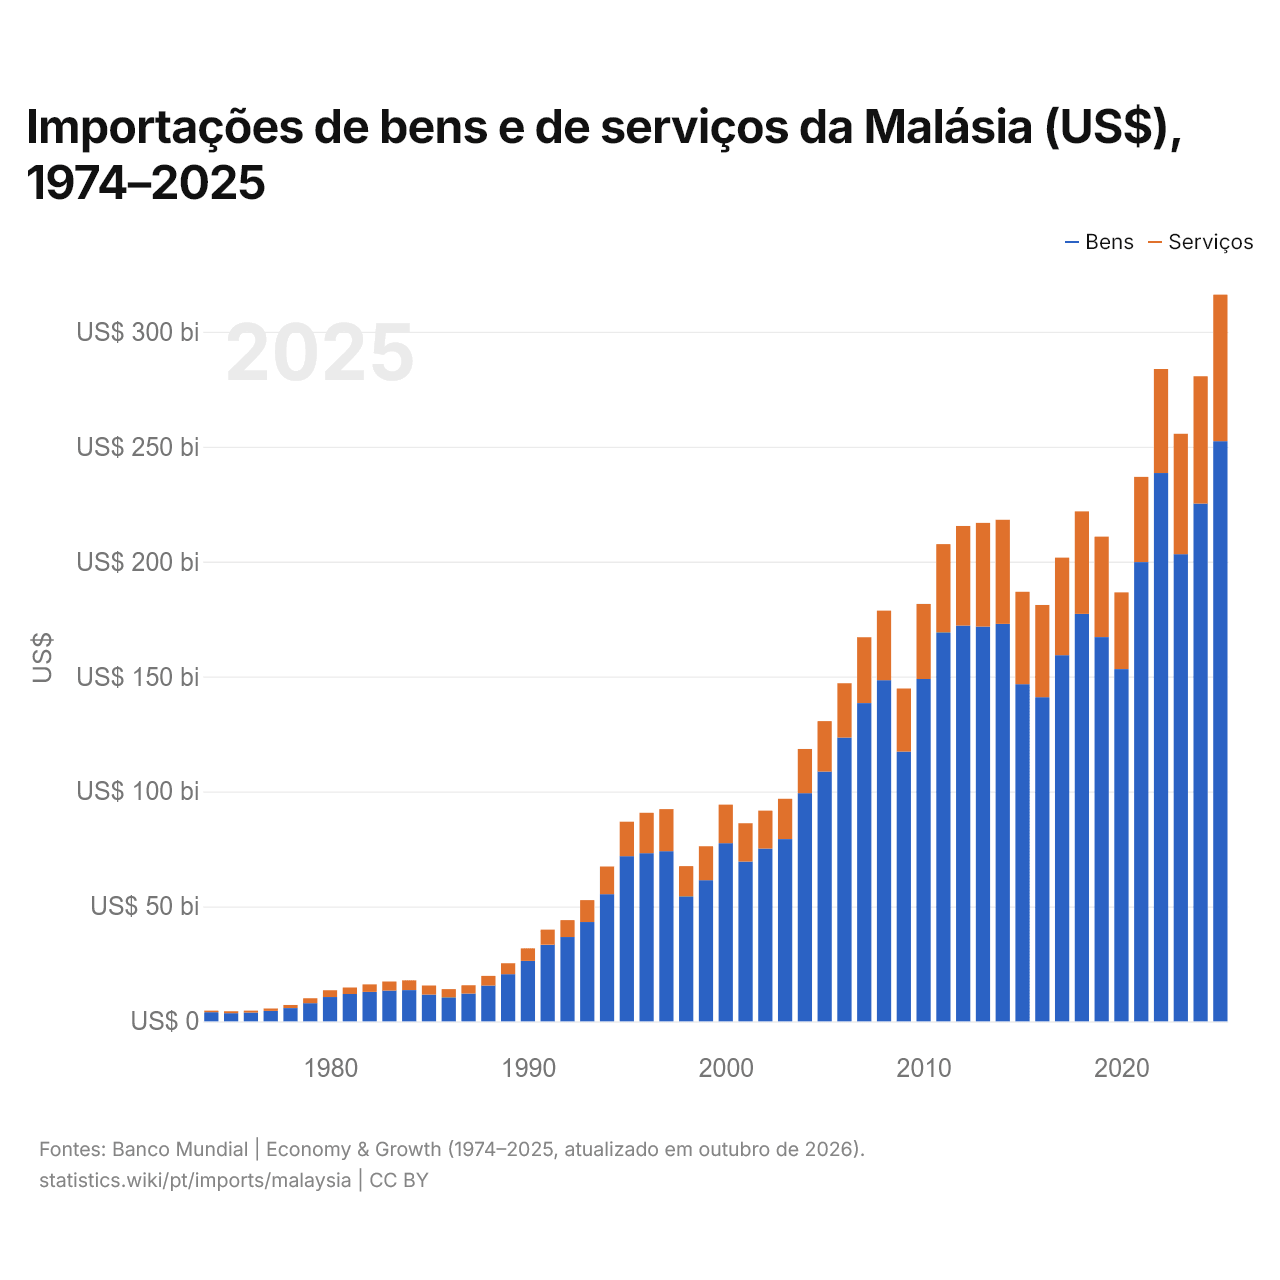
Importações de bens e de serviços da Malásia (US$), 1974–2025
| Ano | US$ | |
|---|---|---|
| Bens | Serviços | |
| 2025 | US$ 252.386.190.699 | US$ 63.721.884.596 |
| 2024 | US$ 225.188.529.674 | US$ 55.436.593.477 |
| 2023 | US$ 203.226.769.495 | US$ 52.367.141.728 |
| 2022 | US$ 238.512.865.570 | US$ 45.244.981.916 |
| 2021 | US$ 199.775.860.847 | US$ 37.079.568.385 |
| 2020 | US$ 153.232.904.069 | US$ 33.380.568.102 |
| 2019 | US$ 167.149.541.157 | US$ 43.710.611.539 |
| 2018 | US$ 177.229.630.862 | US$ 44.601.873.163 |
| 2017 | US$ 159.270.121.799 | US$ 42.443.489.288 |
| 2016 | US$ 140.985.502.811 | US$ 40.144.714.580 |
| 2015 | US$ 146.687.100.439 | US$ 40.169.379.566 |
| 2014 | US$ 172.877.628.664 | US$ 45.319.650.864 |
| 2013 | US$ 171.707.920.961 | US$ 45.137.192.445 |
| 2012 | US$ 172.152.028.141 | US$ 43.348.518.287 |
| 2011 | US$ 169.225.636.072 | US$ 38.344.535.724 |
| 2010 | US$ 148.932.471.859 | US$ 32.644.635.837 |
| 2009 | US$ 117.326.991.632 | US$ 27.471.538.281 |
| 2008 | US$ 148.391.351.161 | US$ 30.269.789.906 |
| 2007 | US$ 138.432.168.744 | US$ 28.668.366.316 |
| 2006 | US$ 123.443.067.167 | US$ 23.651.024.056 |
| 2005 | US$ 108.621.428.220 | US$ 21.955.728.606 |
| 2004 | US$ 99.217.134.211 | US$ 19.268.607.895 |
| 2003 | US$ 79.281.578.947 | US$ 17.531.710.526 |
| 2002 | US$ 75.221.210.526 | US$ 16.447.842.105 |
| 2001 | US$ 69.524.736.842 | US$ 16.656.578.947 |
| 2000 | US$ 77.519.236.842 | US$ 16.747.421.053 |
| 1999 | US$ 61.404.105.263 | US$ 14.735.263.158 |
| 1998 | US$ 54.377.830.865 | US$ 13.126.676.222 |
| 1997 | US$ 74.028.727.750 | US$ 18.296.655.934 |
| 1996 | US$ 73.136.806.584 | US$ 17.572.738.646 |
| 1995 | US$ 71.870.587.981 | US$ 14.980.808.808 |
| 1994 | US$ 55.320.046.185 | US$ 12.052.174.775 |
| 1993 | US$ 43.201.202.753 | US$ 9.515.965.805 |
| 1992 | US$ 36.672.533.253 | US$ 7.335.762.842 |
| 1991 | US$ 33.321.010.400 | US$ 6.564.204.504 |
| 1990 | US$ 26.280.327.187 | US$ 5.484.541.800 |
| 1989 | US$ 20.498.429.526 | US$ 4.791.716.016 |
| 1988 | US$ 15.553.405.844 | US$ 4.205.387.998 |
| 1987 | US$ 12.093.402.294 | US$ 3.594.563.505 |
| 1986 | US$ 10.440.677.528 | US$ 3.575.134.050 |
| 1985 | US$ 11.677.210.411 | US$ 3.926.635.679 |
| 1984 | US$ 13.589.961.494 | US$ 4.254.063.300 |
| 1983 | US$ 13.366.074.318 | US$ 3.964.243.405 |
| 1982 | US$ 12.801.278.876 | US$ 3.269.258.905 |
| 1981 | US$ 11.886.073.894 | US$ 2.855.747.845 |
| 1980 | US$ 10.569.238.901 | US$ 2.956.520.409 |
| 1979 | US$ 7.913.850.421 | US$ 2.107.892.603 |
| 1978 | US$ 5.760.259.065 | US$ 1.358.783.845 |
| 1977 | US$ 4.551.690.515 | US$ 1.050.265.106 |
| 1976 | US$ 3.811.809.607 | US$ 832.161.160 |
| 1975 | US$ 3.550.864.392 | US$ 848.447.715 |
| 1974 | US$ 3.958.760.318 | US$ 698.360.384 |
Em 2025, as importações de bens da Malásia foram de US$ 252 bilhões e as de serviços, de US$ 63,7 bilhões; os serviços representaram 20,2% do total, ante 15,0% em 1974.
A Malásia na classificação mundial de importações, 2025
| Posição | País | Importações | Participação mundial | |
|---|---|---|---|---|
| 26 |
Tailândia
|
US$ 388 bi | 1,15% | vs Tailândia |
| 27 |
 Arábia Saudita |
US$ 360 bi | 1,07% | |
| 28 |
 Suécia |
US$ 342 bi | 1,01% | |
| 29 |
 Malásia |
US$ 309 bi | 0,92% | |
| 30 |
 Áustria |
US$ 303 bi | 0,9% | |
| 31 |
Indonésia
|
US$ 297 bi | 0,88% | vs Indonésia |
| 32 |
 Dinamarca |
US$ 273 bi | 0,81% |
Importações de bens e serviços da Malásia, % do PIB, 1960–2025
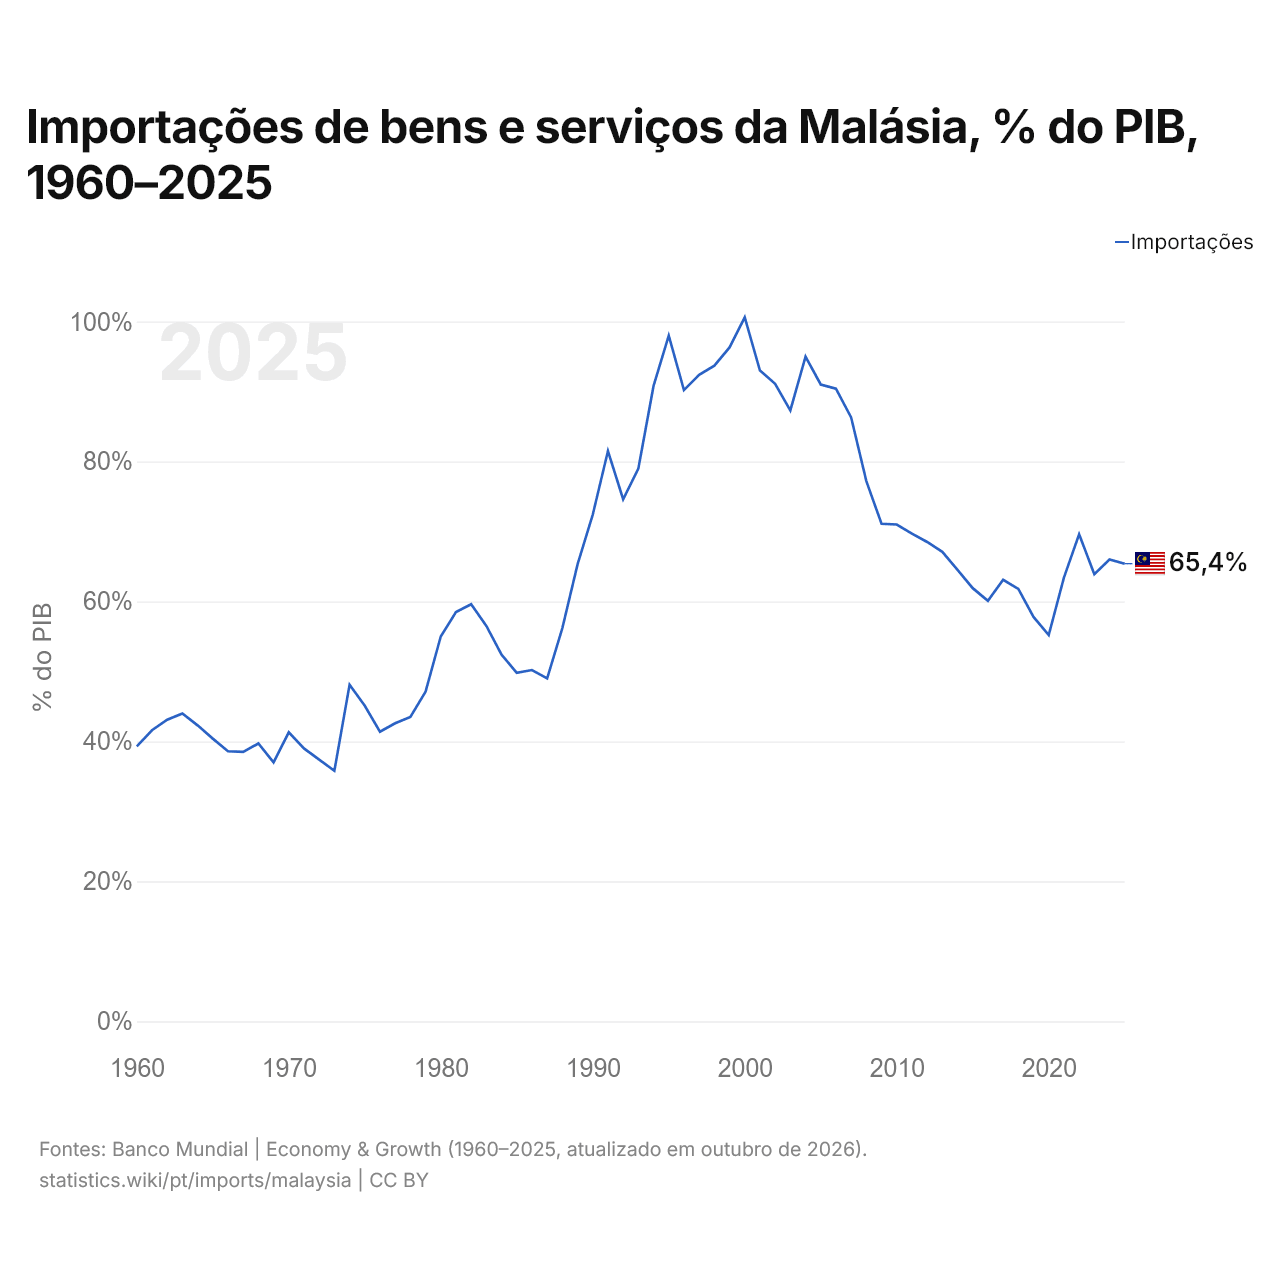
Em 2025, as importações de bens e serviços da Malásia equivaleram a 65,4% do seu PIB, ante 39,3% em 1960. A maior participação foi de 100,6%, em 2000.
Comparar as importações da Malásia com as de outros países
Fontes:
- TradeMap (2001–2025, atualizado em outubro de 2026)
- Banco Mundial | Economy & Growth (1960–2025, atualizado em outubro de 2026)
Creative Commons Atribuição (CC BY): você pode copiar, compartilhar, adaptar e reutilizar este conteúdo, inclusive para fins comerciais, desde que cite o statistics.wiki e indique as alterações que fizer. As fontes listadas acima podem ter suas próprias condições de licença.