
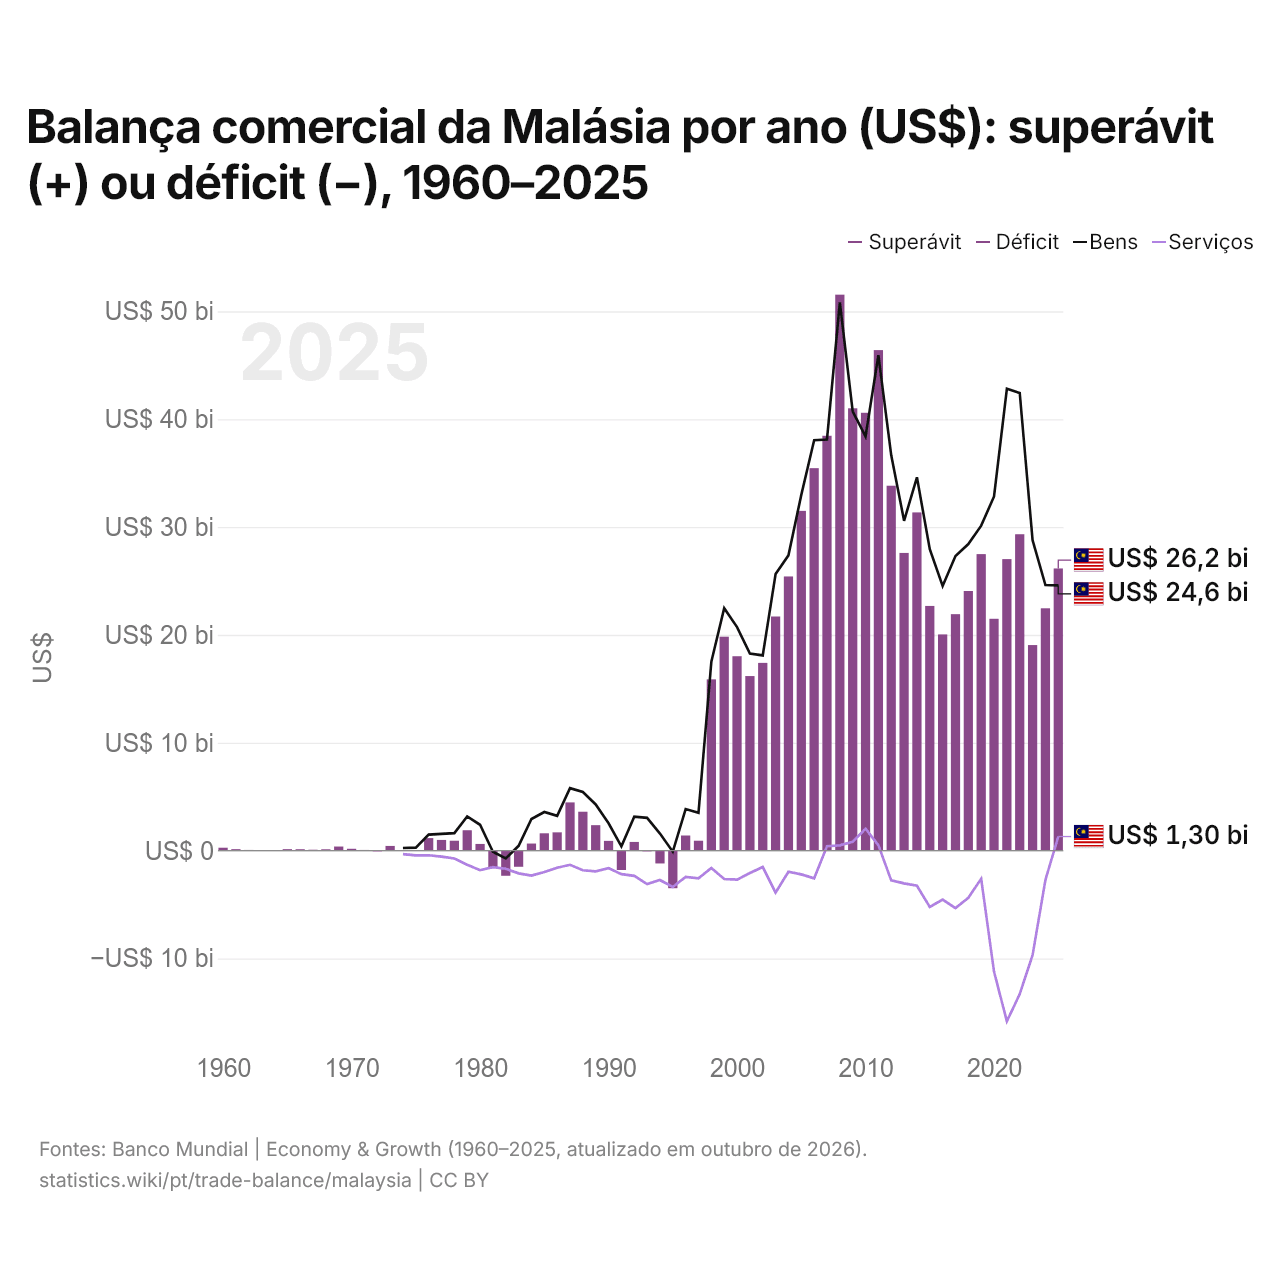
Balança comercial da Malásia por ano (US$): superávit (+) ou déficit (−), 1960–2025
| Ano | US$ | ||
|---|---|---|---|
| Bens e serviços | Bens | Serviços | |
| 2025 | US$ 26.155.524.757 | US$ 24.582.979.071 | US$ 1.299.694.606 |
| 2024 | US$ 22.460.782.733 | US$ 24.620.089.996 | US$ −2.719.412.293 |
| 2023 | US$ 19.055.372.040 | US$ 28.782.071.351 | US$ −9.699.555.119 |
| 2022 | US$ 29.327.053.202 | US$ 42.424.945.000 | US$ −13.302.904.461 |
| 2021 | US$ 27.025.058.299 | US$ 42.814.010.893 | US$ −15.833.585.371 |
| 2020 | US$ 21.488.160.292 | US$ 32.828.821.622 | US$ −11.225.374.883 |
| 2019 | US$ 27.486.823.562 | US$ 30.122.941.693 | US$ −2.621.960.559 |
| 2018 | US$ 24.065.106.453 | US$ 28.425.817.652 | US$ −4.371.346.889 |
| 2017 | US$ 21.917.407.075 | US$ 27.315.981.202 | US$ −5.327.703.340 |
| 2016 | US$ 20.039.192.525 | US$ 24.534.516.761 | US$ −4.544.181.452 |
| 2015 | US$ 22.683.943.184 | US$ 27.943.873.215 | US$ −5.232.181.309 |
| 2014 | US$ 31.354.839.498 | US$ 34.605.096.942 | US$ −3.263.542.282 |
| 2013 | US$ 27.598.385.101 | US$ 30.577.423.644 | US$ −3.037.086.327 |
| 2012 | US$ 33.828.012.876 | US$ 36.643.050.452 | US$ −2.767.396.489 |
| 2011 | US$ 46.400.608.104 | US$ 45.938.381.871 | US$ 498.178.093 |
| 2010 | US$ 40.588.161.698 | US$ 38.403.087.573 | US$ 2.031.503.646 |
| 2009 | US$ 41.006.916.436 | US$ 40.731.049.060 | US$ 819.923.303 |
| 2008 | US$ 51.542.148.543 | US$ 50.831.096.978 | US$ 481.592.020 |
| 2007 | US$ 38.460.318.906 | US$ 38.113.020.961 | US$ 407.439.739 |
| 2006 | US$ 35.456.849.547 | US$ 38.041.835.539 | US$ −2.570.119.945 |
| 2005 | US$ 31.496.198.138 | US$ 32.981.557.786 | US$ −2.206.040.995 |
| 2004 | US$ 25.414.473.684 | US$ 27.372.102.632 | US$ −1.957.378.947 |
| 2003 | US$ 21.700.789.474 | US$ 25.647.921.053 | US$ −3.891.368.421 |
| 2002 | US$ 17.400.263.158 | US$ 18.094.657.895 | US$ −1.529.421.053 |
| 2001 | US$ 16.181.842.105 | US$ 18.266.842.105 | US$ −2.085.263.158 |
| 2000 | US$ 18.019.473.684 | US$ 20.721.289.474 | US$ −2.701.526.316 |
| 1999 | US$ 19.828.157.895 | US$ 22.470.131.579 | US$ −2.641.894.737 |
| 1998 | US$ 15.873.420.302 | US$ 17.504.953.018 | US$ −1.609.937.888 |
| 1997 | US$ 913.833.487 | US$ 3.509.536.914 | US$ −2.569.323.692 |
| 1996 | US$ 1.397.169.886 | US$ 3.848.259.648 | US$ −2.437.257.608 |
| 1995 | US$ −3.490.430.622 | US$ −103.417.812 | US$ −3.379.246.893 |
| 1994 | US$ −1.194.177.717 | US$ 1.577.208.530 | US$ −2.732.202.262 |
| 1993 | US$ −66.819.601 | US$ 3.036.795.456 | US$ −3.104.392.029 |
| 1992 | US$ 802.607.296 | US$ 3.150.291.476 | US$ −2.346.721.799 |
| 1991 | US$ −1.798.807.099 | US$ 390.899.615 | US$ −2.189.765.097 |
| 1990 | US$ 899.856.740 | US$ 2.525.440.177 | US$ −1.625.583.437 |
| 1989 | US$ 2.355.988.278 | US$ 4.277.474.074 | US$ −1.921.485.506 |
| 1988 | US$ 3.600.145.564 | US$ 5.426.565.772 | US$ −1.826.420.666 |
| 1987 | US$ 4.463.339.575 | US$ 5.783.369.703 | US$ −1.322.015.130 |
| 1986 | US$ 1.690.528.007 | US$ 3.214.482.863 | US$ −1.593.683.116 |
| 1985 | US$ 1.601.261.678 | US$ 3.573.439.834 | US$ −1.992.314.534 |
| 1984 | US$ 647.709.846 | US$ 2.930.908.807 | US$ −2.321.600.643 |
| 1983 | US$ −1.505.654.281 | US$ 438.126.010 | US$ −2.113.085.623 |
| 1982 | US$ −2.335.368.110 | US$ −731.354.841 | US$ −1.690.080.537 |
| 1981 | US$ −1.546.357.077 | US$ −115.011.121 | US$ −1.540.281.018 |
| 1980 | US$ 612.802.801 | US$ 2.393.329.915 | US$ −1.821.411.346 |
| 1979 | US$ 1.882.617.862 | US$ 3.159.782.647 | US$ −1.317.832.705 |
| 1978 | US$ 910.173.477 | US$ 1.620.005.398 | US$ −730.988.576 |
| 1977 | US$ 986.477.378 | US$ 1.541.472.268 | US$ −559.057.944 |
| 1976 | US$ 1.154.402.290 | US$ 1.480.971.445 | US$ −433.982.865 |
| 1975 | US$ 42.055.296 | US$ 275.296.428 | US$ −438.636.190 |
| 1974 | US$ 22.433.941 | US$ 240.541.738 | US$ −326.123.082 |
| 1973 | US$ 431.787.765 | - | - |
| 1972 | US$ −68.095.828 | - | - |
| 1971 | US$ 60.938.452 | - | - |
| 1970 | US$ 163.660.240 | - | - |
| 1969 | US$ 373.707.215 | - | - |
| 1968 | US$ 117.273.505 | - | - |
| 1967 | US$ 77.746.781 | - | - |
| 1966 | US$ 124.133.515 | - | - |
| 1965 | US$ 132.300.194 | - | - |
| 1964 | US$ 46.386.735 | - | - |
| 1963 | US$ 43.446.730 | - | - |
| 1962 | US$ 58.146.752 | - | - |
| 1961 | US$ 130.993.525 | - | - |
| 1960 | US$ 264.600.388 | - | - |
Em 2025, a balança comercial da Malásia teve um superávit de US$ 26,2 bilhões, ante um superávit de US$ 265 milhões em 1960. O maior déficit foi de US$ 3,49 bilhões, em 1995, e o maior superávit, de US$ 51,5 bilhões, em 2008. A balança comercial da Malásia teve superávit em todos os anos desde 1996. O comércio de bens teve um superávit de US$ 24,6 bilhões e o de serviços, um superávit de US$ 1,3 bilhão.
Em 2025, o saldo comercial da Malásia foi o 9º mais alto de 44 países da Ásia, onde os saldos iam de um déficit de US$ 68,9 bilhões na Índia a um superávit de US$ 816 bilhões na China. De 2016 a 2025, os saldos comerciais da Malásia somaram um superávit de US$ 239 bilhões, ante um superávit de US$ 369 bilhões de 2006 a 2015. Em 2025, a conta corrente da Malásia teve um superávit de 1,6% do PIB.
Comércio de bens da Malásia com os seus 10 maiores parceiros comerciais, segundo a Malásia, 2025
| País | Exportações para | Importações de | Saldo | |
|---|---|---|---|---|
 China |
US$ 44,1 bi | US$ 82,4 bi | -US$ 38,3 bi | vs China |
 Singapura |
US$ 58,3 bi | US$ 35,7 bi | +US$ 22,6 bi | vs Singapura |
 Estados Unidos |
US$ 54,4 bi | US$ 30,9 bi | +US$ 23,5 bi | |
 Japão |
US$ 17,8 bi | US$ 15,6 bi | +US$ 2,29 bi | vs Japão |
 Tailândia |
US$ 15,0 bi | US$ 12,7 bi | +US$ 2,24 bi | vs Tailândia |
 Coreia do Sul |
US$ 12,3 bi | US$ 15,1 bi | -US$ 2,78 bi | vs Coreia do Sul |
 Indonésia |
US$ 12,0 bi | US$ 14,6 bi | -US$ 2,67 bi | vs Indonésia |
 Vietnã |
US$ 12,9 bi | US$ 8,62 bi | +US$ 4,29 bi | vs Vietnã |
 Índia |
US$ 12,2 bi | US$ 6,30 bi | +US$ 5,92 bi | |
 Austrália |
US$ 11,4 bi | US$ 7,01 bi | +US$ 4,36 bi |
Balança comercial da Malásia: superávit (+) ou déficit (−)
| Bens e serviços, US$, 2025 | +US$ 26,2 bi |
|---|---|
| % do PIB, 2025 | +5,5% |
| Anos com superávit, 2000–2025 | 26 |
| Bens, US$, 2025 | +US$ 24,6 bi |
| Serviços, US$, 2025 | +US$ 1,30 bi |
| Maior superávit em bens, 2025 | Estados Unidos +US$ 23,5 bi |
| Maior déficit em bens, 2025 | China -US$ 38,3 bi |
Comparar a balança comercial da Malásia com a de outros países
Fontes:
- TradeMap (2025, atualizado em outubro de 2026)
- Banco Mundial | Economy & Growth (1960–2025, atualizado em outubro de 2026)
Creative Commons Atribuição (CC BY): você pode copiar, compartilhar, adaptar e reutilizar este conteúdo, inclusive para fins comerciais, desde que cite o statistics.wiki e indique as alterações que fizer. As fontes listadas acima podem ter suas próprias condições de licença.