
Balança comercial dos Estados Unidos por ano (US$): superávit (+) ou déficit (−), 1960–2025
| Ano | US$ | ||
|---|---|---|---|
| Bens e serviços | Bens | Serviços | |
| 2025 | US$ −931.962.000.000 | US$ −1.259.620.000.000 | US$ 327.658.000.000 |
| 2024 | US$ −898.460.000.000 | US$ −1.212.788.000.000 | US$ 327.313.000.000 |
| 2023 | US$ −786.496.000.000 | US$ −1.057.509.000.000 | US$ 307.911.000.000 |
| 2022 | US$ −937.889.000.000 | US$ −1.174.566.000.000 | US$ 271.677.000.000 |
| 2021 | US$ −849.233.000.000 | US$ −1.083.187.000.000 | US$ 256.082.000.000 |
| 2020 | US$ −618.554.000.000 | US$ −912.878.000.000 | US$ 275.826.000.000 |
| 2019 | US$ −577.290.000.000 | US$ −857.259.000.000 | US$ 321.853.000.000 |
| 2018 | US$ −593.077.000.000 | US$ −878.748.000.000 | US$ 321.531.000.000 |
| 2017 | US$ −543.329.000.000 | US$ −799.340.000.000 | US$ 301.497.000.000 |
| 2016 | US$ −503.272.000.000 | US$ −749.801.000.000 | US$ 287.204.000.000 |
| 2015 | US$ −524.320.000.000 | US$ −761.866.000.000 | US$ 289.607.000.000 |
| 2014 | US$ −508.900.000.000 | US$ −749.917.000.000 | US$ 286.294.000.000 |
| 2013 | US$ −478.453.000.000 | US$ −700.538.000.000 | US$ 272.591.000.000 |
| 2012 | US$ −551.617.000.000 | US$ −741.118.000.000 | US$ 239.395.000.000 |
| 2011 | US$ −579.616.000.000 | US$ −740.997.000.000 | US$ 208.877.000.000 |
| 2010 | US$ −532.308.000.000 | US$ −648.673.000.000 | US$ 165.274.000.000 |
| 2009 | US$ −419.153.000.000 | US$ −509.696.000.000 | US$ 131.965.000.000 |
| 2008 | US$ −740.871.000.000 | US$ −832.492.000.000 | US$ 140.887.000.000 |
| 2007 | US$ −735.933.000.000 | US$ −821.193.000.000 | US$ 126.107.000.000 |
| 2006 | US$ −786.453.000.000 | US$ −837.288.000.000 | US$ 87.750.000.000 |
| 2005 | US$ −739.902.000.000 | US$ −782.805.000.000 | US$ 80.190.000.000 |
| 2004 | US$ −634.141.000.000 | US$ −664.765.000.000 | US$ 67.076.000.000 |
| 2003 | US$ −521.955.000.000 | US$ −541.644.000.000 | US$ 57.286.000.000 |
| 2002 | US$ −439.745.000.000 | US$ −475.246.000.000 | US$ 65.793.000.000 |
| 2001 | US$ −376.747.000.000 | US$ −422.368.000.000 | US$ 77.259.000.000 |
| 2000 | US$ −381.073.000.000 | US$ −446.783.000.000 | US$ 91.772.000.000 |
| 1999 | US$ −259.550.000.000 | US$ −337.067.000.000 | US$ 93.539.000.000 |
| 1998 | US$ −162.711.000.000 | US$ −248.221.000.000 | US$ 82.091.000.000 |
| 1997 | US$ −101.971.000.000 | US$ −198.428.000.000 | US$ 90.140.000.000 |
| 1996 | US$ −96.377.000.000 | US$ −191.000.000.000 | US$ 86.965.000.000 |
| 1995 | US$ −89.762.000.000 | US$ −174.170.000.000 | US$ 77.783.000.000 |
| 1994 | US$ −92.487.000.000 | US$ −165.831.000.000 | US$ 67.320.000.000 |
| 1993 | US$ −65.174.000.000 | US$ −132.451.000.000 | US$ 62.140.000.000 |
| 1992 | US$ −34.738.000.000 | US$ −96.897.000.000 | US$ 57.689.900.000 |
| 1991 | US$ −28.613.000.000 | US$ −76.940.000.000 | US$ 45.760.000.000 |
| 1990 | US$ −77.855.000.000 | US$ −111.042.000.000 | US$ 30.190.000.000 |
| 1989 | US$ −86.741.000.000 | US$ −117.756.000.000 | US$ 24.630.000.000 |
| 1988 | US$ −109.392.000.000 | US$ −126.960.000.000 | US$ 12.300.000.000 |
| 1987 | US$ −144.770.000.000 | US$ −159.551.000.000 | US$ 7.876.000.000 |
| 1986 | US$ −131.869.000.000 | US$ −145.068.000.000 | US$ 6.541.000.000 |
| 1985 | US$ −114.018.000.000 | US$ −122.165.000.000 | US$ 1.063.000.000 |
| 1984 | US$ −102.727.000.000 | US$ −112.481.000.000 | US$ 4.204.000.000 |
| 1983 | US$ −51.642.000.000 | US$ −67.095.000.000 | US$ 9.960.000.000 |
| 1982 | US$ −19.974.000.000 | US$ −36.487.000.000 | US$ 12.950.000.000 |
| 1981 | US$ −12.519.000.000 | US$ −28.050.000.000 | US$ 12.370.000.000 |
| 1980 | US$ −13.056.000.000 | US$ −25.533.000.000 | US$ 6.580.000.000 |
| 1979 | US$ −22.545.000.000 | US$ −27.568.000.000 | US$ 2.601.300.000 |
| 1978 | US$ −25.367.000.000 | US$ −33.927.000.000 | US$ 3.760.000.000 |
| 1977 | US$ −23.094.000.000 | US$ −31.100.000.000 | US$ 3.460.000.000 |
| 1976 | US$ −1.631.000.000 | US$ −9.490.000.000 | US$ 2.670.000.000 |
| 1975 | US$ 15.976.000.000 | US$ 8.910.000.000 | US$ 1.060.000.000 |
| 1974 | US$ −815.000.000 | US$ −5.510.000.000 | US$ −890.000.000 |
| 1973 | US$ 4.110.000.000 | US$ 910.000.000 | US$ −2.050.000.000 |
| 1972 | US$ −3.373.000.000 | US$ −6.420.000.000 | US$ −3.700.000.000 |
| 1971 | US$ 621.000.000 | US$ −2.270.000.000 | US$ −2.770.000.000 |
| 1970 | US$ 3.949.000.000 | US$ 2.590.000.000 | US$ −3.200.000.000 |
| 1969 | US$ 1.429.548.641 | - | - |
| 1968 | US$ 1.347.972.646 | - | - |
| 1967 | US$ 3.550.386.094 | - | - |
| 1966 | US$ 3.858.020.910 | - | - |
| 1965 | US$ 5.604.920.537 | - | - |
| 1964 | US$ 6.900.003.028 | - | - |
| 1963 | US$ 4.928.769.439 | - | - |
| 1962 | US$ 4.093.606.558 | - | - |
| 1961 | US$ 4.907.882.243 | - | - |
| 1960 | US$ 4.200.885.010 | - | - |
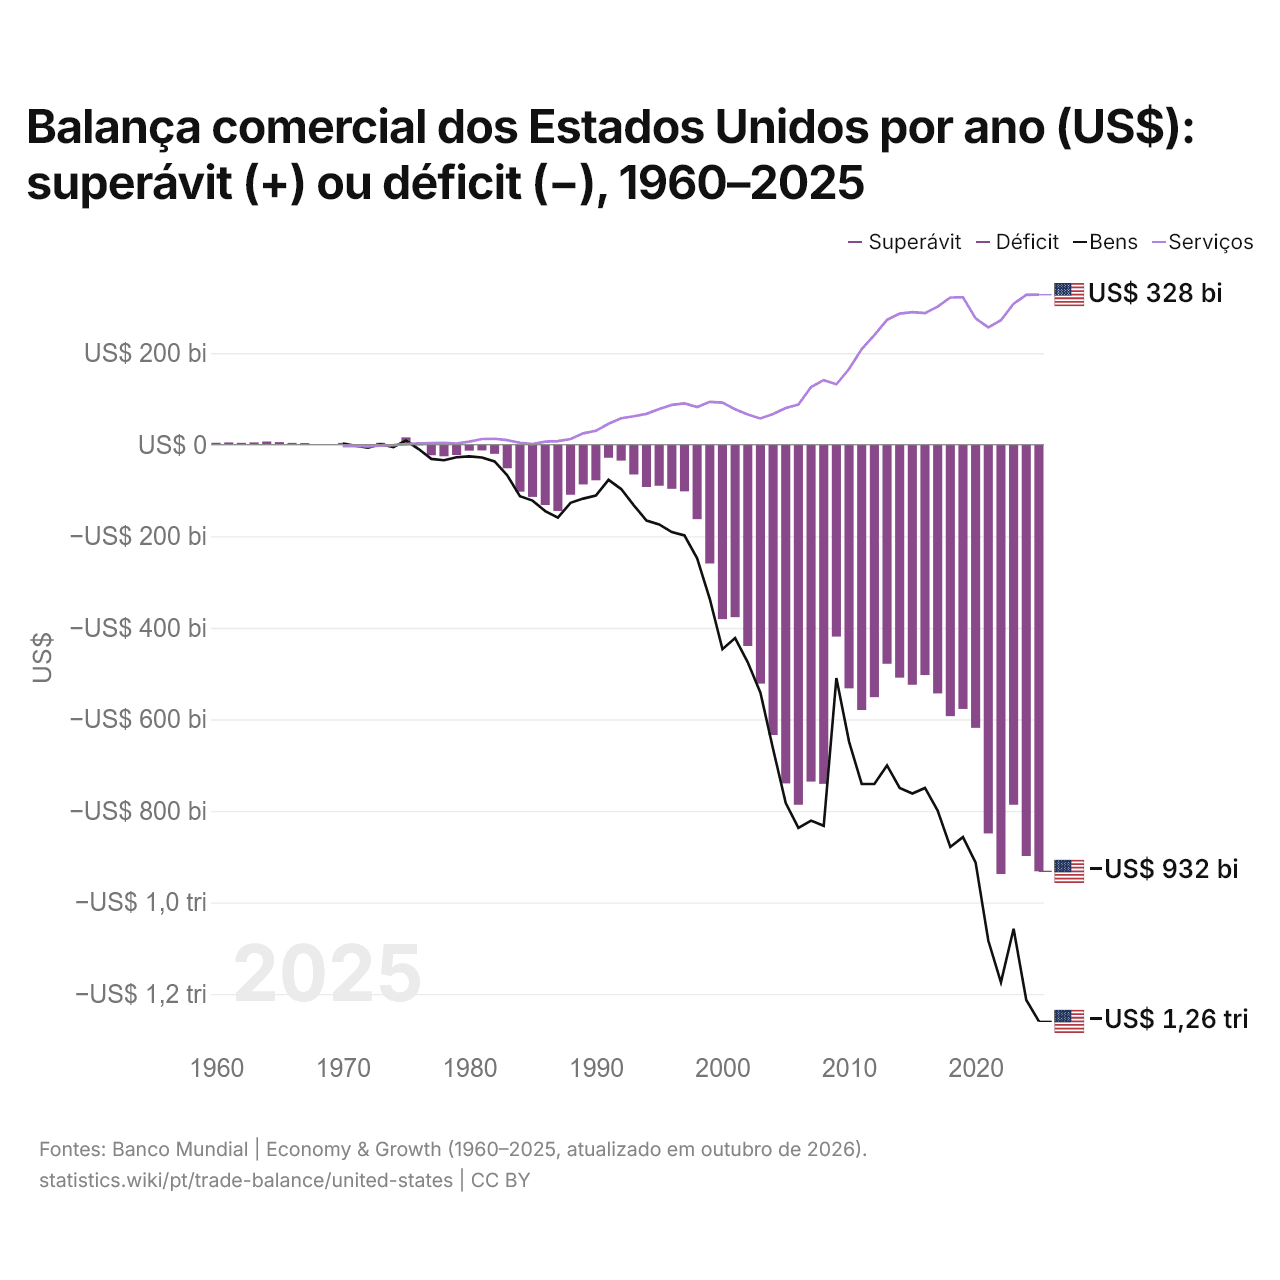
Em 2025, a balança comercial dos Estados Unidos teve um déficit de US$ 932 bilhões, ante um superávit de US$ 4,2 bilhões em 1960. O maior déficit foi de US$ 938 bilhões, em 2022, e o maior superávit, de US$ 16 bilhões, em 1975. A balança comercial dos Estados Unidos teve déficit em todos os anos desde 1976. O comércio de bens teve um déficit de US$ 1,26 trilhão e o de serviços, um superávit de US$ 328 bilhões.
Em 2025, o déficit comercial dos Estados Unidos foi o maior dos dois países da América do Norte, seguido do Canadá (déficit de US$ 19,6 bilhões). De 2016 a 2025, os saldos comerciais dos Estados Unidos somaram um déficit de US$ 7,24 trilhões, ante um déficit de US$ 5,86 trilhões de 2006 a 2015. Em 2025, a conta corrente dos Estados Unidos teve um déficit de 3,8% do PIB.
Comércio de bens dos Estados Unidos com os seus 10 maiores parceiros comerciais, segundo os Estados Unidos, 2025
| País | Exportações para | Importações de | Saldo | |
|---|---|---|---|---|
 México |
US$ 338 bi | US$ 539 bi | -US$ 201 bi | vs México |
 Canadá |
US$ 330 bi | US$ 393 bi | -US$ 63,2 bi | vs Canadá |
 China |
US$ 106 bi | US$ 327 bi | -US$ 221 bi | vs China |
 Alemanha |
US$ 83,1 bi | US$ 159 bi | -US$ 76,1 bi | vs Alemanha |
 Japão |
US$ 82,1 bi | US$ 150 bi | -US$ 67,7 bi | vs Japão |
 Vietnã |
US$ 15,7 bi | US$ 201 bi | -US$ 186 bi | |
 Coreia do Sul |
US$ 68,8 bi | US$ 129 bi | -US$ 60,2 bi | |
 Suíça |
US$ 71,7 bi | US$ 107 bi | -US$ 34,8 bi | vs Suíça |
 Reino Unido |
US$ 97,0 bi | US$ 66,0 bi | +US$ 31,0 bi | vs RU |
 Irlanda |
US$ 19,3 bi | US$ 134 bi | -US$ 115 bi | vs Irlanda |
Balança comercial dos Estados Unidos: superávit (+) ou déficit (−)
| Bens e serviços, US$, 2025 | -US$ 932 bi |
|---|---|
| % do PIB, 2025 | −3,0% |
| Anos com superávit, 2000–2025 | 0 |
| Bens, US$, 2025 | -US$ 1,26 tri |
| Serviços, US$, 2025 | +US$ 328 bi |
| Maior superávit em bens, 2025 | Países Baixos +US$ 59,9 bi |
| Maior déficit em bens, 2025 | China -US$ 221 bi |
Comparar a balança comercial dos Estados Unidos com a de outros países
Fontes:
- TradeMap (2025, atualizado em outubro de 2026)
- Banco Mundial | Economy & Growth (1960–2025, atualizado em outubro de 2026)
Creative Commons Atribuição (CC BY): você pode copiar, compartilhar, adaptar e reutilizar este conteúdo, inclusive para fins comerciais, desde que cite o statistics.wiki e indique as alterações que fizer. As fontes listadas acima podem ter suas próprias condições de licença.