
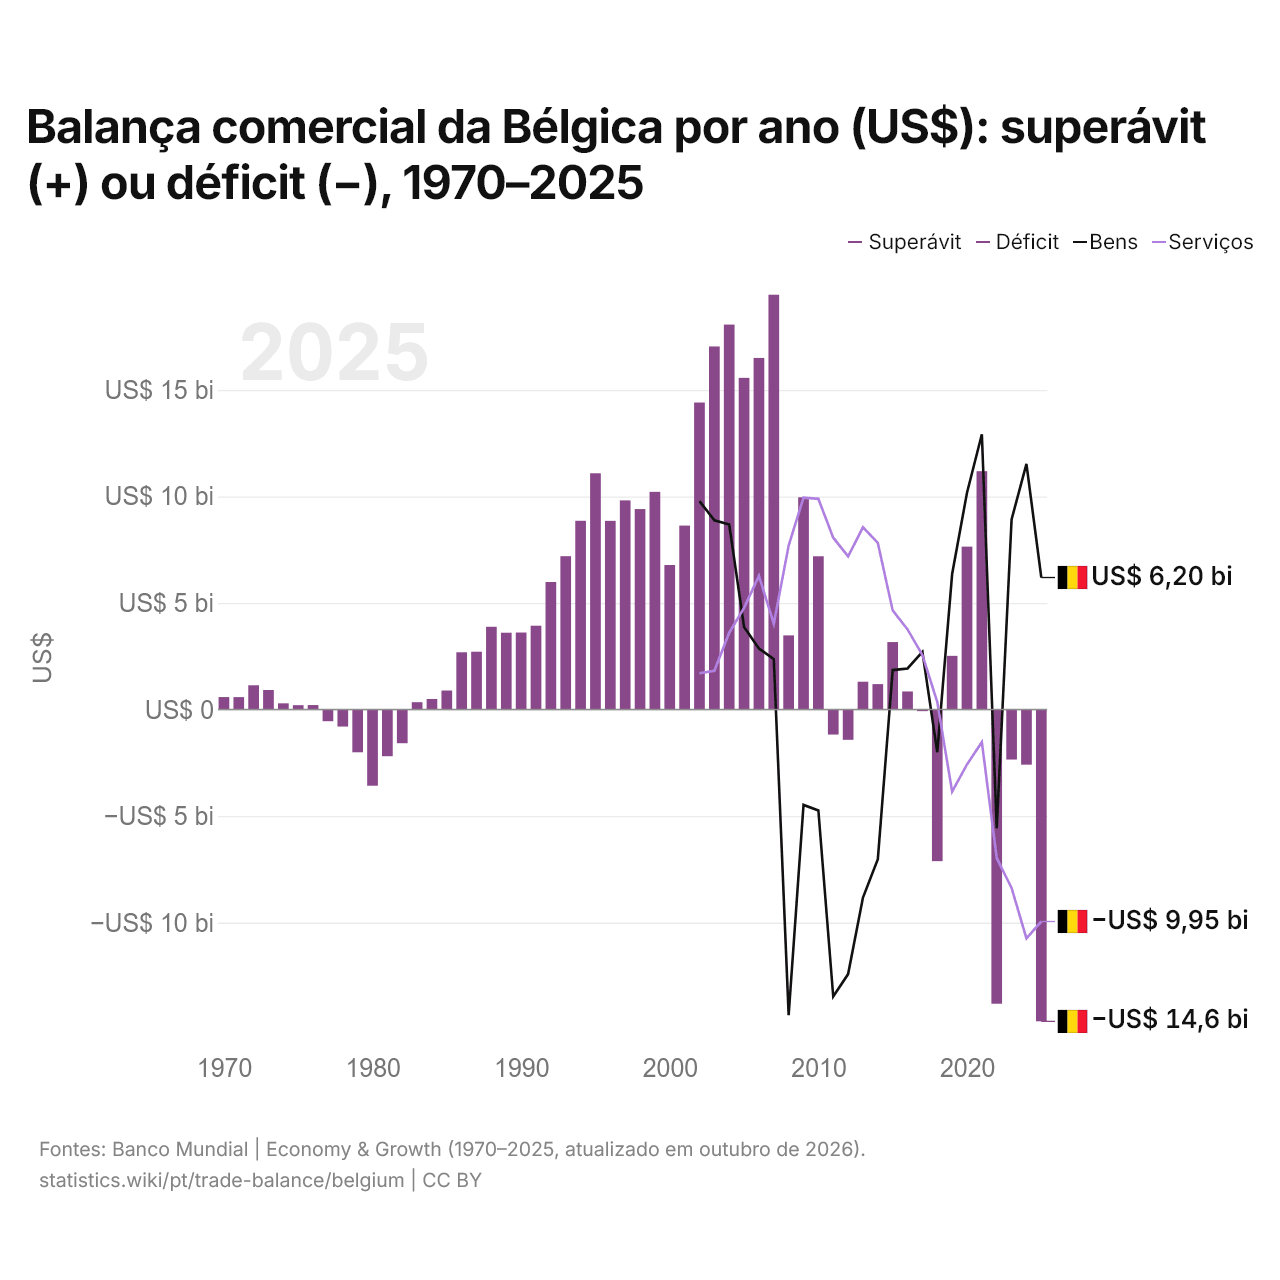
Balança comercial da Bélgica por ano (US$): superávit (+) ou déficit (−), 1970–2025
| Ano | US$ | ||
|---|---|---|---|
| Bens e serviços | Bens | Serviços | |
| 2025 | US$ −14.637.349.567 | US$ 6.195.533.243 | US$ −9.951.950.214 |
| 2024 | US$ −2.589.378.795 | US$ 11.527.608.003 | US$ −10.739.571.835 |
| 2023 | US$ −2.348.299.205 | US$ 8.920.173.996 | US$ −8.374.625.800 |
| 2022 | US$ −13.809.679.840 | US$ −5.572.643.067 | US$ −6.974.875.385 |
| 2021 | US$ 11.185.411.660 | US$ 12.921.332.391 | US$ −1.533.172.485 |
| 2020 | US$ 7.646.774.510 | US$ 10.178.177.663 | US$ −2.576.033.200 |
| 2019 | US$ 2.519.265.437 | US$ 6.359.020.986 | US$ −3.852.478.272 |
| 2018 | US$ −7.117.140.449 | US$ −2.002.945.410 | US$ 352.260.662 |
| 2017 | US$ −76.479.416 | US$ 2.707.034.511 | US$ 2.555.571.444 |
| 2016 | US$ 846.891.572 | US$ 1.924.992.228 | US$ 3.760.025.274 |
| 2015 | US$ 3.166.438.839 | US$ 1.852.275.424 | US$ 4.650.715.479 |
| 2014 | US$ 1.191.266.653 | US$ −7.024.319.068 | US$ 7.819.987.607 |
| 2013 | US$ 1.306.071.280 | US$ −8.825.323.662 | US$ 8.552.440.857 |
| 2012 | US$ −1.422.261.060 | US$ −12.420.649.680 | US$ 7.187.906.656 |
| 2011 | US$ −1.174.531.842 | US$ −13.472.843.925 | US$ 8.065.122.643 |
| 2010 | US$ 7.194.531.778 | US$ −4.737.526.598 | US$ 9.887.155.246 |
| 2009 | US$ 9.960.978.144 | US$ −4.480.280.105 | US$ 9.947.771.174 |
| 2008 | US$ 3.480.542.817 | US$ −14.343.932.785 | US$ 7.693.537.042 |
| 2007 | US$ 19.473.396.555 | US$ 2.360.760.169 | US$ 4.028.669.461 |
| 2006 | US$ 16.503.842.056 | US$ 2.862.528.180 | US$ 6.274.745.775 |
| 2005 | US$ 15.569.789.759 | US$ 3.871.669.288 | US$ 4.768.845.671 |
| 2004 | US$ 18.069.920.173 | US$ 8.682.176.548 | US$ 3.607.114.371 |
| 2003 | US$ 17.041.157.540 | US$ 8.882.371.506 | US$ 1.817.038.306 |
| 2002 | US$ 14.411.205.478 | US$ 9.784.417.108 | US$ 1.701.734.956 |
| 2001 | US$ 8.634.316.460 | - | - |
| 2000 | US$ 6.783.287.644 | - | - |
| 1999 | US$ 10.216.533.029 | - | - |
| 1998 | US$ 9.409.313.181 | - | - |
| 1997 | US$ 9.815.741.994 | - | - |
| 1996 | US$ 8.856.286.645 | - | - |
| 1995 | US$ 11.089.490.969 | - | - |
| 1994 | US$ 8.858.973.957 | - | - |
| 1993 | US$ 7.197.266.791 | - | - |
| 1992 | US$ 5.983.582.183 | - | - |
| 1991 | US$ 3.934.812.758 | - | - |
| 1990 | US$ 3.612.875.423 | - | - |
| 1989 | US$ 3.607.222.563 | - | - |
| 1988 | US$ 3.884.174.438 | - | - |
| 1987 | US$ 2.713.639.114 | - | - |
| 1986 | US$ 2.687.310.818 | - | - |
| 1985 | US$ 890.002.718 | - | - |
| 1984 | US$ 495.069.813 | - | - |
| 1983 | US$ 344.979.882 | - | - |
| 1982 | US$ −1.582.876.567 | - | - |
| 1981 | US$ −2.193.369.187 | - | - |
| 1980 | US$ −3.577.711.408 | - | - |
| 1979 | US$ −2.010.039.901 | - | - |
| 1978 | US$ −799.154.605 | - | - |
| 1977 | US$ −549.247.046 | - | - |
| 1976 | US$ 208.368.861 | - | - |
| 1975 | US$ 202.501.919 | - | - |
| 1974 | US$ 288.928.128 | - | - |
| 1973 | US$ 916.582.488 | - | - |
| 1972 | US$ 1.138.651.819 | - | - |
| 1971 | US$ 581.774.525 | - | - |
| 1970 | US$ 583.597.418 | - | - |
Em 2025, a balança comercial da Bélgica teve um déficit de US$ 14,6 bilhões, ante um superávit de US$ 584 milhões em 1970. O maior superávit foi de US$ 19,5 bilhões, em 2007. A balança comercial da Bélgica teve déficit em todos os anos desde 2022.
Em 2025, o saldo comercial da Bélgica foi o 38º mais alto de 41 países da Europa, onde os saldos iam de um déficit de US$ 56,8 bilhões na Ucrânia a um superávit de US$ 290 bilhões na Irlanda. De 2016 a 2025, os saldos comerciais da Bélgica somaram um déficit de US$ 18,4 bilhões, ante um superávit de US$ 59,7 bilhões de 2006 a 2015. Em 2025, a conta corrente da Bélgica teve um déficit de 0,2% do PIB.
Comércio de bens da Bélgica com os seus 10 maiores parceiros comerciais, segundo a Bélgica, 2025
| País | Exportações para | Importações de | Saldo | |
|---|---|---|---|---|
 Países Baixos |
US$ 73,4 bi | US$ 107 bi | -US$ 33,2 bi | vs Países Baixos |
 Alemanha |
US$ 108 bi | US$ 65,6 bi | +US$ 42,1 bi | vs Alemanha |
 França |
US$ 73,3 bi | US$ 53,9 bi | +US$ 19,4 bi | vs França |
 Estados Unidos |
US$ 36,0 bi | US$ 39,1 bi | -US$ 3,18 bi | vs EUA |
 Itália |
US$ 29,0 bi | US$ 21,2 bi | +US$ 7,78 bi | vs Itália |
 Reino Unido |
US$ 31,4 bi | US$ 15,9 bi | +US$ 15,5 bi | |
 China |
US$ 9,05 bi | US$ 36,4 bi | -US$ 27,3 bi | |
 Espanha |
US$ 21,4 bi | US$ 15,2 bi | +US$ 6,25 bi | vs Espanha |
 Irlanda |
US$ 6,97 bi | US$ 23,6 bi | -US$ 16,6 bi | vs Irlanda |
 Polônia |
US$ 17,3 bi | US$ 8,30 bi | +US$ 9,02 bi | vs Polônia |
Balança comercial da Bélgica: superávit (+) ou déficit (−)
| Bens e serviços, US$, 2025 | -US$ 14,6 bi |
|---|---|
| % do PIB, 2025 | −2,0% |
| Anos com superávit, 2000–2025 | 18 |
| Bens, US$, 2025 | +US$ 6,20 bi |
| Serviços, US$, 2025 | -US$ 9,95 bi |
| Maior superávit em bens, 2025 | Alemanha +US$ 42,1 bi |
| Maior déficit em bens, 2025 | Países Baixos -US$ 33,2 bi |
Comparar a balança comercial da Bélgica com a de outros países
Fontes:
- TradeMap (2025, atualizado em outubro de 2026)
- Banco Mundial | Economy & Growth (1970–2025, atualizado em outubro de 2026)
Creative Commons Atribuição (CC BY): você pode copiar, compartilhar, adaptar e reutilizar este conteúdo, inclusive para fins comerciais, desde que cite o statistics.wiki e indique as alterações que fizer. As fontes listadas acima podem ter suas próprias condições de licença.