
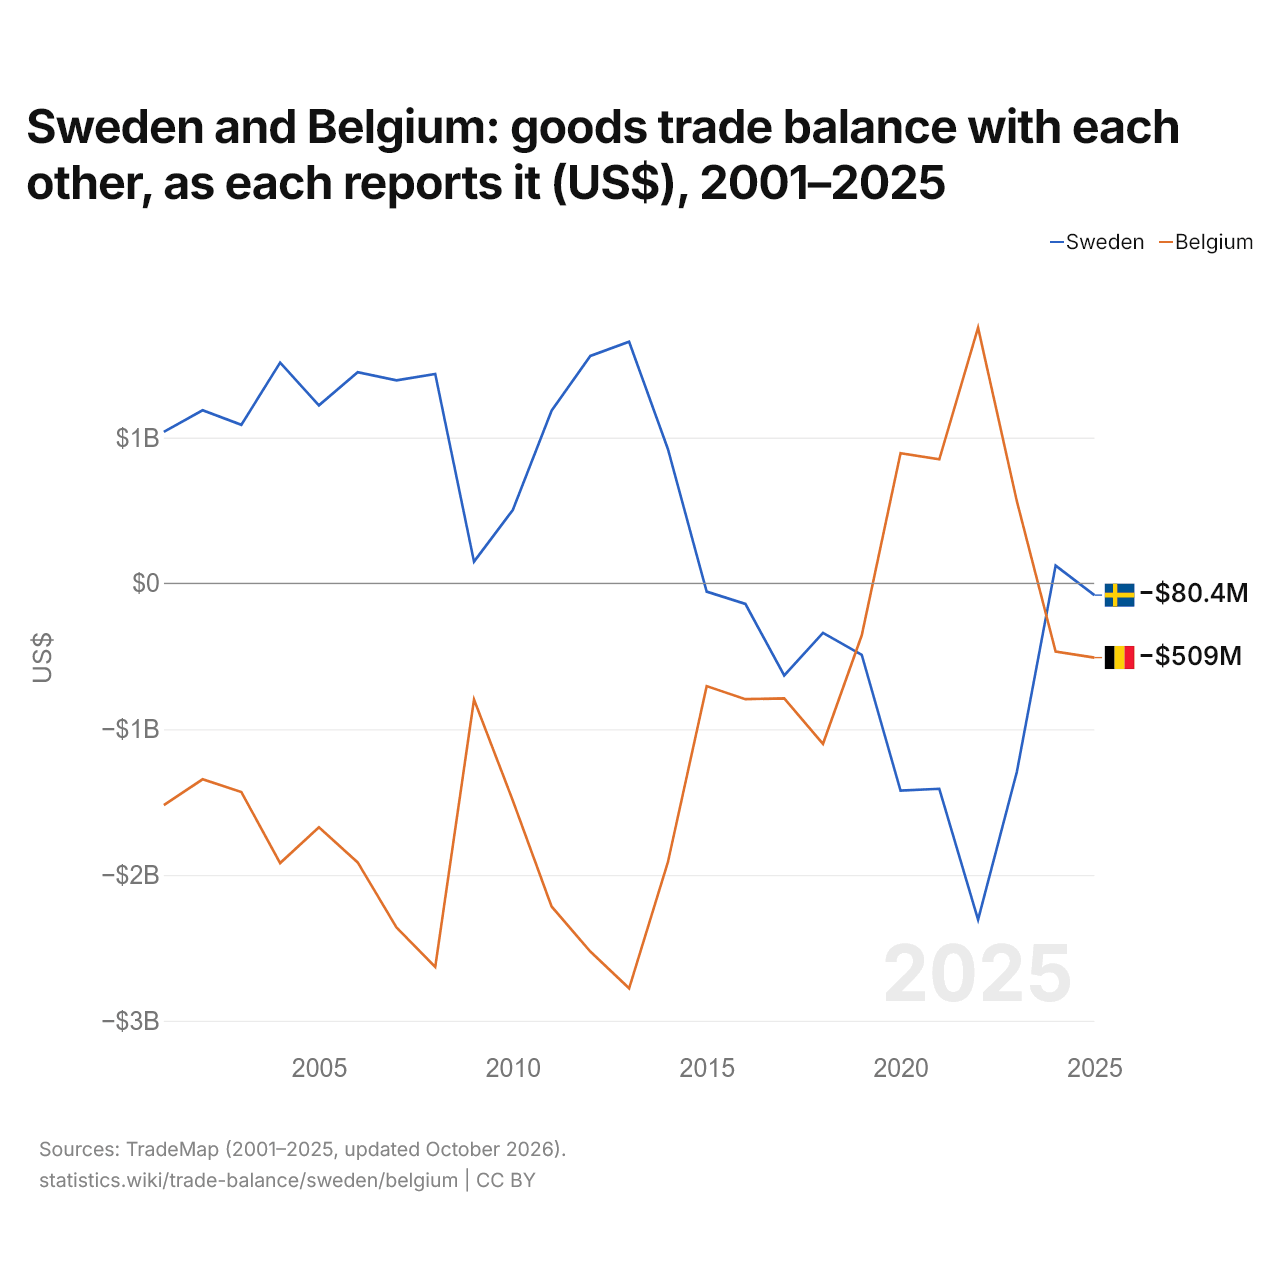
A Suécia e a Bélgica: saldo do comércio de bens entre os dois, segundo cada um (US$), 2001–2025
| Ano | US$ | |
|---|---|---|
| Suécia | Bélgica | |
| 2025 | US$ −80.448.000 | US$ −509.185.000 |
| 2024 | US$ 122.251.000 | US$ −468.191.000 |
| 2023 | US$ −1.293.129.000 | US$ 563.756.000 |
| 2022 | US$ −2.306.968.000 | US$ 1.754.130.000 |
| 2021 | US$ −1.409.116.000 | US$ 851.048.000 |
| 2020 | US$ −1.422.013.000 | US$ 893.169.000 |
| 2019 | US$ −489.998.000 | US$ −356.063.000 |
| 2018 | US$ −339.006.000 | US$ −1.100.812.000 |
| 2017 | US$ −631.949.000 | US$ −788.964.000 |
| 2016 | US$ −141.286.000 | US$ −794.308.000 |
| 2015 | US$ −56.280.000 | US$ −704.681.000 |
| 2014 | US$ 921.929.000 | US$ −1.913.195.000 |
| 2013 | US$ 1.657.788.000 | US$ −2.778.018.000 |
| 2012 | US$ 1.560.614.000 | US$ −2.525.832.000 |
| 2011 | US$ 1.184.579.000 | US$ −2.216.835.000 |
| 2010 | US$ 503.076.000 | US$ −1.489.404.000 |
| 2009 | US$ 148.929.000 | US$ −796.863.000 |
| 2008 | US$ 1.436.699.000 | US$ −2.631.252.000 |
| 2007 | US$ 1.392.815.000 | US$ −2.360.962.000 |
| 2006 | US$ 1.449.139.000 | US$ −1.914.034.000 |
| 2005 | US$ 1.221.139.000 | US$ −1.673.810.000 |
| 2004 | US$ 1.514.853.000 | US$ −1.918.887.000 |
| 2003 | US$ 1.087.633.000 | US$ −1.431.884.000 |
| 2002 | US$ 1.187.398.000 | US$ −1.343.871.000 |
| 2001 | US$ 1.039.114.000 | US$ −1.520.524.000 |
Em 2025, segundo a Suécia, o seu comércio de bens com a Bélgica teve um déficit de US$ 80,4 milhões; segundo a Bélgica, o seu comércio de bens com a Suécia teve um déficit de US$ 509 milhões. Em 2001, os valores foram um superávit de US$ 1,04 bilhão da Suécia e um déficit de US$ 1,52 bilhão da Bélgica.
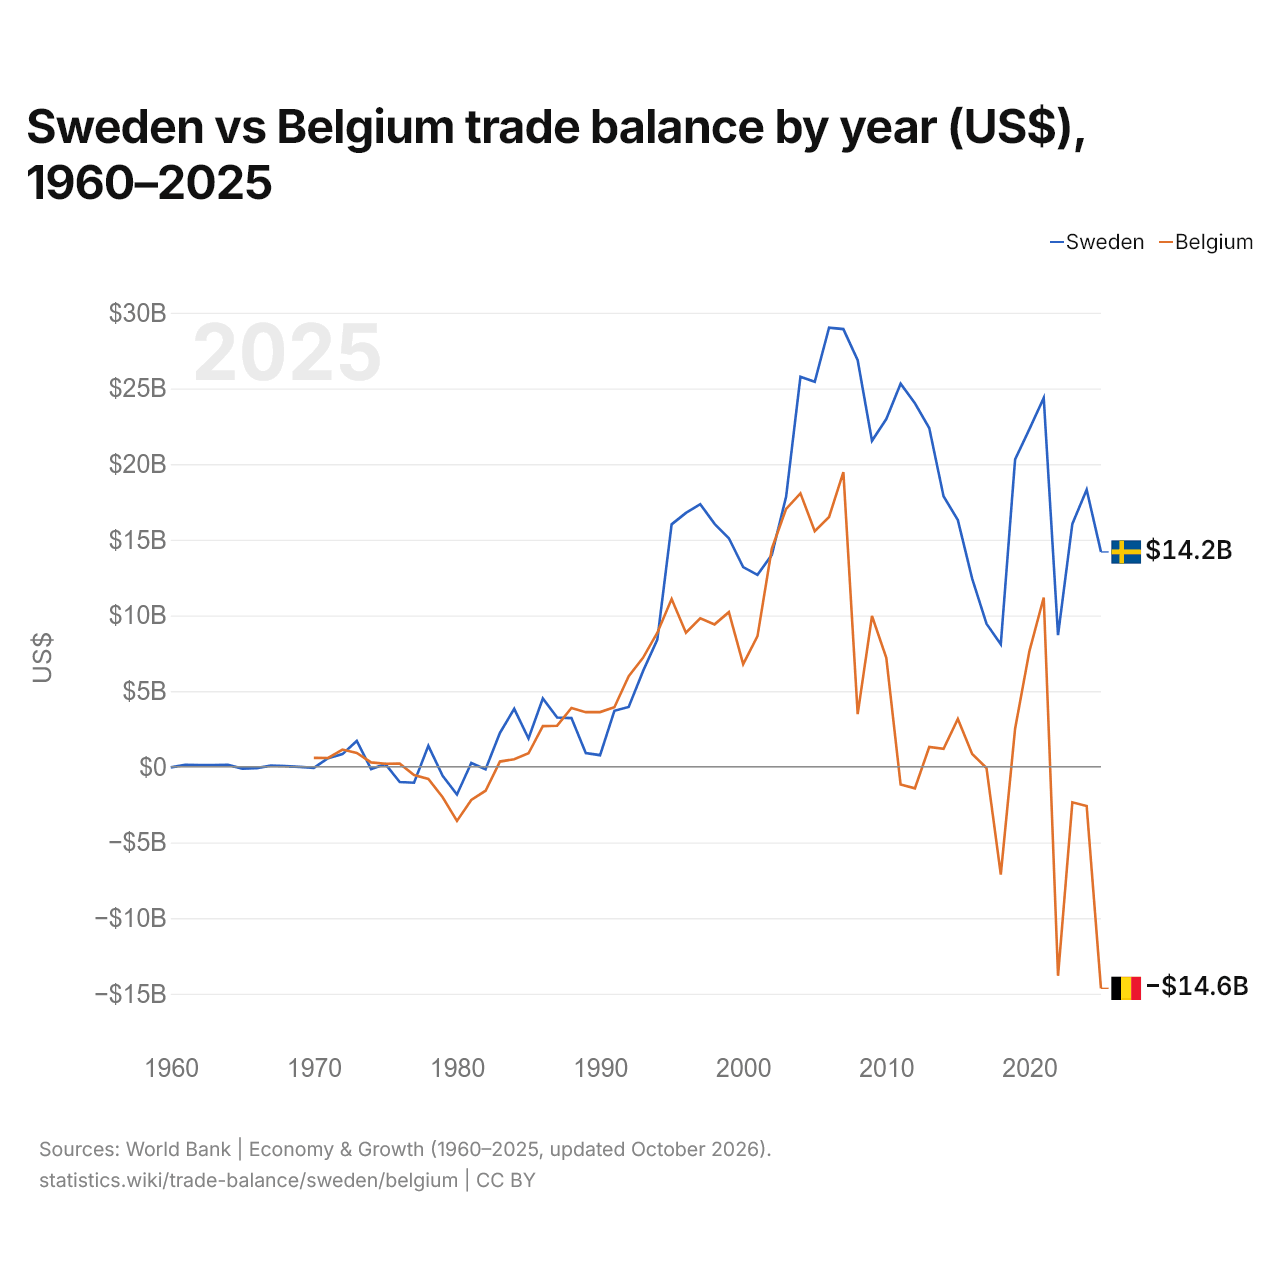
Suécia vs Bélgica: balança comercial por ano (US$), 1960–2025
| Ano | US$ | |
|---|---|---|
 Suécia |
 Bélgica |
|
| 2025 | US$ 14.196.128.478 | US$ −14.637.349.567 |
| 2024 | US$ 18.306.837.219 | US$ −2.589.378.795 |
| 2023 | US$ 16.049.897.380 | US$ −2.348.299.205 |
| 2022 | US$ 8.697.233.002 | US$ −13.809.679.840 |
| 2021 | US$ 24.372.223.399 | US$ 11.185.411.660 |
| 2020 | US$ 22.315.755.027 | US$ 7.646.774.510 |
| 2019 | US$ 20.312.952.780 | US$ 2.519.265.437 |
| 2018 | US$ 8.096.272.829 | US$ −7.117.140.449 |
| 2017 | US$ 9.452.136.557 | US$ −76.479.416 |
| 2016 | US$ 12.432.154.123 | US$ 846.891.572 |
| 2015 | US$ 16.301.315.308 | US$ 3.166.438.839 |
| 2014 | US$ 17.877.691.838 | US$ 1.191.266.653 |
| 2013 | US$ 22.385.421.285 | US$ 1.306.071.280 |
| 2012 | US$ 24.018.541.654 | US$ −1.422.261.060 |
| 2011 | US$ 25.317.610.365 | US$ −1.174.531.842 |
| 2010 | US$ 22.974.879.608 | US$ 7.194.531.778 |
| 2009 | US$ 21.541.587.185 | US$ 9.960.978.144 |
| 2008 | US$ 26.861.980.550 | US$ 3.480.542.817 |
| 2007 | US$ 28.918.299.106 | US$ 19.473.396.555 |
| 2006 | US$ 29.012.631.807 | US$ 16.503.842.056 |
| 2005 | US$ 25.441.383.094 | US$ 15.569.789.759 |
| 2004 | US$ 25.772.156.377 | US$ 18.069.920.173 |
| 2003 | US$ 17.852.664.383 | US$ 17.041.157.540 |
| 2002 | US$ 14.004.991.219 | US$ 14.411.205.478 |
| 2001 | US$ 12.682.227.880 | US$ 8.634.316.460 |
| 2000 | US$ 13.194.320.141 | US$ 6.783.287.644 |
| 1999 | US$ 15.103.238.768 | US$ 10.216.533.029 |
| 1998 | US$ 16.052.151.599 | US$ 9.409.313.181 |
| 1997 | US$ 17.351.373.299 | US$ 9.815.741.994 |
| 1996 | US$ 16.777.214.435 | US$ 8.856.286.645 |
| 1995 | US$ 16.019.373.922 | US$ 11.089.490.969 |
| 1994 | US$ 8.403.317.781 | US$ 8.858.973.957 |
| 1993 | US$ 6.320.502.608 | US$ 7.197.266.791 |
| 1992 | US$ 3.951.423.126 | US$ 5.983.582.183 |
| 1991 | US$ 3.696.628.193 | US$ 3.934.812.758 |
| 1990 | US$ 765.436.406 | US$ 3.612.875.423 |
| 1989 | US$ 900.996.913 | US$ 3.607.222.563 |
| 1988 | US$ 3.219.573.867 | US$ 3.884.174.438 |
| 1987 | US$ 3.256.319.475 | US$ 2.713.639.114 |
| 1986 | US$ 4.508.620.922 | US$ 2.687.310.818 |
| 1985 | US$ 1.866.005.300 | US$ 890.002.718 |
| 1984 | US$ 3.828.967.697 | US$ 495.069.813 |
| 1983 | US$ 2.235.418.607 | US$ 344.979.882 |
| 1982 | US$ −162.813.007 | US$ −1.582.876.567 |
| 1981 | US$ 249.949.836 | US$ −2.193.369.187 |
| 1980 | US$ −1.835.547.570 | US$ −3.577.711.408 |
| 1979 | US$ −592.112.384 | US$ −2.010.039.901 |
| 1978 | US$ 1.384.036.517 | US$ −799.154.605 |
| 1977 | US$ −1.053.723.001 | US$ −549.247.046 |
| 1976 | US$ −1.007.174.637 | US$ 208.368.861 |
| 1975 | US$ 181.173.595 | US$ 202.501.919 |
| 1974 | US$ −154.147.182 | US$ 288.928.128 |
| 1973 | US$ 1.709.666.842 | US$ 916.582.488 |
| 1972 | US$ 834.119.352 | US$ 1.138.651.819 |
| 1971 | US$ 572.532.043 | US$ 581.774.525 |
| 1970 | US$ −66.959.136 | US$ 583.597.418 |
| 1969 | US$ −7.331.231 | - |
| 1968 | US$ 38.934.046 | - |
| 1967 | US$ 72.387.548 | - |
| 1966 | US$ −88.089.598 | - |
| 1965 | US$ −120.298.999 | - |
| 1964 | US$ 120.311.370 | - |
| 1963 | US$ 107.403.524 | - |
| 1962 | US$ 114.250.337 | - |
| 1961 | US$ 127.693.054 | - |
| 1960 | US$ −37.486.009 | - |
Em 2025, a balança comercial da Suécia teve um superávit de US$ 14,2 bilhões e a da Bélgica, um déficit de US$ 14,6 bilhões. Em 1970, a balança comercial da Suécia teve um déficit de US$ 67 milhões e a da Bélgica, um superávit de US$ 584 milhões.
De 1970 a 2025, a balança comercial da Suécia teve superávit em 49 dos 56 anos, e a da Bélgica, em 42. As balanças comerciais da Suécia e da Bélgica tiveram déficit ao mesmo tempo em 4 desses anos, o mais recente em 1982.
Suécia vs Bélgica: dados da balança comercial
|
Suécia
|
Bélgica
|
|
|---|---|---|
| Bens e serviços, US$ | +US$ 14,2 bi (2025) | -US$ 14,6 bi (2025) |
| % do PIB | +2,1% (2025) | −2,0% (2025) |
| Anos com superávit desde 2000 | 26 de 26 | 18 de 26 |
| Saldo de bens entre os dois, dados próprios | -US$ 80,4 mi (2025) | -US$ 509 mi (2025) |
| Maior superávit em bens com | Estados Unidos (+US$ 7,89 bi, 2025) | Alemanha (+US$ 42,1 bi, 2025) |
| Maior déficit em bens com | Países Baixos (-US$ 12,1 bi, 2025) | Países Baixos (-US$ 33,2 bi, 2025) |
Comparar a balança comercial de 2 países quaisquer
Fontes:
- Banco Mundial | Economy & Growth (1960–2025, atualizado em outubro de 2026)
- TradeMap (2001–2025, atualizado em outubro de 2026)
Creative Commons Atribuição (CC BY): você pode copiar, compartilhar, adaptar e reutilizar este conteúdo, inclusive para fins comerciais, desde que cite o statistics.wiki e indique as alterações que fizer. As fontes listadas acima podem ter suas próprias condições de licença.