
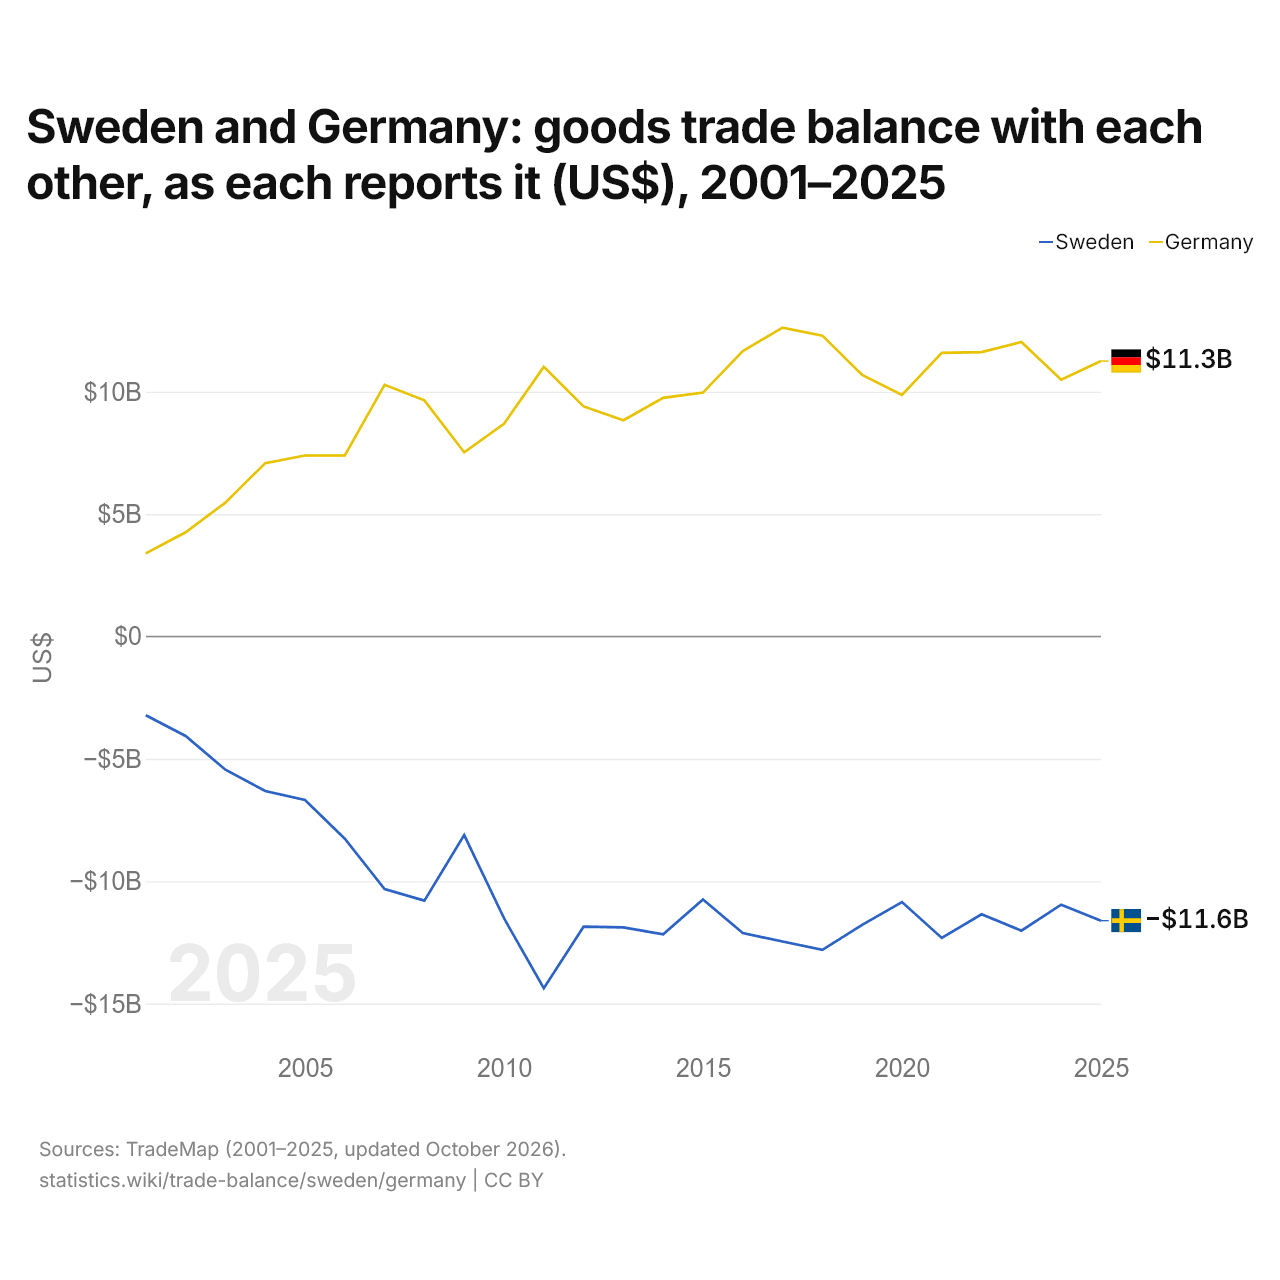
A Suécia e a Alemanha: saldo do comércio de bens entre os dois, segundo cada um (US$), 2001–2025
| Ano | US$ | |
|---|---|---|
| Suécia | Alemanha | |
| 2025 | US$ −11.611.690.000 | US$ 11.253.540.000 |
| 2024 | US$ −10.958.090.000 | US$ 10.493.709.000 |
| 2023 | US$ −12.020.151.000 | US$ 12.030.515.000 |
| 2022 | US$ −11.350.976.000 | US$ 11.619.764.000 |
| 2021 | US$ −12.317.075.000 | US$ 11.588.705.000 |
| 2020 | US$ −10.850.442.000 | US$ 9.869.389.000 |
| 2019 | US$ −11.782.271.000 | US$ 10.685.212.000 |
| 2018 | US$ −12.806.578.000 | US$ 12.293.127.000 |
| 2017 | US$ −12.464.051.000 | US$ 12.617.206.000 |
| 2016 | US$ −12.121.123.000 | US$ 11.666.338.000 |
| 2015 | US$ −10.750.062.000 | US$ 9.965.914.000 |
| 2014 | US$ −12.167.113.000 | US$ 9.750.938.000 |
| 2013 | US$ −11.889.707.000 | US$ 8.835.729.000 |
| 2012 | US$ −11.857.780.000 | US$ 9.400.147.000 |
| 2011 | US$ −14.376.291.000 | US$ 11.017.273.000 |
| 2010 | US$ −11.511.937.000 | US$ 8.693.294.000 |
| 2009 | US$ −8.114.948.000 | US$ 7.527.771.000 |
| 2008 | US$ −10.792.261.000 | US$ 9.648.218.000 |
| 2007 | US$ −10.319.810.000 | US$ 10.282.599.000 |
| 2006 | US$ −8.264.797.000 | US$ 7.401.576.000 |
| 2005 | US$ −6.679.169.000 | US$ 7.393.994.000 |
| 2004 | US$ −6.314.930.000 | US$ 7.082.658.000 |
| 2003 | US$ −5.444.577.000 | US$ 5.470.101.000 |
| 2002 | US$ −4.064.369.000 | US$ 4.258.042.000 |
| 2001 | US$ −3.220.326.000 | US$ 3.394.909.000 |
Em 2025, segundo a Suécia, o seu comércio de bens com a Alemanha teve um déficit de US$ 11,6 bilhões; segundo a Alemanha, o seu comércio de bens com a Suécia teve um superávit de US$ 11,3 bilhões. Em 2001, os valores foram um déficit de US$ 3,22 bilhões da Suécia e um superávit de US$ 3,39 bilhões da Alemanha.
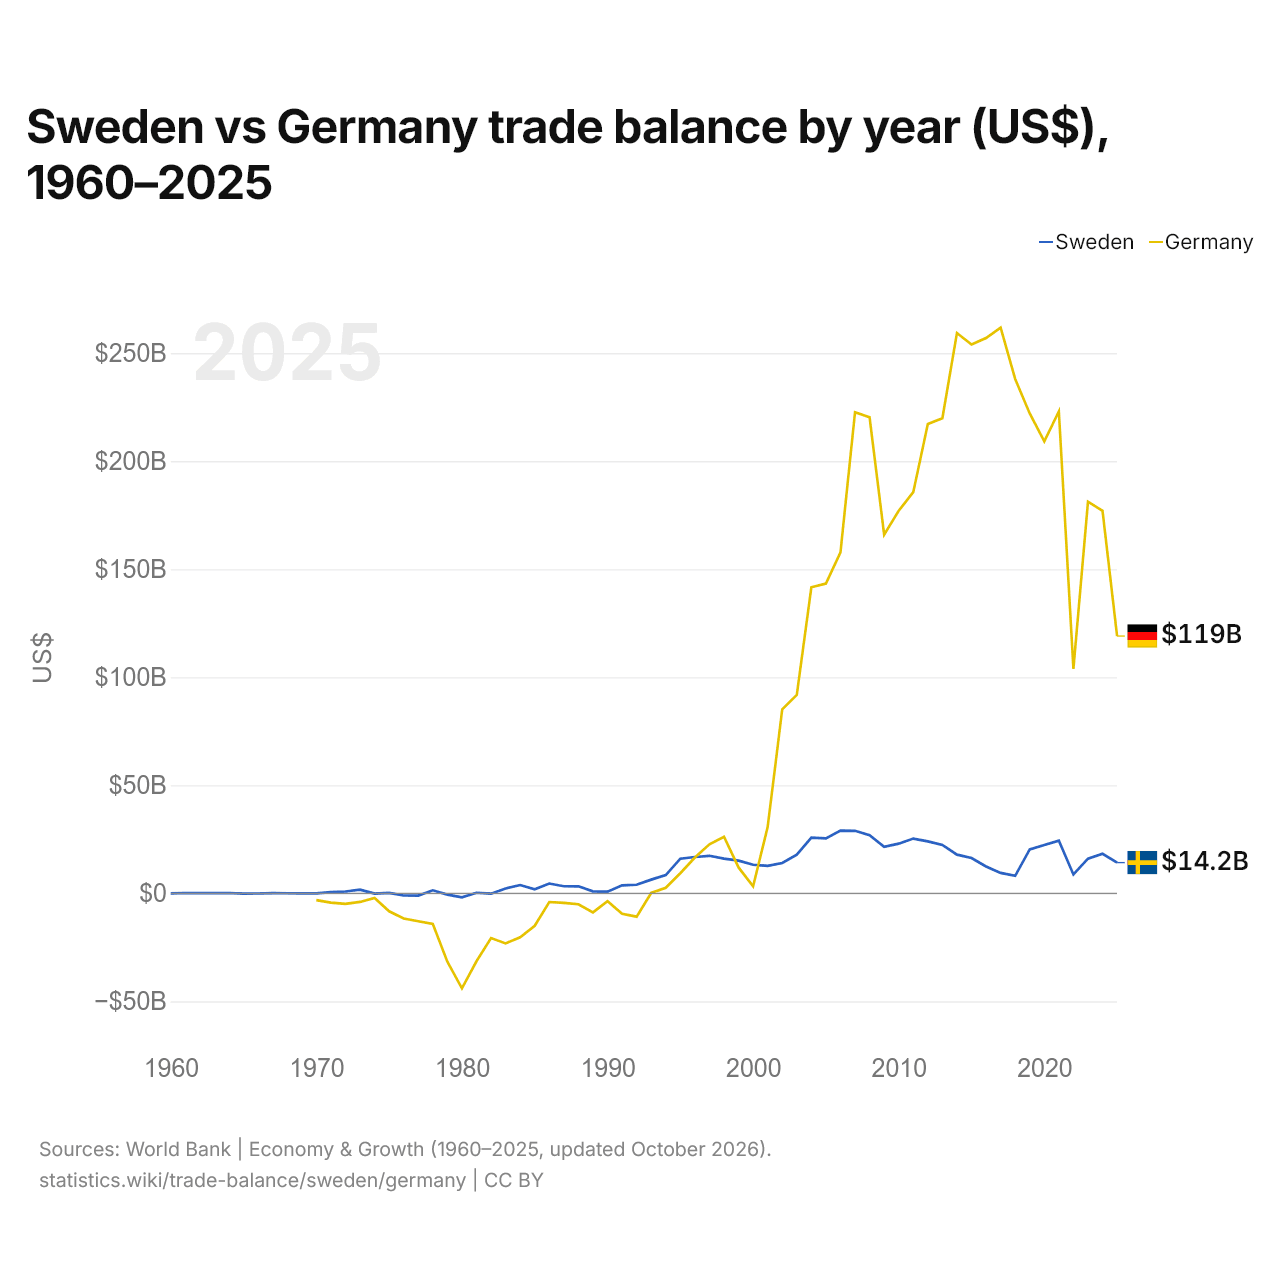
Suécia vs Alemanha: balança comercial por ano (US$), 1960–2025
| Ano | US$ | |
|---|---|---|
 Suécia |
 Alemanha |
|
| 2025 | US$ 14.196.128.478 | US$ 119.036.943.611 |
| 2024 | US$ 18.306.837.219 | US$ 176.993.019.011 |
| 2023 | US$ 16.049.897.380 | US$ 181.209.809.275 |
| 2022 | US$ 8.697.233.002 | US$ 103.809.534.747 |
| 2021 | US$ 24.372.223.399 | US$ 222.995.040.802 |
| 2020 | US$ 22.315.755.027 | US$ 209.133.823.156 |
| 2019 | US$ 20.312.952.780 | US$ 222.041.052.173 |
| 2018 | US$ 8.096.272.829 | US$ 237.995.400.452 |
| 2017 | US$ 9.452.136.557 | US$ 261.732.442.733 |
| 2016 | US$ 12.432.154.123 | US$ 256.950.954.099 |
| 2015 | US$ 16.301.315.308 | US$ 253.944.200.893 |
| 2014 | US$ 17.877.691.838 | US$ 259.262.242.062 |
| 2013 | US$ 22.385.421.285 | US$ 219.838.066.559 |
| 2012 | US$ 24.018.541.654 | US$ 217.210.227.233 |
| 2011 | US$ 25.317.610.365 | US$ 185.606.097.335 |
| 2010 | US$ 22.974.879.608 | US$ 177.011.015.050 |
| 2009 | US$ 21.541.587.185 | US$ 165.923.316.906 |
| 2008 | US$ 26.861.980.550 | US$ 220.288.283.354 |
| 2007 | US$ 28.918.299.106 | US$ 222.623.193.646 |
| 2006 | US$ 29.012.631.807 | US$ 157.789.848.554 |
| 2005 | US$ 25.441.383.094 | US$ 143.315.467.107 |
| 2004 | US$ 25.772.156.377 | US$ 141.587.181.187 |
| 2003 | US$ 17.852.664.383 | US$ 91.785.747.701 |
| 2002 | US$ 14.004.991.219 | US$ 85.110.145.458 |
| 2001 | US$ 12.682.227.880 | US$ 30.705.762.723 |
| 2000 | US$ 13.194.320.141 | US$ 3.259.428.685 |
| 1999 | US$ 15.103.238.768 | US$ 11.966.537.957 |
| 1998 | US$ 16.052.151.599 | US$ 26.183.172.169 |
| 1997 | US$ 17.351.373.299 | US$ 22.686.668.171 |
| 1996 | US$ 16.777.214.435 | US$ 16.562.256.304 |
| 1995 | US$ 16.019.373.922 | US$ 9.254.810.973 |
| 1994 | US$ 8.403.317.781 | US$ 2.562.371.942 |
| 1993 | US$ 6.320.502.608 | US$ 179.817.816 |
| 1992 | US$ 3.951.423.126 | US$ −10.812.773.951 |
| 1991 | US$ 3.696.628.193 | US$ −9.442.545.669 |
| 1990 | US$ 765.436.406 | US$ −3.700.909.091 |
| 1989 | US$ 900.996.913 | US$ −8.860.353.688 |
| 1988 | US$ 3.219.573.867 | US$ −5.073.354.494 |
| 1987 | US$ 3.256.319.475 | US$ −4.398.411.317 |
| 1986 | US$ 4.508.620.922 | US$ −4.040.852.923 |
| 1985 | US$ 1.866.005.300 | US$ −15.052.044.247 |
| 1984 | US$ 3.828.967.697 | US$ −20.362.746.203 |
| 1983 | US$ 2.235.418.607 | US$ −23.185.607.813 |
| 1982 | US$ −162.813.007 | US$ −20.687.120.174 |
| 1981 | US$ 249.949.836 | US$ −31.452.268.282 |
| 1980 | US$ −1.835.547.570 | US$ −43.964.356.574 |
| 1979 | US$ −592.112.384 | US$ −31.634.161.776 |
| 1978 | US$ 1.384.036.517 | US$ −14.221.404.090 |
| 1977 | US$ −1.053.723.001 | US$ −12.957.768.887 |
| 1976 | US$ −1.007.174.637 | US$ −11.645.608.203 |
| 1975 | US$ 181.173.595 | US$ −8.334.008.268 |
| 1974 | US$ −154.147.182 | US$ −2.193.463.835 |
| 1973 | US$ 1.709.666.842 | US$ −4.000.794.731 |
| 1972 | US$ 834.119.352 | US$ −4.909.821.505 |
| 1971 | US$ 572.532.043 | US$ −4.336.130.597 |
| 1970 | US$ −66.959.136 | US$ −3.162.513.226 |
| 1969 | US$ −7.331.231 | - |
| 1968 | US$ 38.934.046 | - |
| 1967 | US$ 72.387.548 | - |
| 1966 | US$ −88.089.598 | - |
| 1965 | US$ −120.298.999 | - |
| 1964 | US$ 120.311.370 | - |
| 1963 | US$ 107.403.524 | - |
| 1962 | US$ 114.250.337 | - |
| 1961 | US$ 127.693.054 | - |
| 1960 | US$ −37.486.009 | - |
Em 2025, a balança comercial da Suécia teve um superávit de US$ 14,2 bilhões e a da Alemanha, um superávit de US$ 119 bilhões; o superávit da Alemanha foi 8,4 vezes maior. Em 1970, a balança comercial da Suécia teve um déficit de US$ 67 milhões e a da Alemanha, um déficit de US$ 3,16 bilhões.
De 1970 a 2025, a balança comercial da Suécia teve superávit em 49 dos 56 anos, e a da Alemanha, em 33. As balanças comerciais da Suécia e da Alemanha tiveram déficit ao mesmo tempo em 7 desses anos, o mais recente em 1982.
Suécia vs Alemanha: dados da balança comercial
|
Suécia
|
Alemanha
|
|
|---|---|---|
| Bens e serviços, US$ | +US$ 14,2 bi (2025) | +US$ 119 bi (2025) |
| % do PIB | +2,1% (2025) | +2,4% (2025) |
| Anos com superávit desde 2000 | 26 de 26 | 26 de 26 |
| Saldo de bens entre os dois, dados próprios | -US$ 11,6 bi (2025) | +US$ 11,3 bi (2025) |
| Maior superávit em bens com | Estados Unidos (+US$ 7,89 bi, 2025) | Estados Unidos (+US$ 62,9 bi, 2025) |
| Maior déficit em bens com | Países Baixos (-US$ 12,1 bi, 2025) | China (-US$ 102 bi, 2025) |
Comparar a balança comercial de 2 países quaisquer
Fontes:
- Banco Mundial | Economy & Growth (1960–2025, atualizado em outubro de 2026)
- TradeMap (2001–2025, atualizado em outubro de 2026)
Creative Commons Atribuição (CC BY): você pode copiar, compartilhar, adaptar e reutilizar este conteúdo, inclusive para fins comerciais, desde que cite o statistics.wiki e indique as alterações que fizer. As fontes listadas acima podem ter suas próprias condições de licença.