
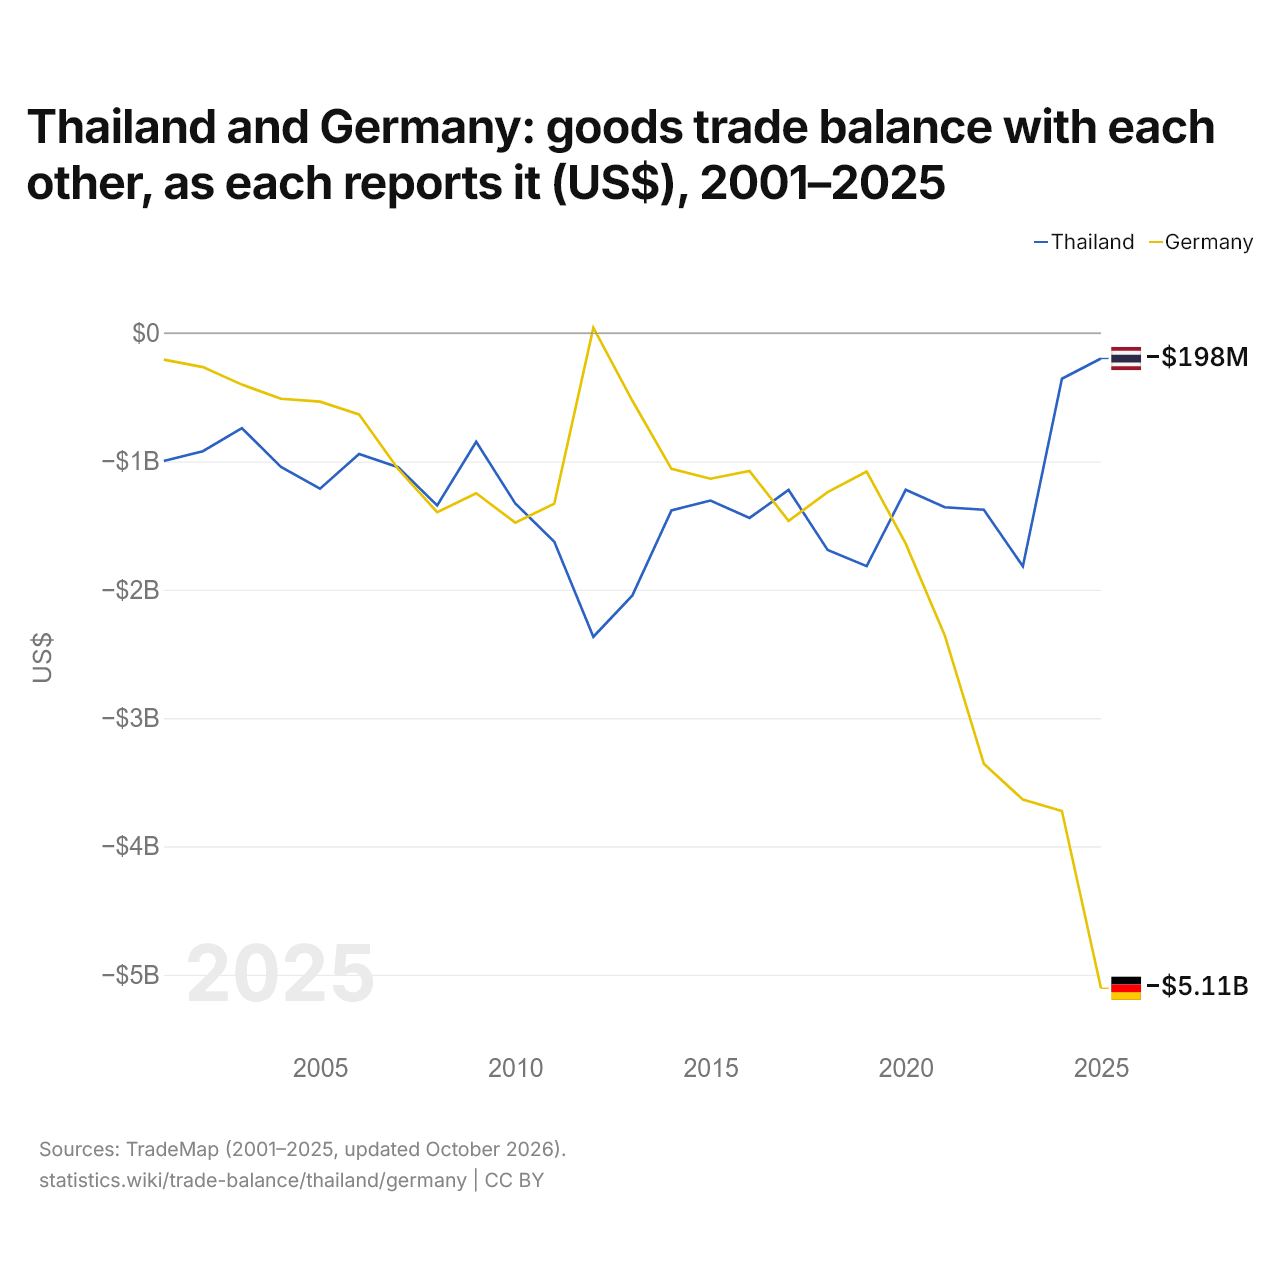
A Tailândia e a Alemanha: saldo do comércio de bens entre os dois, segundo cada um (US$), 2001–2025
| Ano | US$ | |
|---|---|---|
| Tailândia | Alemanha | |
| 2025 | US$ −197.824.000 | US$ −5.106.074.000 |
| 2024 | US$ −355.794.000 | US$ −3.724.562.000 |
| 2023 | US$ −1.817.555.000 | US$ −3.635.628.000 |
| 2022 | US$ −1.376.795.000 | US$ −3.355.706.000 |
| 2021 | US$ −1.357.431.000 | US$ −2.355.883.000 |
| 2020 | US$ −1.221.072.000 | US$ −1.640.583.000 |
| 2019 | US$ −1.816.250.000 | US$ −1.079.446.000 |
| 2018 | US$ −1.690.212.000 | US$ −1.239.141.000 |
| 2017 | US$ −1.222.492.000 | US$ −1.463.720.000 |
| 2016 | US$ −1.440.677.000 | US$ −1.075.166.000 |
| 2015 | US$ −1.304.913.000 | US$ −1.135.117.000 |
| 2014 | US$ −1.381.344.000 | US$ −1.057.916.000 |
| 2013 | US$ −2.044.266.000 | US$ −527.645.000 |
| 2012 | US$ −2.366.714.000 | US$ 41.996.000 |
| 2011 | US$ −1.626.429.000 | US$ −1.329.211.000 |
| 2010 | US$ −1.327.214.000 | US$ −1.477.336.000 |
| 2009 | US$ −846.834.000 | US$ −1.247.965.000 |
| 2008 | US$ −1.342.440.000 | US$ −1.396.156.000 |
| 2007 | US$ −1.045.311.000 | US$ −1.059.281.000 |
| 2006 | US$ −941.940.000 | US$ −634.335.000 |
| 2005 | US$ −1.213.194.000 | US$ −534.613.000 |
| 2004 | US$ −1.043.470.000 | US$ −512.006.000 |
| 2003 | US$ −741.032.000 | US$ −401.638.000 |
| 2002 | US$ −920.890.000 | US$ −265.269.000 |
| 2001 | US$ −996.817.000 | US$ −206.421.000 |
Em 2025, segundo a Tailândia, o seu comércio de bens com a Alemanha teve um déficit de US$ 198 milhões; segundo a Alemanha, o seu comércio de bens com a Tailândia teve um déficit de US$ 5,11 bilhões. Em 2001, os valores foram um déficit de US$ 997 milhões da Tailândia e um déficit de US$ 206 milhões da Alemanha.
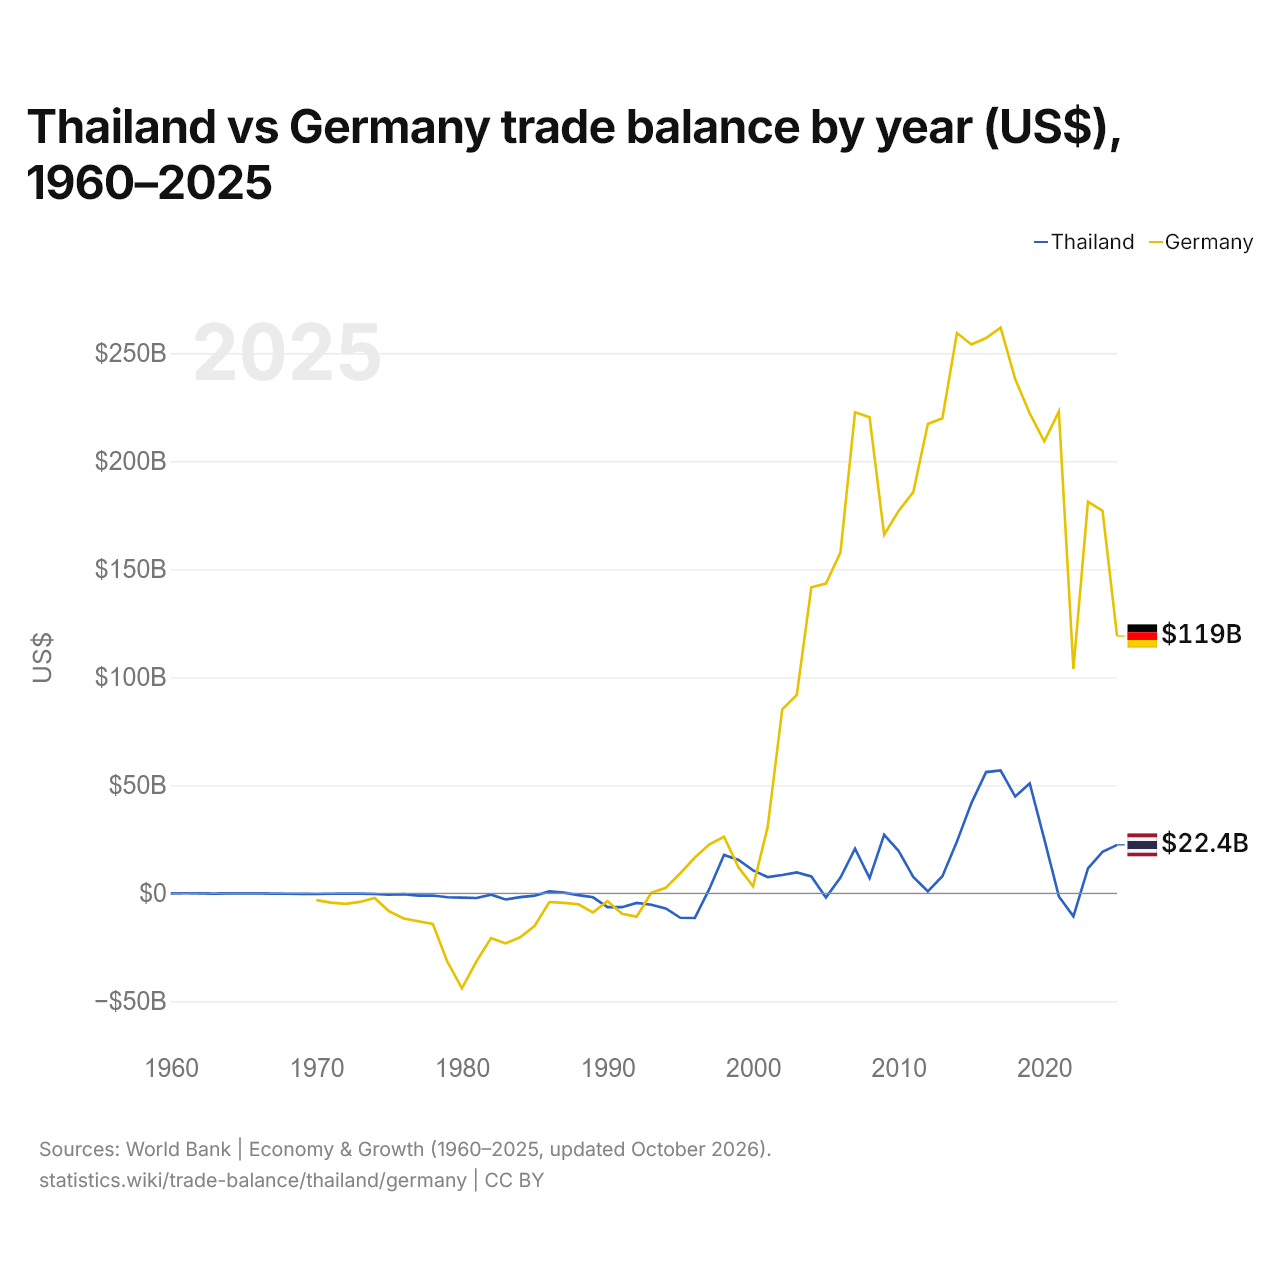
Tailândia vs Alemanha: balança comercial por ano (US$), 1960–2025
| Ano | US$ | |
|---|---|---|
 Tailândia |
 Alemanha |
|
| 2025 | US$ 22.402.465.677 | US$ 119.036.943.611 |
| 2024 | US$ 19.165.463.094 | US$ 176.993.019.011 |
| 2023 | US$ 11.554.301.943 | US$ 181.209.809.275 |
| 2022 | US$ −10.636.527.116 | US$ 103.809.534.747 |
| 2021 | US$ −1.463.735.306 | US$ 222.995.040.802 |
| 2020 | US$ 25.089.768.146 | US$ 209.133.823.156 |
| 2019 | US$ 50.852.391.002 | US$ 222.041.052.173 |
| 2018 | US$ 44.768.334.335 | US$ 237.995.400.452 |
| 2017 | US$ 56.835.761.401 | US$ 261.732.442.733 |
| 2016 | US$ 56.079.513.870 | US$ 256.950.954.099 |
| 2015 | US$ 41.870.119.401 | US$ 253.944.200.893 |
| 2014 | US$ 23.962.838.725 | US$ 259.262.242.062 |
| 2013 | US$ 7.902.306.215 | US$ 219.838.066.559 |
| 2012 | US$ 904.575.388 | US$ 217.210.227.233 |
| 2011 | US$ 7.543.979.216 | US$ 185.606.097.335 |
| 2010 | US$ 19.517.413.294 | US$ 177.011.015.050 |
| 2009 | US$ 27.066.211.193 | US$ 165.923.316.906 |
| 2008 | US$ 6.981.025.387 | US$ 220.288.283.354 |
| 2007 | US$ 20.697.063.962 | US$ 222.623.193.646 |
| 2006 | US$ 7.237.609.499 | US$ 157.789.848.554 |
| 2005 | US$ −1.984.876.727 | US$ 143.315.467.107 |
| 2004 | US$ 7.835.357.474 | US$ 141.587.181.187 |
| 2003 | US$ 9.673.296.490 | US$ 91.785.747.701 |
| 2002 | US$ 8.490.183.783 | US$ 85.110.145.458 |
| 2001 | US$ 7.498.576.473 | US$ 30.705.762.723 |
| 2000 | US$ 10.594.886.498 | US$ 3.259.428.685 |
| 1999 | US$ 15.416.652.651 | US$ 11.966.537.957 |
| 1998 | US$ 17.772.192.804 | US$ 26.183.172.169 |
| 1997 | US$ 2.136.056.834 | US$ 22.686.668.171 |
| 1996 | US$ −11.416.470.782 | US$ 16.562.256.304 |
| 1995 | US$ −11.327.272.984 | US$ 9.254.810.973 |
| 1994 | US$ −6.989.078.945 | US$ 2.562.371.942 |
| 1993 | US$ −5.299.331.021 | US$ 179.817.816 |
| 1992 | US$ −4.468.914.487 | US$ −10.812.773.951 |
| 1991 | US$ −6.427.021.889 | US$ −9.442.545.669 |
| 1990 | US$ −6.416.534.515 | US$ −3.700.909.091 |
| 1989 | US$ −1.852.420.621 | US$ −8.860.353.688 |
| 1988 | US$ −856.887.188 | US$ −5.073.354.494 |
| 1987 | US$ 283.017.445 | US$ −4.398.411.317 |
| 1986 | US$ 876.044.811 | US$ −4.040.852.923 |
| 1985 | US$ −1.061.199.599 | US$ −15.052.044.247 |
| 1984 | US$ −1.783.296.331 | US$ −20.362.746.203 |
| 1983 | US$ −2.867.898.579 | US$ −23.185.607.813 |
| 1982 | US$ −626.605.535 | US$ −20.687.120.174 |
| 1981 | US$ −2.186.206.760 | US$ −31.452.268.282 |
| 1980 | US$ −2.024.090.911 | US$ −43.964.356.574 |
| 1979 | US$ −1.840.938.235 | US$ −31.634.161.776 |
| 1978 | US$ −1.014.894.545 | US$ −14.221.404.090 |
| 1977 | US$ −1.071.906.353 | US$ −12.957.768.887 |
| 1976 | US$ −419.507.686 | US$ −11.645.608.203 |
| 1975 | US$ −686.383.795 | US$ −8.334.008.268 |
| 1974 | US$ −324.268.299 | US$ −2.193.463.835 |
| 1973 | US$ −156.454.352 | US$ −4.000.794.731 |
| 1972 | US$ −81.346.040 | US$ −4.909.821.505 |
| 1971 | US$ −208.269.231 | US$ −4.336.130.597 |
| 1970 | US$ −309.086.538 | US$ −3.162.513.226 |
| 1969 | US$ −267.740.385 | - |
| 1968 | US$ −227.596.154 | - |
| 1967 | US$ −115.576.923 | - |
| 1966 | US$ −17.500.000 | - |
| 1965 | US$ −52.932.692 | - |
| 1964 | US$ −55.240.385 | - |
| 1963 | US$ −114.738.358 | - |
| 1962 | US$ −64.942.529 | - |
| 1961 | US$ 6.838.113 | - |
| 1960 | US$ −35.077.326 | - |
Em 2025, a balança comercial da Tailândia teve um superávit de US$ 22,4 bilhões e a da Alemanha, um superávit de US$ 119 bilhões; o superávit da Alemanha foi 5,3 vezes maior. Em 1970, a balança comercial da Tailândia teve um déficit de US$ 309 milhões e a da Alemanha, um déficit de US$ 3,16 bilhões.
De 1970 a 2025, a balança comercial da Tailândia teve superávit em 28 dos 56 anos, e a da Alemanha, em 33. As balanças comerciais da Tailândia e da Alemanha tiveram déficit ao mesmo tempo em 21 desses anos, o mais recente em 1992.
Tailândia vs Alemanha: dados da balança comercial
|
Tailândia
|
Alemanha
|
|
|---|---|---|
| Bens e serviços, US$ | +US$ 22,4 bi (2025) | +US$ 119 bi (2025) |
| % do PIB | +3,9% (2025) | +2,4% (2025) |
| Anos com superávit desde 2000 | 23 de 26 | 26 de 26 |
| Saldo de bens entre os dois, dados próprios | -US$ 198 mi (2025) | -US$ 5,11 bi (2025) |
| Maior superávit em bens com | Estados Unidos (+US$ 50,6 bi, 2025) | Estados Unidos (+US$ 62,9 bi, 2025) |
| Maior déficit em bens com | China (-US$ 69,2 bi, 2025) | China (-US$ 102 bi, 2025) |
Comparar a balança comercial de 2 países quaisquer
Fontes:
- Banco Mundial | Economy & Growth (1960–2025, atualizado em outubro de 2026)
- TradeMap (2001–2025, atualizado em outubro de 2026)
Creative Commons Atribuição (CC BY): você pode copiar, compartilhar, adaptar e reutilizar este conteúdo, inclusive para fins comerciais, desde que cite o statistics.wiki e indique as alterações que fizer. As fontes listadas acima podem ter suas próprias condições de licença.