
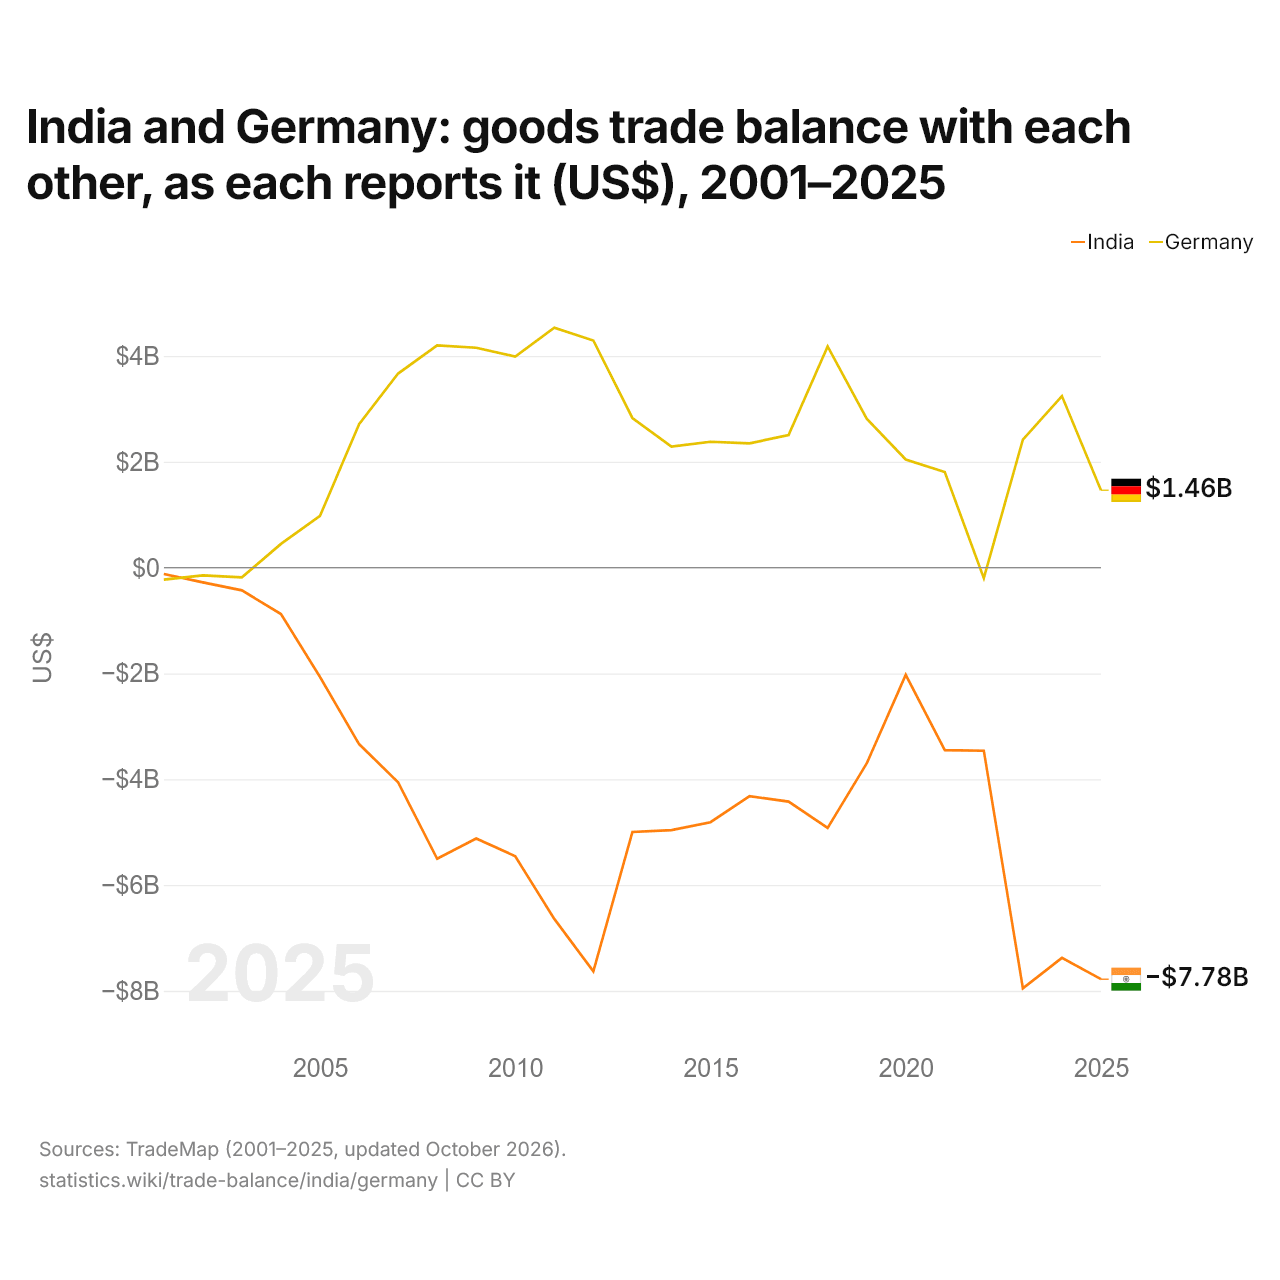
A Índia e a Alemanha: saldo do comércio de bens entre os dois, segundo cada um (US$), 2001–2025
| Ano | US$ | |
|---|---|---|
| Índia | Alemanha | |
| 2025 | US$ −7.779.260.000 | US$ 1.461.852.000 |
| 2024 | US$ −7.376.710.000 | US$ 3.241.805.000 |
| 2023 | US$ −7.951.935.000 | US$ 2.419.585.000 |
| 2022 | US$ −3.461.454.000 | US$ −199.625.000 |
| 2021 | US$ −3.451.637.000 | US$ 1.805.043.000 |
| 2020 | US$ −2.027.444.000 | US$ 2.041.976.000 |
| 2019 | US$ −3.702.718.000 | US$ 2.812.472.000 |
| 2018 | US$ −4.919.232.000 | US$ 4.180.010.000 |
| 2017 | US$ −4.423.553.000 | US$ 2.502.413.000 |
| 2016 | US$ −4.321.579.000 | US$ 2.348.409.000 |
| 2015 | US$ −4.812.919.000 | US$ 2.378.777.000 |
| 2014 | US$ −4.961.618.000 | US$ 2.287.562.000 |
| 2013 | US$ −4.997.946.000 | US$ 2.827.465.000 |
| 2012 | US$ −7.631.897.000 | US$ 4.291.860.000 |
| 2011 | US$ −6.640.776.000 | US$ 4.533.885.000 |
| 2010 | US$ −5.455.165.000 | US$ 3.987.261.000 |
| 2009 | US$ −5.121.123.000 | US$ 4.154.309.000 |
| 2008 | US$ −5.503.407.000 | US$ 4.198.643.000 |
| 2007 | US$ −4.057.666.000 | US$ 3.667.545.000 |
| 2006 | US$ −3.335.781.000 | US$ 2.709.653.000 |
| 2005 | US$ −2.068.649.000 | US$ 976.690.000 |
| 2004 | US$ −877.829.000 | US$ 448.393.000 |
| 2003 | US$ −430.709.000 | US$ −185.424.000 |
| 2002 | US$ −280.561.000 | US$ −146.692.000 |
| 2001 | US$ −121.649.000 | US$ −228.178.000 |
Em 2025, segundo a Índia, o seu comércio de bens com a Alemanha teve um déficit de US$ 7,78 bilhões; segundo a Alemanha, o seu comércio de bens com a Índia teve um superávit de US$ 1,46 bilhão. Em 2001, os valores foram um déficit de US$ 122 milhões da Índia e um déficit de US$ 228 milhões da Alemanha.
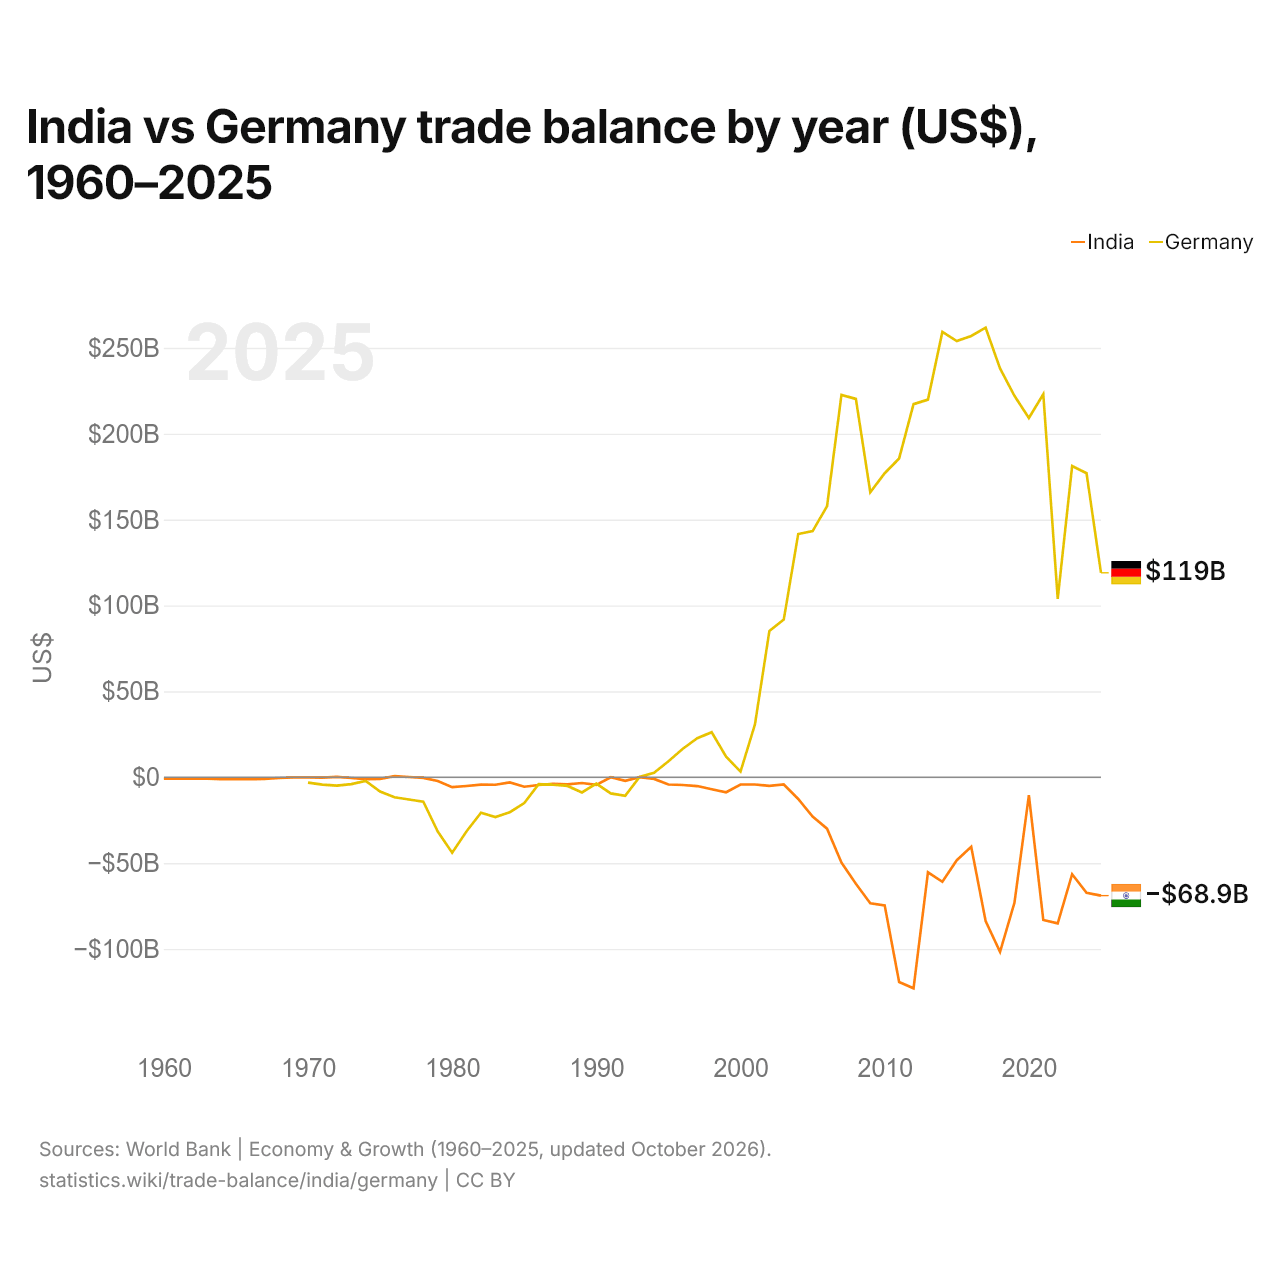
Índia vs Alemanha: balança comercial por ano (US$), 1960–2025
| Ano | US$ | |
|---|---|---|
 Índia |
 Alemanha |
|
| 2025 | US$ −68.919.379.155 | US$ 119.036.943.611 |
| 2024 | US$ −67.270.704.658 | US$ 176.993.019.011 |
| 2023 | US$ −56.481.801.795 | US$ 181.209.809.275 |
| 2022 | US$ −85.070.227.555 | US$ 103.809.534.747 |
| 2021 | US$ −83.133.636.377 | US$ 222.995.040.802 |
| 2020 | US$ −10.516.218.300 | US$ 209.133.823.156 |
| 2019 | US$ −73.069.992.885 | US$ 222.041.052.173 |
| 2018 | US$ −101.665.620.603 | US$ 237.995.400.452 |
| 2017 | US$ −83.759.204.290 | US$ 261.732.442.733 |
| 2016 | US$ −40.526.477.692 | US$ 256.950.954.099 |
| 2015 | US$ −48.309.654.578 | US$ 253.944.200.893 |
| 2014 | US$ −60.893.612.908 | US$ 259.262.242.062 |
| 2013 | US$ −55.375.035.766 | US$ 219.838.066.559 |
| 2012 | US$ −122.906.076.681 | US$ 217.210.227.233 |
| 2011 | US$ −119.283.327.195 | US$ 185.606.097.335 |
| 2010 | US$ −74.620.856.173 | US$ 177.011.015.050 |
| 2009 | US$ −73.425.843.079 | US$ 165.923.316.906 |
| 2008 | US$ −62.024.910.978 | US$ 220.288.283.354 |
| 2007 | US$ −49.726.426.539 | US$ 222.623.193.646 |
| 2006 | US$ −29.981.104.764 | US$ 157.789.848.554 |
| 2005 | US$ −22.898.356.563 | US$ 143.315.467.107 |
| 2004 | US$ −12.662.376.777 | US$ 141.587.181.187 |
| 2003 | US$ −4.233.294.135 | US$ 91.785.747.701 |
| 2002 | US$ −5.045.863.334 | US$ 85.110.145.458 |
| 2001 | US$ −4.254.860.905 | US$ 30.705.762.723 |
| 2000 | US$ −4.245.772.554 | US$ 3.259.428.685 |
| 1999 | US$ −8.770.221.354 | US$ 11.966.537.957 |
| 1998 | US$ −7.005.099.303 | US$ 26.183.172.169 |
| 1997 | US$ −5.148.241.779 | US$ 22.686.668.171 |
| 1996 | US$ −4.554.261.385 | US$ 16.562.256.304 |
| 1995 | US$ −4.249.570.650 | US$ 9.254.810.973 |
| 1994 | US$ −988.286.716 | US$ 2.562.371.942 |
| 1993 | US$ 47.187.344 | US$ 179.817.816 |
| 1992 | US$ −2.153.620.947 | US$ −10.812.773.951 |
| 1991 | US$ 2.039.268 | US$ −9.442.545.669 |
| 1990 | US$ −4.492.297.406 | US$ −3.700.909.091 |
| 1989 | US$ −3.362.657.410 | US$ −8.860.353.688 |
| 1988 | US$ −4.211.604.784 | US$ −5.073.354.494 |
| 1987 | US$ −3.838.531.827 | US$ −4.398.411.317 |
| 1986 | US$ −4.548.547.296 | US$ −4.040.852.923 |
| 1985 | US$ −5.559.179.686 | US$ −15.052.044.247 |
| 1984 | US$ −3.060.529.243 | US$ −20.362.746.203 |
| 1983 | US$ −4.398.713.512 | US$ −23.185.607.813 |
| 1982 | US$ −4.334.108.792 | US$ −20.687.120.174 |
| 1981 | US$ −5.098.906.809 | US$ −31.452.268.282 |
| 1980 | US$ −5.786.386.673 | US$ −43.964.356.574 |
| 1979 | US$ −2.171.813.477 | US$ −31.634.161.776 |
| 1978 | US$ −375.331.507 | US$ −14.221.404.090 |
| 1977 | US$ 143.648.830 | US$ −12.957.768.887 |
| 1976 | US$ 587.355.938 | US$ −11.645.608.203 |
| 1975 | US$ −984.594.448 | US$ −8.334.008.268 |
| 1974 | US$ −1.183.618.321 | US$ −2.193.463.835 |
| 1973 | US$ −440.047.978 | US$ −4.000.794.731 |
| 1972 | US$ 227.671.476 | US$ −4.909.821.505 |
| 1971 | US$ −225.759.297 | US$ −4.336.130.597 |
| 1970 | US$ −60.000.000 | US$ −3.162.513.226 |
| 1969 | US$ −185.333.333 | - |
| 1968 | US$ −480.000.000 | - |
| 1967 | US$ −958.666.667 | - |
| 1966 | US$ −1.152.811.397 | - |
| 1965 | US$ −1.134.001.134 | - |
| 1964 | US$ −1.106.701.107 | - |
| 1963 | US$ −787.500.788 | - |
| 1962 | US$ −785.400.785 | - |
| 1961 | US$ −648.900.649 | - |
| 1960 | US$ −877.800.878 | - |
Em 2025, a balança comercial da Índia teve um déficit de US$ 68,9 bilhões e a da Alemanha, um superávit de US$ 119 bilhões. Em 1970, a balança comercial da Índia teve um déficit de US$ 60 milhões e a da Alemanha, um déficit de US$ 3,16 bilhões.
De 1970 a 2025, a balança comercial da Índia teve superávit em 5 dos 56 anos, e a da Alemanha, em 33. As balanças comerciais da Índia e da Alemanha tiveram déficit ao mesmo tempo em 19 desses anos, o mais recente em 1992.
Índia vs Alemanha: dados da balança comercial
|
Índia
|
Alemanha
|
|
|---|---|---|
| Bens e serviços, US$ | -US$ 68,9 bi (2025) | +US$ 119 bi (2025) |
| % do PIB | −1,7% (2025) | +2,4% (2025) |
| Anos com superávit desde 2000 | 0 de 26 | 26 de 26 |
| Saldo de bens entre os dois, dados próprios | -US$ 7,78 bi (2025) | +US$ 1,46 bi (2025) |
| Maior superávit em bens com | Estados Unidos (+US$ 42,9 bi, 2025) | Estados Unidos (+US$ 62,9 bi, 2025) |
| Maior déficit em bens com | China (-US$ 107 bi, 2025) | China (-US$ 102 bi, 2025) |
Comparar a balança comercial de 2 países quaisquer
Fontes:
- Banco Mundial | Economy & Growth (1960–2025, atualizado em outubro de 2026)
- TradeMap (2001–2025, atualizado em outubro de 2026)
Creative Commons Atribuição (CC BY): você pode copiar, compartilhar, adaptar e reutilizar este conteúdo, inclusive para fins comerciais, desde que cite o statistics.wiki e indique as alterações que fizer. As fontes listadas acima podem ter suas próprias condições de licença.