
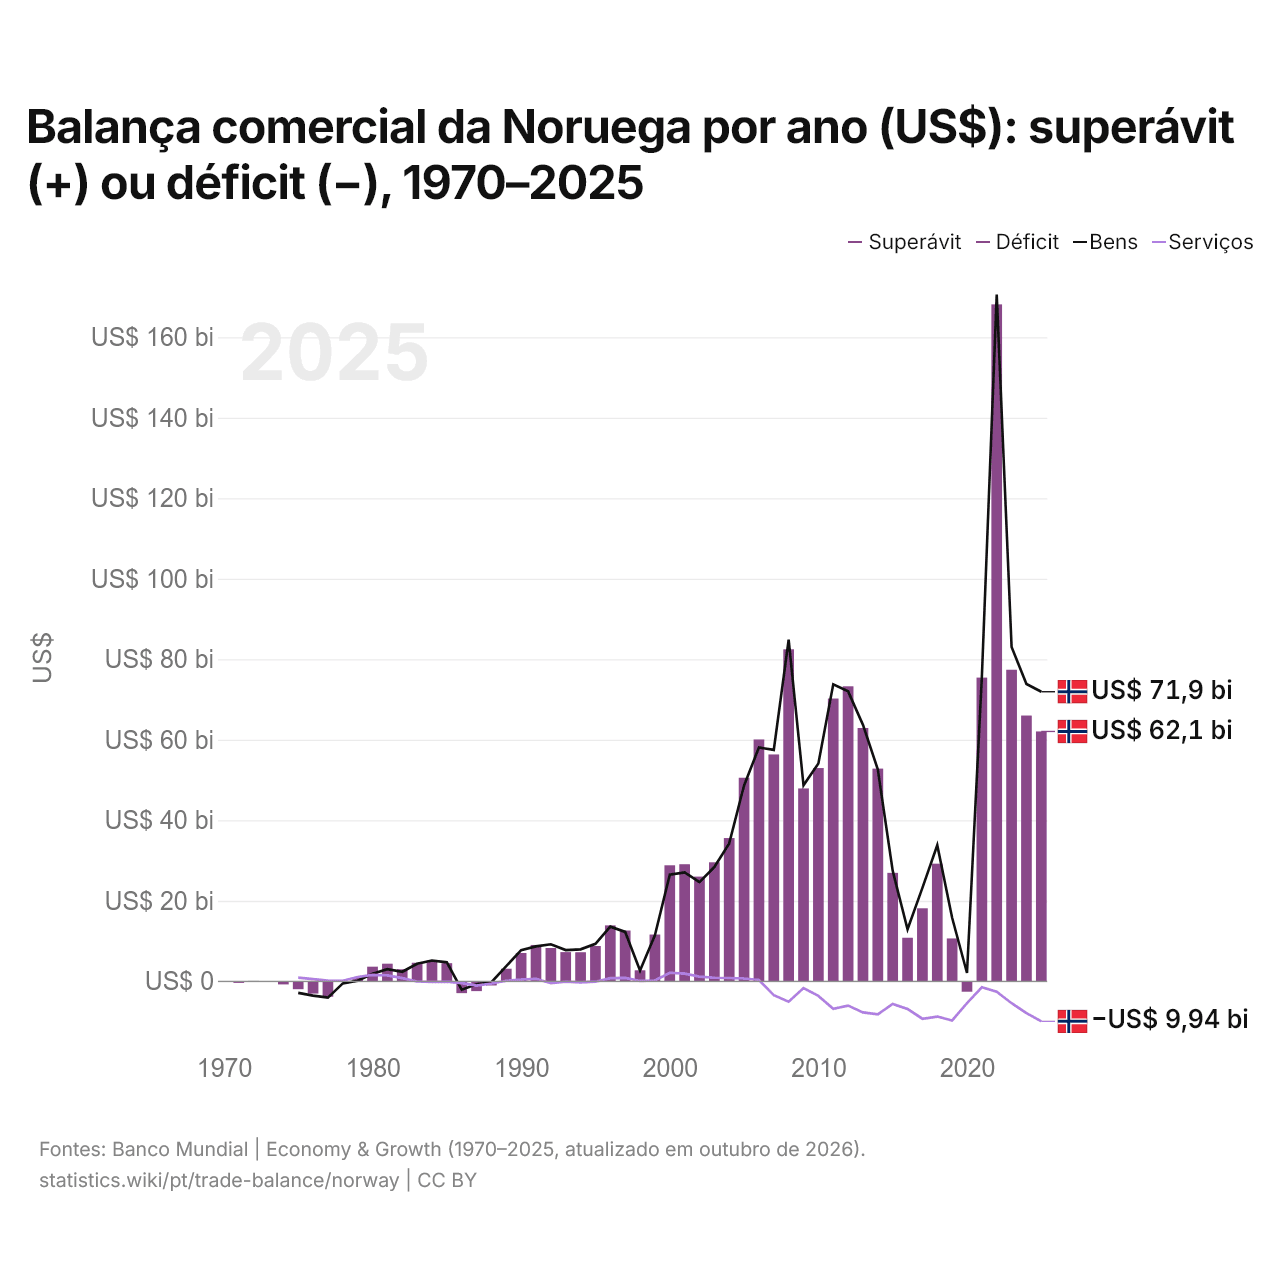
Balança comercial da Noruega por ano (US$): superávit (+) ou déficit (−), 1970–2025
| Ano | US$ | ||
|---|---|---|---|
| Bens e serviços | Bens | Serviços | |
| 2025 | US$ 62.061.691.383 | US$ 71.924.651.999 | US$ −9.936.825.517 |
| 2024 | US$ 66.013.586.661 | US$ 73.867.691.196 | US$ −7.882.780.064 |
| 2023 | US$ 77.382.297.255 | US$ 83.027.837.924 | US$ −5.443.009.903 |
| 2022 | US$ 168.143.018.116 | US$ 170.546.211.079 | US$ −2.587.588.062 |
| 2021 | US$ 75.439.464.494 | US$ 75.600.404.617 | US$ −1.464.878.438 |
| 2020 | US$ −2.578.741.482 | US$ 2.065.166.466 | US$ −5.413.376.323 |
| 2019 | US$ 10.647.954.545 | US$ 15.789.156.180 | US$ −9.719.810.018 |
| 2018 | US$ 29.218.444.513 | US$ 33.816.312.281 | US$ −8.750.828.427 |
| 2017 | US$ 18.141.084.022 | US$ 23.202.559.416 | US$ −9.292.475.838 |
| 2016 | US$ 10.825.238.095 | US$ 12.920.268.386 | US$ −6.884.236.505 |
| 2015 | US$ 26.940.911.439 | US$ 27.485.551.207 | US$ −5.621.898.836 |
| 2014 | US$ 52.830.150.754 | US$ 52.620.068.476 | US$ −8.185.489.400 |
| 2013 | US$ 62.911.659.574 | US$ 63.703.575.854 | US$ −7.718.238.586 |
| 2012 | US$ 73.268.414.267 | US$ 72.026.316.643 | US$ −6.026.634.814 |
| 2011 | US$ 70.243.279.940 | US$ 73.763.055.993 | US$ −6.815.726.109 |
| 2010 | US$ 52.975.375.707 | US$ 54.080.788.160 | US$ −3.619.856.190 |
| 2009 | US$ 47.919.469.491 | US$ 48.685.685.219 | US$ −1.675.860.474 |
| 2008 | US$ 82.461.347.518 | US$ 84.838.130.344 | US$ −5.067.627.615 |
| 2007 | US$ 56.360.441.510 | US$ 57.487.715.907 | US$ −3.436.457.205 |
| 2006 | US$ 60.084.200.022 | US$ 58.076.486.289 | US$ 336.250.673 |
| 2005 | US$ 50.560.962.359 | US$ 48.640.731.742 | US$ 705.866.867 |
| 2004 | US$ 35.586.725.611 | US$ 34.256.168.917 | US$ 831.869.740 |
| 2003 | US$ 29.572.328.465 | US$ 28.375.520.270 | US$ 880.908.463 |
| 2002 | US$ 26.020.691.901 | US$ 24.645.541.965 | US$ 1.161.574.218 |
| 2001 | US$ 29.081.152.619 | US$ 27.035.267.065 | US$ 1.923.881.597 |
| 2000 | US$ 28.816.037.629 | US$ 26.509.045.411 | US$ 2.125.706.655 |
| 1999 | US$ 11.622.217.663 | US$ 11.424.020.176 | US$ 204.186.966 |
| 1998 | US$ 2.735.020.079 | US$ 2.691.964.684 | US$ 91.464.317 |
| 1997 | US$ 12.625.045.947 | US$ 12.278.837.576 | US$ 844.107.212 |
| 1996 | US$ 13.902.136.500 | US$ 13.577.328.140 | US$ 778.834.353 |
| 1995 | US$ 8.768.468.241 | US$ 9.305.089.511 | US$ −94.861.615 |
| 1994 | US$ 7.225.260.712 | US$ 7.945.533.013 | US$ −267.620.293 |
| 1993 | US$ 7.246.303.266 | US$ 7.756.413.607 | US$ −103.465.835 |
| 1992 | US$ 8.279.990.345 | US$ 9.207.175.529 | US$ −471.638.846 |
| 1991 | US$ 9.038.701.816 | US$ 8.677.534.165 | US$ 621.707.183 |
| 1990 | US$ 7.042.669.777 | US$ 7.755.436.902 | US$ 403.702.303 |
| 1989 | US$ 3.130.277.355 | US$ 3.771.176.343 | US$ 146.085.427 |
| 1988 | US$ −1.028.080.405 | US$ −202.796.842 | US$ −541.805.380 |
| 1987 | US$ −2.431.762.523 | US$ −751.733.317 | US$ −1.076.727.898 |
| 1986 | US$ −2.930.747.698 | US$ −2.085.108.355 | US$ −461.055.025 |
| 1985 | US$ 4.513.097.287 | US$ 4.722.842.643 | US$ −62.528.060 |
| 1984 | US$ 5.246.707.100 | US$ 5.160.758.403 | US$ −157.155.457 |
| 1983 | US$ 4.617.345.540 | US$ 4.349.671.671 | US$ −38.581.027 |
| 1982 | US$ 2.993.027.580 | US$ 2.370.389.166 | US$ 794.869.778 |
| 1981 | US$ 4.377.559.021 | US$ 3.034.820.941 | US$ 1.469.072.059 |
| 1980 | US$ 3.645.124.717 | US$ 1.896.360.582 | US$ 1.619.232.352 |
| 1979 | US$ 1.063.565.095 | US$ 146.111.512 | US$ 1.076.966.569 |
| 1978 | US$ 16.595.769 | US$ −512.341.877 | US$ 145.778.460 |
| 1977 | US$ −3.826.993.519 | US$ −4.052.885.007 | US$ 190.406.584 |
| 1976 | US$ −3.050.673.509 | US$ −3.561.189.380 | US$ 551.248.925 |
| 1975 | US$ −1.950.869.540 | US$ −2.870.998.898 | US$ 901.591.137 |
| 1974 | US$ −773.327.075 | - | - |
| 1973 | US$ −118.457.109 | - | - |
| 1972 | US$ 111.107.738 | - | - |
| 1971 | US$ −387.902.323 | - | - |
| 1970 | US$ −92.959.442 | - | - |
Em 2025, a balança comercial da Noruega teve um superávit de US$ 62,1 bilhões, ante um déficit de US$ 93 milhões em 1970. O maior déficit foi de US$ 3,83 bilhões, em 1977, e o maior superávit, de US$ 168 bilhões, em 2022. A balança comercial da Noruega teve superávit em todos os anos desde 2021. O comércio de bens teve um superávit de US$ 71,9 bilhões e o de serviços, um déficit de US$ 9,94 bilhões.
Em 2025, o saldo comercial da Noruega foi o 7º mais alto de 41 países da Europa, onde os saldos iam de um déficit de US$ 56,8 bilhões na Ucrânia a um superávit de US$ 290 bilhões na Irlanda. De 2016 a 2025, os saldos comerciais da Noruega somaram um superávit de US$ 515 bilhões, ante um superávit de US$ 586 bilhões de 2006 a 2015. Em 2025, a conta corrente da Noruega teve um superávit de 14,1% do PIB.
Comércio de bens da Noruega com os seus 10 maiores parceiros comerciais, segundo a Noruega, 2025
| País | Exportações para | Importações de | Saldo | |
|---|---|---|---|---|
 Alemanha |
US$ 29,9 bi | US$ 12,6 bi | +US$ 17,3 bi | vs Alemanha |
 Reino Unido |
US$ 30,1 bi | US$ 4,37 bi | +US$ 25,7 bi | vs RU |
 Suécia |
US$ 11,1 bi | US$ 10,7 bi | +US$ 425 mi | vs Suécia |
 Países Baixos |
US$ 16,7 bi | US$ 4,42 bi | +US$ 12,3 bi | vs Países Baixos |
 China |
US$ 4,68 bi | US$ 12,8 bi | -US$ 8,09 bi | |
 Polônia |
US$ 10,1 bi | US$ 4,23 bi | +US$ 5,86 bi | vs Polônia |
 Estados Unidos |
US$ 6,60 bi | US$ 7,59 bi | -US$ 990 mi | vs EUA |
 Dinamarca |
US$ 9,66 bi | US$ 4,50 bi | +US$ 5,16 bi | vs Dinamarca |
 França |
US$ 9,89 bi | US$ 3,12 bi | +US$ 6,77 bi | vs França |
 Bélgica |
US$ 8,68 bi | US$ 2,17 bi | +US$ 6,51 bi |
Balança comercial da Noruega: superávit (+) ou déficit (−)
| Bens e serviços, US$, 2025 | +US$ 62,1 bi |
|---|---|
| % do PIB, 2025 | +11,7% |
| Anos com superávit, 2000–2025 | 25 |
| Bens, US$, 2025 | +US$ 71,9 bi |
| Serviços, US$, 2025 | -US$ 9,94 bi |
| Maior superávit em bens, 2025 | Reino Unido +US$ 25,7 bi |
| Maior déficit em bens, 2025 | China -US$ 8,09 bi |
Comparar a balança comercial da Noruega com a de outros países
Fontes:
- TradeMap (2025, atualizado em outubro de 2026)
- Banco Mundial | Economy & Growth (1970–2025, atualizado em outubro de 2026)
Creative Commons Atribuição (CC BY): você pode copiar, compartilhar, adaptar e reutilizar este conteúdo, inclusive para fins comerciais, desde que cite o statistics.wiki e indique as alterações que fizer. As fontes listadas acima podem ter suas próprias condições de licença.