
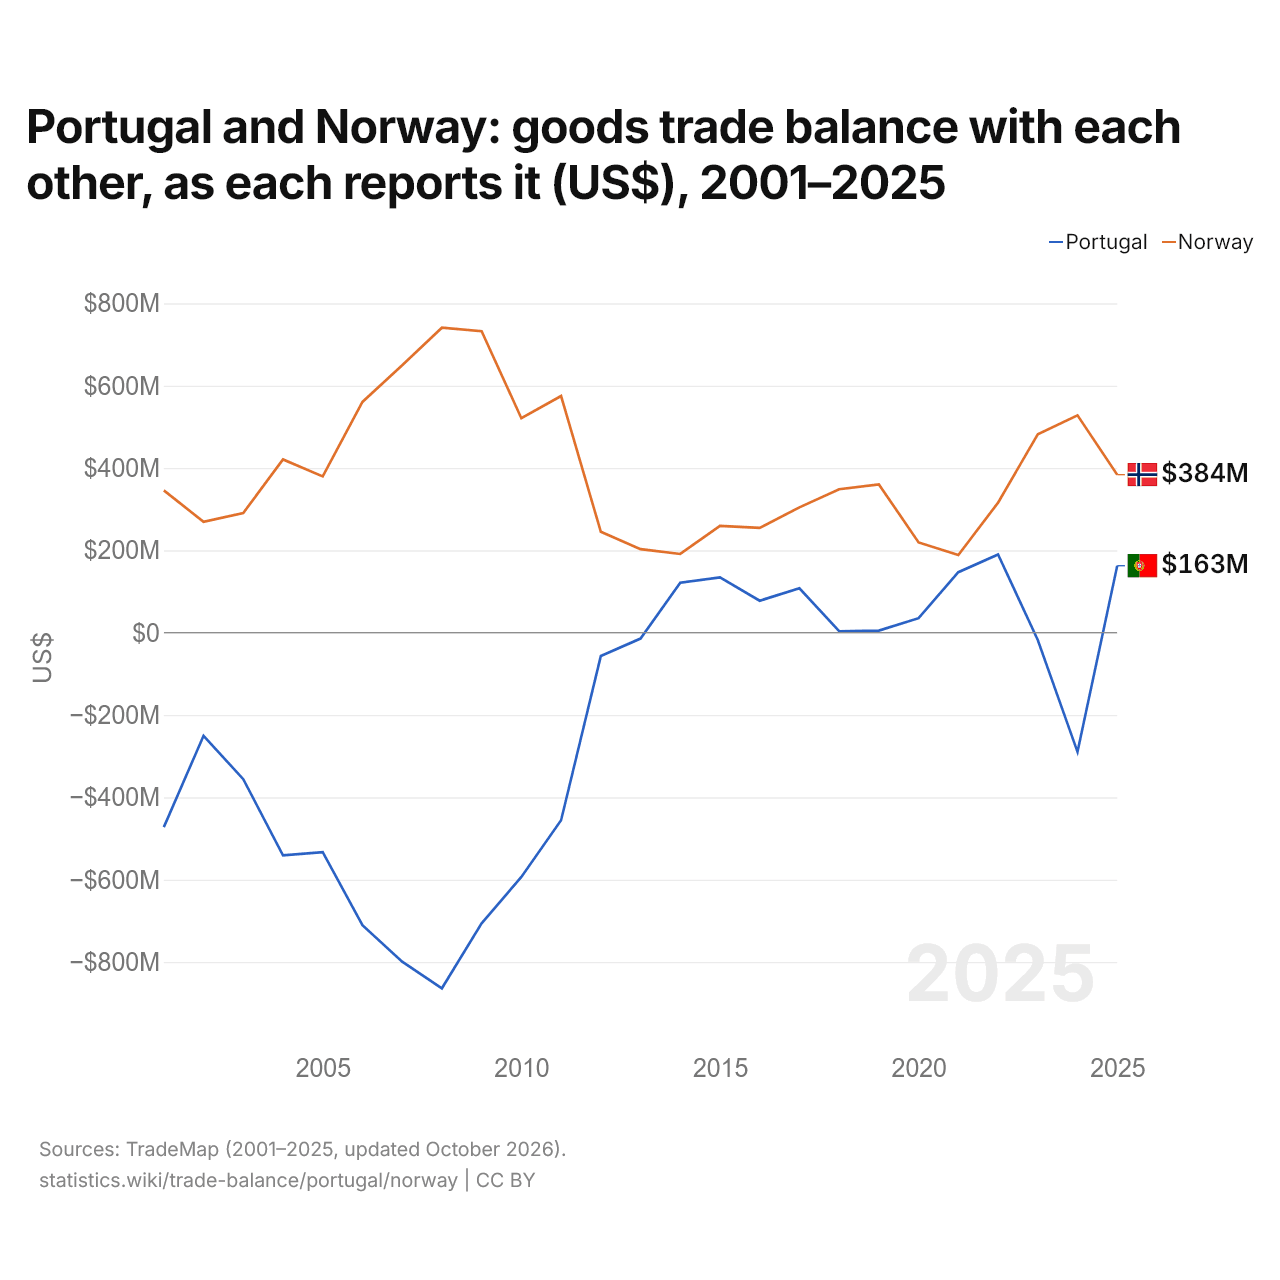
Portugal e a Noruega: saldo do comércio de bens entre os dois, segundo cada um (US$), 2001–2025
| Ano | US$ | |
|---|---|---|
| Portugal | Noruega | |
| 2025 | US$ 162.604.000 | US$ 383.832.000 |
| 2024 | US$ −289.612.000 | US$ 527.981.000 |
| 2023 | US$ −17.924.000 | US$ 481.950.000 |
| 2022 | US$ 189.897.000 | US$ 315.764.000 |
| 2021 | US$ 146.953.000 | US$ 188.463.000 |
| 2020 | US$ 35.175.000 | US$ 219.257.000 |
| 2019 | US$ 5.010.000 | US$ 360.269.000 |
| 2018 | US$ 3.357.000 | US$ 348.268.000 |
| 2017 | US$ 107.982.000 | US$ 304.308.000 |
| 2016 | US$ 77.558.000 | US$ 254.572.000 |
| 2015 | US$ 134.464.000 | US$ 259.574.000 |
| 2014 | US$ 121.396.000 | US$ 191.148.000 |
| 2013 | US$ −14.311.000 | US$ 202.789.000 |
| 2012 | US$ −56.807.000 | US$ 245.271.000 |
| 2011 | US$ −455.673.000 | US$ 574.790.000 |
| 2010 | US$ −593.456.000 | US$ 520.909.000 |
| 2009 | US$ −706.107.000 | US$ 732.346.000 |
| 2008 | US$ −863.903.000 | US$ 740.809.000 |
| 2007 | US$ −799.208.000 | US$ 649.651.000 |
| 2006 | US$ −710.666.000 | US$ 560.442.000 |
| 2005 | US$ −533.020.000 | US$ 379.493.000 |
| 2004 | US$ −540.887.000 | US$ 420.768.000 |
| 2003 | US$ −355.946.000 | US$ 290.757.000 |
| 2002 | US$ −250.428.000 | US$ 269.237.000 |
| 2001 | US$ −472.479.000 | US$ 345.634.000 |
Em 2025, segundo Portugal, o seu comércio de bens com a Noruega teve um superávit de US$ 163 milhões; segundo a Noruega, o seu comércio de bens com Portugal teve um superávit de US$ 384 milhões. Em 2001, os valores foram um déficit de US$ 472 milhões de Portugal e um superávit de US$ 346 milhões da Noruega.
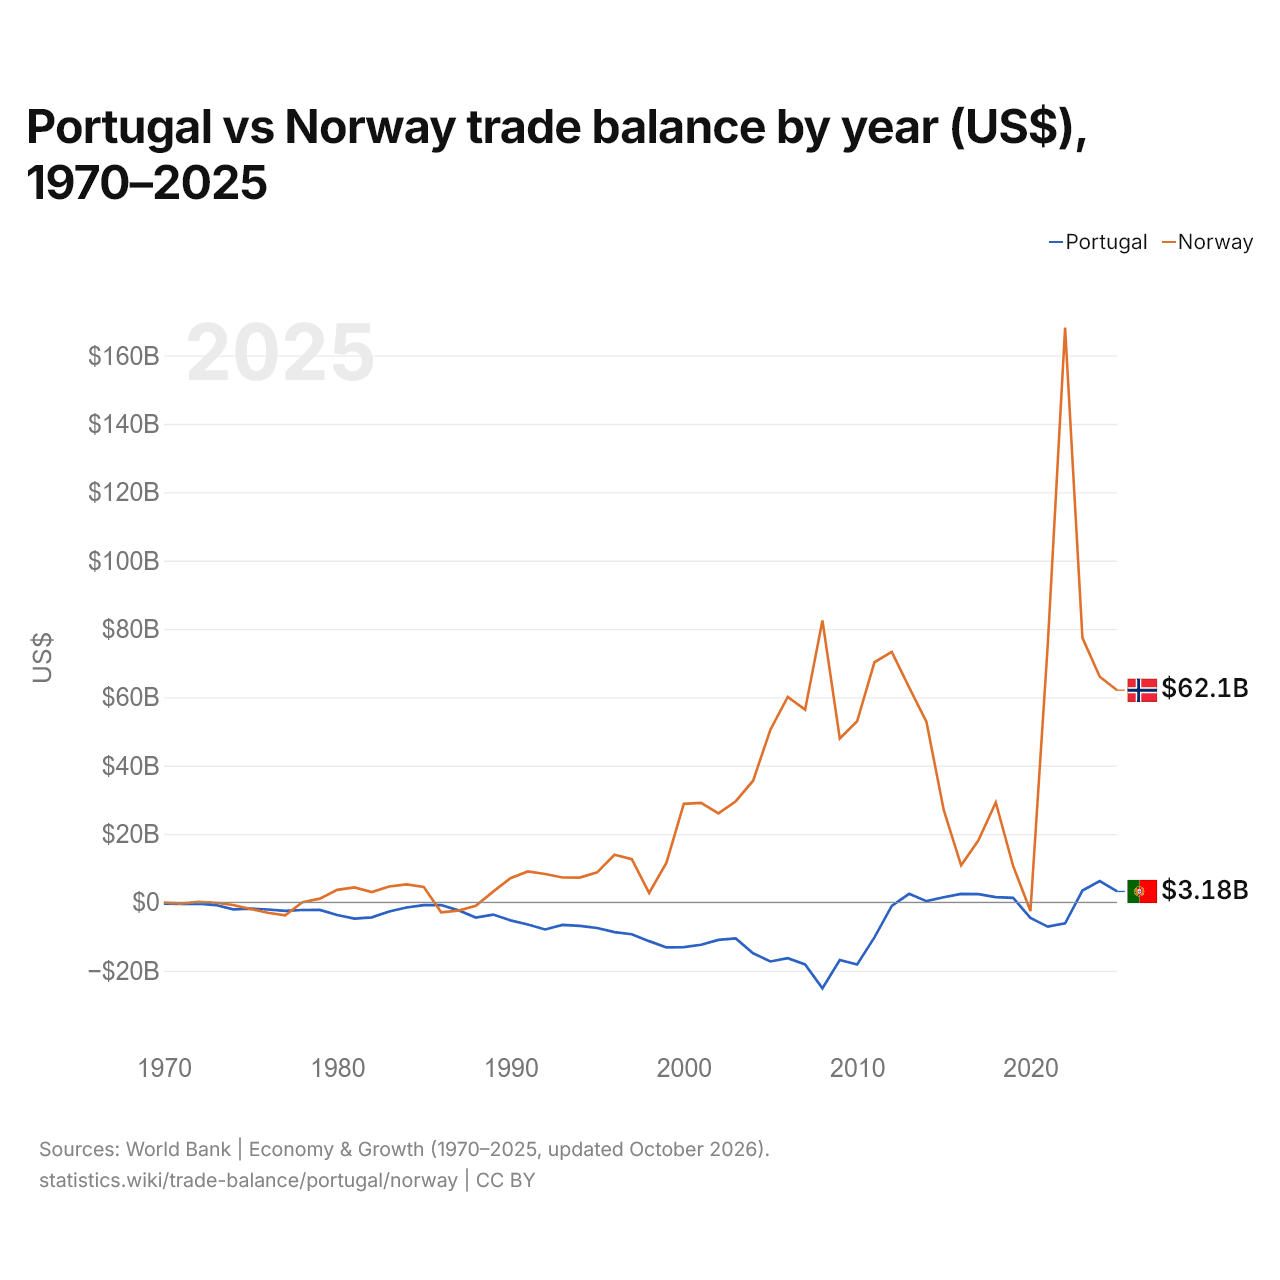
Portugal vs Noruega: balança comercial por ano (US$), 1970–2025
| Ano | US$ | |
|---|---|---|
 Portugal |
 Noruega |
|
| 2025 | US$ 3.179.729.609 | US$ 62.061.691.383 |
| 2024 | US$ 6.203.529.441 | US$ 66.013.586.661 |
| 2023 | US$ 3.435.097.440 | US$ 77.382.297.255 |
| 2022 | US$ −6.167.577.402 | US$ 168.143.018.116 |
| 2021 | US$ −7.109.880.156 | US$ 75.439.464.494 |
| 2020 | US$ −4.584.592.430 | US$ −2.578.741.482 |
| 2019 | US$ 1.285.251.893 | US$ 10.647.954.545 |
| 2018 | US$ 1.499.682.322 | US$ 29.218.444.513 |
| 2017 | US$ 2.379.942.262 | US$ 18.141.084.022 |
| 2016 | US$ 2.450.560.626 | US$ 10.825.238.095 |
| 2015 | US$ 1.474.193.135 | US$ 26.940.911.439 |
| 2014 | US$ 343.995.351 | US$ 52.830.150.754 |
| 2013 | US$ 2.487.546.494 | US$ 62.911.659.574 |
| 2012 | US$ −1.069.897.488 | US$ 73.268.414.267 |
| 2011 | US$ −10.270.004.539 | US$ 70.243.279.940 |
| 2010 | US$ −18.202.971.435 | US$ 52.975.375.707 |
| 2009 | US$ −16.894.818.154 | US$ 47.919.469.491 |
| 2008 | US$ −25.165.708.546 | US$ 82.461.347.518 |
| 2007 | US$ −18.176.093.820 | US$ 56.360.441.510 |
| 2006 | US$ −16.350.314.966 | US$ 60.084.200.022 |
| 2005 | US$ −17.311.334.503 | US$ 50.560.962.359 |
| 2004 | US$ −14.905.302.070 | US$ 35.586.725.611 |
| 2003 | US$ −10.582.015.649 | US$ 29.572.328.465 |
| 2002 | US$ −11.001.387.196 | US$ 26.020.691.901 |
| 2001 | US$ −12.424.660.029 | US$ 29.081.152.619 |
| 2000 | US$ −13.098.469.052 | US$ 28.816.037.629 |
| 1999 | US$ −13.193.669.762 | US$ 11.622.217.663 |
| 1998 | US$ −11.362.958.593 | US$ 2.735.020.079 |
| 1997 | US$ −9.357.416.810 | US$ 12.625.045.947 |
| 1996 | US$ −8.722.525.344 | US$ 13.902.136.500 |
| 1995 | US$ −7.530.287.913 | US$ 8.768.468.241 |
| 1994 | US$ −6.888.712.560 | US$ 7.225.260.712 |
| 1993 | US$ −6.626.869.468 | US$ 7.246.303.266 |
| 1992 | US$ −7.950.987.526 | US$ 8.279.990.345 |
| 1991 | US$ −6.488.605.522 | US$ 9.038.701.816 |
| 1990 | US$ −5.287.396.991 | US$ 7.042.669.777 |
| 1989 | US$ −3.598.389.356 | US$ 3.130.277.355 |
| 1988 | US$ −4.466.105.850 | US$ −1.028.080.405 |
| 1987 | US$ −2.360.348.655 | US$ −2.431.762.523 |
| 1986 | US$ −786.655.944 | US$ −2.930.747.698 |
| 1985 | US$ −822.089.658 | US$ 4.513.097.287 |
| 1984 | US$ −1.526.440.701 | US$ 5.246.707.100 |
| 1983 | US$ −2.676.254.072 | US$ 4.617.345.540 |
| 1982 | US$ −4.394.442.482 | US$ 2.993.027.580 |
| 1981 | US$ −4.769.358.306 | US$ 4.377.559.021 |
| 1980 | US$ −3.725.442.531 | US$ 3.645.124.717 |
| 1979 | US$ −2.220.319.672 | US$ 1.063.565.095 |
| 1978 | US$ −2.256.546.533 | US$ 16.595.769 |
| 1977 | US$ −2.499.565.217 | US$ −3.826.993.519 |
| 1976 | US$ −2.113.779.841 | US$ −3.050.673.509 |
| 1975 | US$ −1.851.043.137 | US$ −1.950.869.540 |
| 1974 | US$ −2.073.433.307 | US$ −773.327.075 |
| 1973 | US$ −808.299.264 | US$ −118.457.109 |
| 1972 | US$ −399.770.200 | US$ 111.107.738 |
| 1971 | US$ −494.459.364 | US$ −387.902.323 |
| 1970 | US$ −404.839.609 | US$ −92.959.442 |
Em 2025, a balança comercial de Portugal teve um superávit de US$ 3,18 bilhões e a da Noruega, um superávit de US$ 62,1 bilhões; o superávit da Noruega foi 20 vezes maior. Em 1970, a balança comercial de Portugal teve um déficit de US$ 405 milhões e a da Noruega, um déficit de US$ 93 milhões.
De 1970 a 2025, a balança comercial de Portugal teve superávit em 10 dos 56 anos, e a da Noruega, em 45. As balanças comerciais de Portugal e da Noruega tiveram déficit ao mesmo tempo em 11 desses anos, o mais recente em 2020.
Portugal vs Noruega: dados da balança comercial
|
Portugal
|
Noruega
|
|
|---|---|---|
| Bens e serviços, US$ | +US$ 3,18 bi (2025) | +US$ 62,1 bi (2025) |
| % do PIB | +0,9% (2025) | +11,7% (2025) |
| Anos com superávit desde 2000 | 10 de 26 | 25 de 26 |
| Saldo de bens entre os dois, dados próprios | +US$ 163 mi (2025) | +US$ 384 mi (2025) |
| Maior superávit em bens com | Reino Unido (+US$ 2,72 bi, 2025) | Reino Unido (+US$ 25,7 bi, 2025) |
| Maior déficit em bens com | Espanha (-US$ 18,1 bi, 2025) | China (-US$ 8,09 bi, 2025) |
Comparar a balança comercial de 2 países quaisquer
Fontes:
- Banco Mundial | Economy & Growth (1970–2025, atualizado em outubro de 2026)
- TradeMap (2001–2025, atualizado em outubro de 2026)
Creative Commons Atribuição (CC BY): você pode copiar, compartilhar, adaptar e reutilizar este conteúdo, inclusive para fins comerciais, desde que cite o statistics.wiki e indique as alterações que fizer. As fontes listadas acima podem ter suas próprias condições de licença.