
Portugal vs Noruega: exportações de bens e serviços por ano (US$), 1970–2025
| Ano | US$ | |
|---|---|---|
 Portugal |
 Noruega |
|
| 2025 | US$ 151.336.322.847 | US$ 240.819.559.118 |
| 2024 | US$ 143.716.598.546 | US$ 232.308.553.703 |
| 2023 | US$ 137.846.682.522 | US$ 233.044.619.754 |
| 2022 | US$ 127.117.787.017 | US$ 330.758.256.046 |
| 2021 | US$ 106.387.190.475 | US$ 217.945.634.459 |
| 2020 | US$ 85.546.804.978 | US$ 119.822.214.355 |
| 2019 | US$ 104.818.126.822 | US$ 151.434.431.818 |
| 2018 | US$ 105.740.319.070 | US$ 169.569.750.999 |
| 2017 | US$ 94.844.484.378 | US$ 148.727.825.912 |
| 2016 | US$ 83.254.740.237 | US$ 134.453.095.238 |
| 2015 | US$ 80.984.130.312 | US$ 151.371.127.416 |
| 2014 | US$ 92.457.300.369 | US$ 201.214.705.104 |
| 2013 | US$ 89.682.537.232 | US$ 211.475.234.043 |
| 2012 | US$ 81.685.225.652 | US$ 213.300.214.869 |
| 2011 | US$ 84.455.064.293 | US$ 210.287.346.729 |
| 2010 | US$ 71.598.934.533 | US$ 174.161.808.907 |
| 2009 | US$ 66.778.989.702 | US$ 155.294.435.698 |
| 2008 | US$ 82.346.807.429 | US$ 215.578.723.404 |
| 2007 | US$ 75.020.812.081 | US$ 173.303.649.112 |
| 2006 | US$ 63.373.039.604 | US$ 154.506.728.205 |
| 2005 | US$ 53.424.570.458 | US$ 134.661.078.774 |
| 2004 | US$ 52.396.449.477 | US$ 109.052.338.001 |
| 2003 | US$ 45.217.764.525 | US$ 91.002.514.053 |
| 2002 | US$ 36.493.691.735 | US$ 79.284.551.216 |
| 2001 | US$ 33.364.915.450 | US$ 78.381.841.031 |
| 2000 | US$ 33.452.144.656 | US$ 78.206.389.602 |
| 1999 | US$ 33.756.675.285 | US$ 62.333.572.674 |
| 1998 | US$ 33.876.548.308 | US$ 56.686.723.834 |
| 1997 | US$ 31.774.839.337 | US$ 64.600.757.769 |
| 1996 | US$ 32.556.406.291 | US$ 64.479.983.875 |
| 1995 | US$ 31.620.944.673 | US$ 55.671.328.451 |
| 1994 | US$ 25.055.310.386 | US$ 46.713.188.619 |
| 1993 | US$ 22.422.442.339 | US$ 44.244.794.970 |
| 1992 | US$ 26.315.596.971 | US$ 47.881.567.302 |
| 1991 | US$ 23.689.342.306 | US$ 47.030.187.108 |
| 1990 | US$ 22.960.185.628 | US$ 46.392.958.129 |
| 1989 | US$ 17.854.164.757 | US$ 37.392.425.230 |
| 1988 | US$ 15.572.504.178 | US$ 32.313.794.691 |
| 1987 | US$ 13.172.520.279 | US$ 29.427.235.622 |
| 1986 | US$ 10.071.952.821 | US$ 26.003.083.289 |
| 1985 | US$ 7.929.289.328 | US$ 27.037.523.845 |
| 1984 | US$ 7.358.490.824 | US$ 25.803.344.973 |
| 1983 | US$ 6.687.714.441 | US$ 25.115.536.429 |
| 1982 | US$ 6.314.253.280 | US$ 25.341.958.475 |
| 1981 | US$ 6.501.188.925 | US$ 26.748.497.256 |
| 1980 | US$ 7.058.033.640 | US$ 27.018.950.437 |
| 1979 | US$ 5.643.155.738 | US$ 20.451.807.824 |
| 1978 | US$ 3.702.002.737 | US$ 16.484.939.816 |
| 1977 | US$ 3.094.730.225 | US$ 13.926.176.388 |
| 1976 | US$ 2.777.320.955 | US$ 12.652.982.681 |
| 1975 | US$ 3.092.305.882 | US$ 11.586.982.724 |
| 1974 | US$ 3.686.495.659 | US$ 10.509.052.837 |
| 1973 | US$ 3.160.024.530 | US$ 8.189.670.124 |
| 1972 | US$ 2.398.176.427 | US$ 5.877.629.702 |
| 1971 | US$ 1.808.141.343 | US$ 4.897.319.973 |
| 1970 | US$ 1.549.504.881 | US$ 4.506.712.960 |
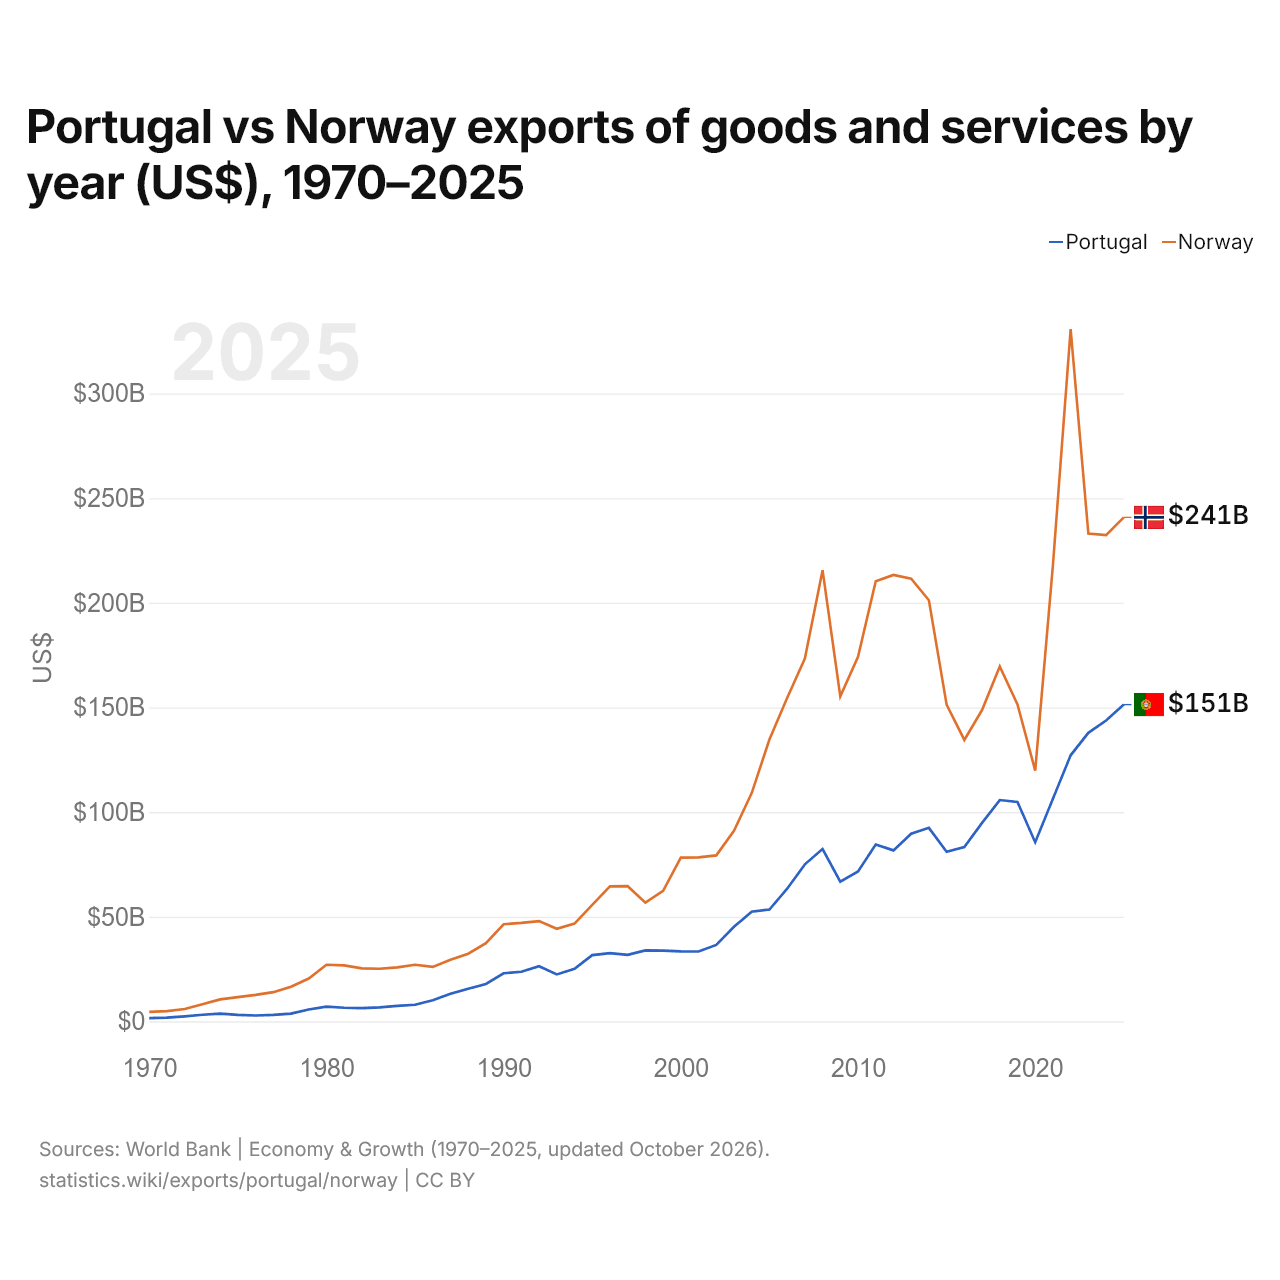
Em 2025, as exportações de bens e serviços de Portugal foram de US$ 151 bilhões e as da Noruega, de US$ 241 bilhões: as da Noruega foram 1,6 vezes maiores. Em 1970, as exportações da Noruega foram 2,9 vezes maiores: US$ 1,55 bilhão de Portugal e US$ 4,51 bilhões da Noruega.
As exportações de bens e serviços da Noruega têm sido maiores que as de Portugal todos os anos desde 1970.
Exportações de bens entre Portugal e a Noruega, segundo o exportador (US$), 2001–2025
| Ano | US$ | |
|---|---|---|
| Portugal → Noruega | Noruega → Portugal | |
| 2025 | US$ 295.139.000 | US$ 791.293.000 |
| 2024 | US$ 237.438.000 | US$ 910.697.000 |
| 2023 | US$ 249.047.000 | US$ 852.452.000 |
| 2022 | US$ 329.136.000 | US$ 789.886.000 |
| 2021 | US$ 290.606.000 | US$ 621.348.000 |
| 2020 | US$ 189.144.000 | US$ 543.878.000 |
| 2019 | US$ 221.493.000 | US$ 706.697.000 |
| 2018 | US$ 215.447.000 | US$ 668.970.000 |
| 2017 | US$ 204.570.000 | US$ 603.049.000 |
| 2016 | US$ 195.256.000 | US$ 566.695.000 |
| 2015 | US$ 229.678.000 | US$ 559.971.000 |
| 2014 | US$ 198.141.000 | US$ 515.212.000 |
| 2013 | US$ 141.909.000 | US$ 508.134.000 |
| 2012 | US$ 133.998.000 | US$ 517.216.000 |
| 2011 | US$ 125.382.000 | US$ 859.065.000 |
| 2010 | US$ 107.815.000 | US$ 777.981.000 |
| 2009 | US$ 114.644.000 | US$ 934.208.000 |
| 2008 | US$ 153.601.000 | US$ 985.757.000 |
| 2007 | US$ 133.893.000 | US$ 866.425.000 |
| 2006 | US$ 137.004.000 | US$ 763.084.000 |
| 2005 | US$ 116.539.000 | US$ 571.913.000 |
| 2004 | US$ 119.087.000 | US$ 608.235.000 |
| 2003 | US$ 259.535.000 | US$ 480.084.000 |
| 2002 | US$ 198.391.000 | US$ 455.960.000 |
| 2001 | US$ 271.023.000 | US$ 529.663.000 |
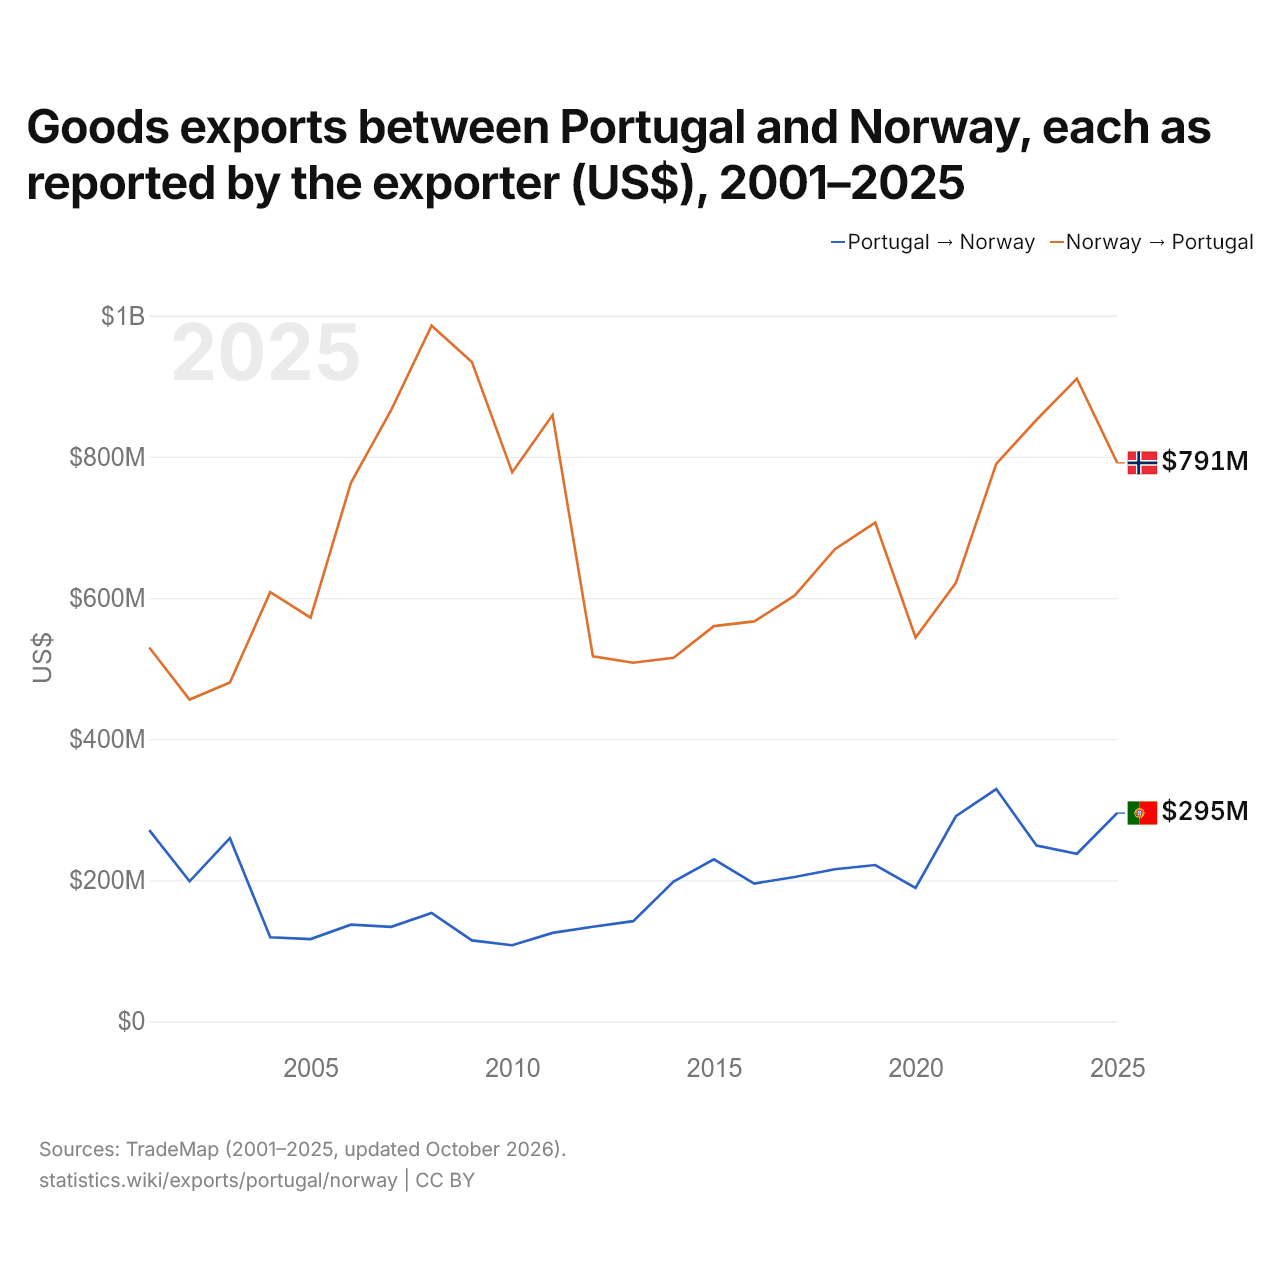
Em 2025, as exportações de bens de Portugal para a Noruega, segundo Portugal, foram de US$ 295 milhões, e as da Noruega para Portugal, segundo a Noruega, de US$ 791 milhões: 2,7 vezes mais da Noruega. Em 2001, foram de US$ 271 milhões de Portugal e de US$ 530 milhões da Noruega.
Portugal vs Noruega: dados de exportações
|
Portugal
|
Noruega
|
|
|---|---|---|
| Exportações | US$ 151 bi (2025) | US$ 241 bi (2025) |
| Posição mundial | 39/176 | 34/176 |
| Participação mundial | 0,43% | 0,69% |
| % do PIB | 43,7% | 45,4% |
| Maior categoria de bens | Máquinas, eletrônicos e veículos (31,6%, 2025) | Petróleo, gás, minérios e outras matérias-primas (63,3%, 2025) |
| Principal destino dos bens | Espanha (26%, 2025) | Reino Unido (17,6%, 2025) |
Comparar as exportações de 2 países quaisquer
Fontes:
- Banco Mundial | Economy & Growth (1970–2025, atualizado em outubro de 2026)
- TradeMap (2001–2025, atualizado em outubro de 2026)
Creative Commons Atribuição (CC BY): você pode copiar, compartilhar, adaptar e reutilizar este conteúdo, inclusive para fins comerciais, desde que cite o statistics.wiki e indique as alterações que fizer. As fontes listadas acima podem ter suas próprias condições de licença.