
Portugal vs Kuwait: exportações de bens e serviços por ano (US$), 1965–2025
| Ano | US$ | |
|---|---|---|
 Portugal |
 Kuwait |
|
| 2025 | US$ 151.336.322.847 | US$ 83.383.478.240 |
| 2024 | US$ 143.716.598.546 | US$ 89.713.098.852 |
| 2023 | US$ 137.846.682.522 | US$ 95.475.365.008 |
| 2022 | US$ 127.117.787.017 | US$ 110.924.408.163 |
| 2021 | US$ 106.387.190.475 | US$ 76.735.412.391 |
| 2020 | US$ 85.546.804.978 | US$ 48.541.470.057 |
| 2019 | US$ 104.818.126.822 | US$ 73.327.382.736 |
| 2018 | US$ 105.740.319.070 | US$ 79.460.231.954 |
| 2017 | US$ 94.844.484.378 | US$ 61.787.573.760 |
| 2016 | US$ 83.254.740.237 | US$ 52.112.899.115 |
| 2015 | US$ 80.984.130.312 | US$ 61.607.350.790 |
| 2014 | US$ 92.457.300.369 | US$ 111.424.545.362 |
| 2013 | US$ 89.682.537.232 | US$ 123.417.300.389 |
| 2012 | US$ 81.685.225.652 | US$ 130.069.015.775 |
| 2011 | US$ 84.455.064.293 | US$ 112.783.943.706 |
| 2010 | US$ 71.598.934.533 | US$ 76.952.063.278 |
| 2009 | US$ 66.778.989.702 | US$ 62.981.044.877 |
| 2008 | US$ 82.346.807.429 | US$ 98.390.048.656 |
| 2007 | US$ 75.020.812.081 | US$ 72.695.222.614 |
| 2006 | US$ 63.373.039.604 | US$ 66.566.497.574 |
| 2005 | US$ 53.424.570.458 | US$ 51.691.780.822 |
| 2004 | US$ 52.396.449.477 | US$ 33.831.014.591 |
| 2003 | US$ 45.217.764.525 | US$ 24.938.593.077 |
| 2002 | US$ 36.493.691.735 | US$ 17.014.681.785 |
| 2001 | US$ 33.364.915.450 | US$ 17.901.278.849 |
| 2000 | US$ 33.452.144.656 | US$ 21.300.594.617 |
| 1999 | US$ 33.756.675.285 | US$ 13.836.374.686 |
| 1998 | US$ 33.876.548.308 | US$ 11.379.595.480 |
| 1997 | US$ 31.774.839.337 | US$ 16.040.929.754 |
| 1996 | US$ 32.556.406.291 | US$ 16.465.770.902 |
| 1995 | US$ 31.620.944.673 | US$ 14.233.635.340 |
| 1994 | US$ 25.055.310.386 | US$ 12.636.363.300 |
| 1993 | US$ 22.422.442.339 | US$ 11.437.086.424 |
| 1992 | US$ 26.315.596.971 | US$ 8.036.810.157 |
| 1991 | US$ 23.689.342.306 | US$ 1.860.913.431 |
| 1990 | US$ 22.960.185.628 | US$ 8.281.249.653 |
| 1989 | US$ 17.854.164.757 | US$ 12.740.870.178 |
| 1988 | US$ 15.572.504.178 | US$ 9.841.270.621 |
| 1987 | US$ 13.172.520.279 | US$ 11.752.547.342 |
| 1986 | US$ 10.071.952.821 | US$ 8.269.241.040 |
| 1985 | US$ 7.929.289.328 | US$ 11.511.107.454 |
| 1984 | US$ 7.358.490.824 | US$ 13.044.565.328 |
| 1983 | US$ 6.687.714.441 | US$ 12.340.939.422 |
| 1982 | US$ 6.314.253.280 | US$ 11.760.578.443 |
| 1981 | US$ 6.501.188.925 | US$ 17.414.854.099 |
| 1980 | US$ 7.058.033.640 | US$ 22.438.280.484 |
| 1979 | US$ 5.643.155.738 | US$ 19.296.875.158 |
| 1978 | US$ 3.702.002.737 | US$ 10.936.074.138 |
| 1977 | US$ 3.094.730.225 | US$ 10.182.645.883 |
| 1976 | US$ 2.777.320.955 | US$ 10.234.380.804 |
| 1975 | US$ 3.092.305.882 | US$ 9.674.794.850 |
| 1974 | US$ 3.686.495.659 | US$ 11.050.618.964 |
| 1973 | US$ 3.160.024.530 | US$ 3.890.792.118 |
| 1972 | US$ 2.398.176.427 | US$ 3.053.056.857 |
| 1971 | US$ 1.808.141.343 | US$ 2.574.572.168 |
| 1970 | US$ 1.549.504.881 | US$ 1.718.919.312 |
| 1969 | - | US$ 1.758.399.297 |
| 1968 | - | US$ 1.643.599.343 |
| 1967 | - | US$ 1.453.199.419 |
| 1966 | - | US$ 1.570.799.372 |
| 1965 | - | US$ 1.419.599.432 |
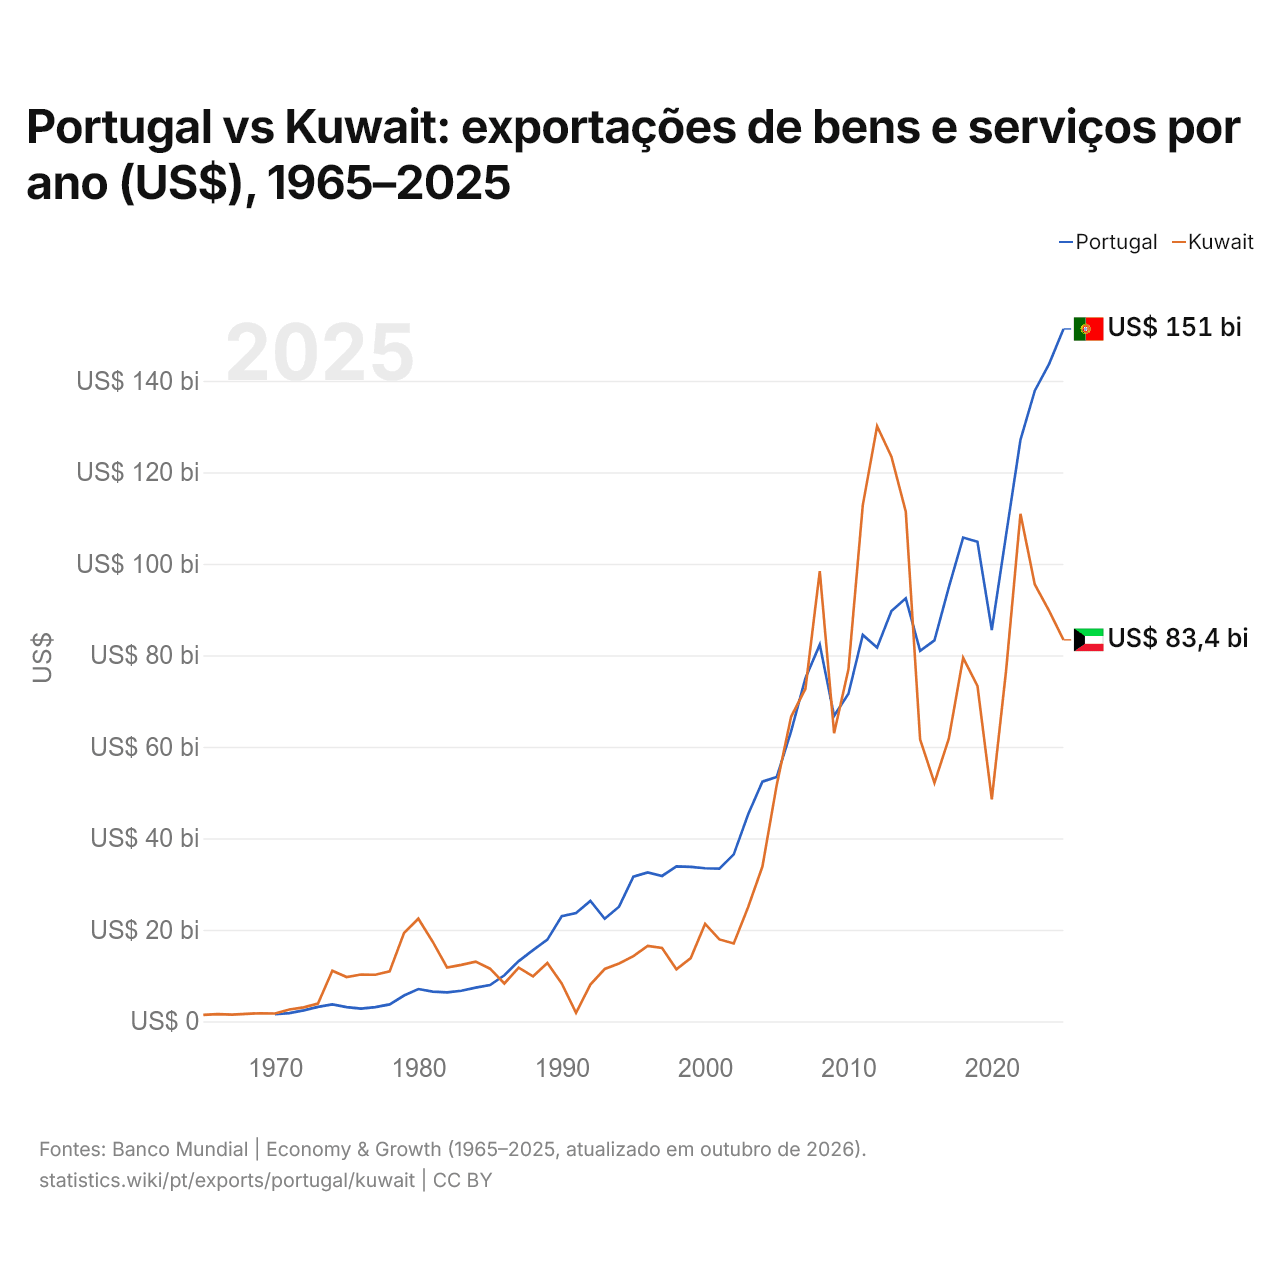
Em 2025, as exportações de bens e serviços de Portugal foram de US$ 151 bilhões e as do Kuwait, de US$ 83,4 bilhões: as de Portugal foram 1,8 vezes maiores. Em 1970, as exportações do Kuwait foram 11% maiores: US$ 1,55 bilhão de Portugal e US$ 1,72 bilhão do Kuwait.
As exportações de bens e serviços de Portugal têm sido maiores que as do Kuwait todos os anos desde 2015.
Exportações de bens entre Portugal e o Kuwait, segundo o exportador (US$), 2001–2025
| Ano | US$ | |
|---|---|---|
| Portugal → Kuwait | Kuwait → Portugal | |
| 2025 | US$ 51.885.000 | US$ 6.020.000 |
| 2024 | US$ 50.469.000 | US$ 9.460.000 |
| 2023 | US$ 47.573.000 | US$ 16.965.000 |
| 2022 | US$ 51.953.000 | US$ 15.335.000 |
| 2021 | US$ 32.013.000 | US$ 70.023.000 |
| 2020 | US$ 25.800.000 | US$ 34.349.000 |
| 2019 | US$ 32.108.000 | US$ 10.987.000 |
| 2018 | US$ 34.097.000 | US$ 17.710.000 |
| 2017 | US$ 23.874.000 | US$ 3.004.000 |
| 2016 | US$ 29.072.000 | US$ 4.490.000 |
| 2015 | US$ 25.482.000 | US$ 9.977.000 |
| 2014 | US$ 31.826.000 | US$ 3.837.000 |
| 2013 | US$ 76.435.000 | US$ 3.728.000 |
| 2012 | US$ 44.685.000 | US$ 1.302.000 |
| 2011 | US$ 20.186.000 | US$ 1.803.000 |
| 2010 | US$ 19.168.000 | US$ 3.045.000 |
| 2009 | US$ 14.938.000 | US$ 673.000 |
| 2008 | US$ 16.505.000 | US$ 503.000 |
| 2007 | US$ 13.246.000 | US$ 399.000 |
| 2006 | US$ 11.237.000 | US$ 238.000 |
| 2005 | US$ 57.168.000 | US$ 35.000 |
| 2004 | US$ 30.703.000 | US$ 35.000 |
| 2003 | US$ 26.009.000 | US$ 95.000 |
| 2002 | US$ 8.858.000 | US$ 81.000 |
| 2001 | US$ 8.000.000 | US$ 35.000 |
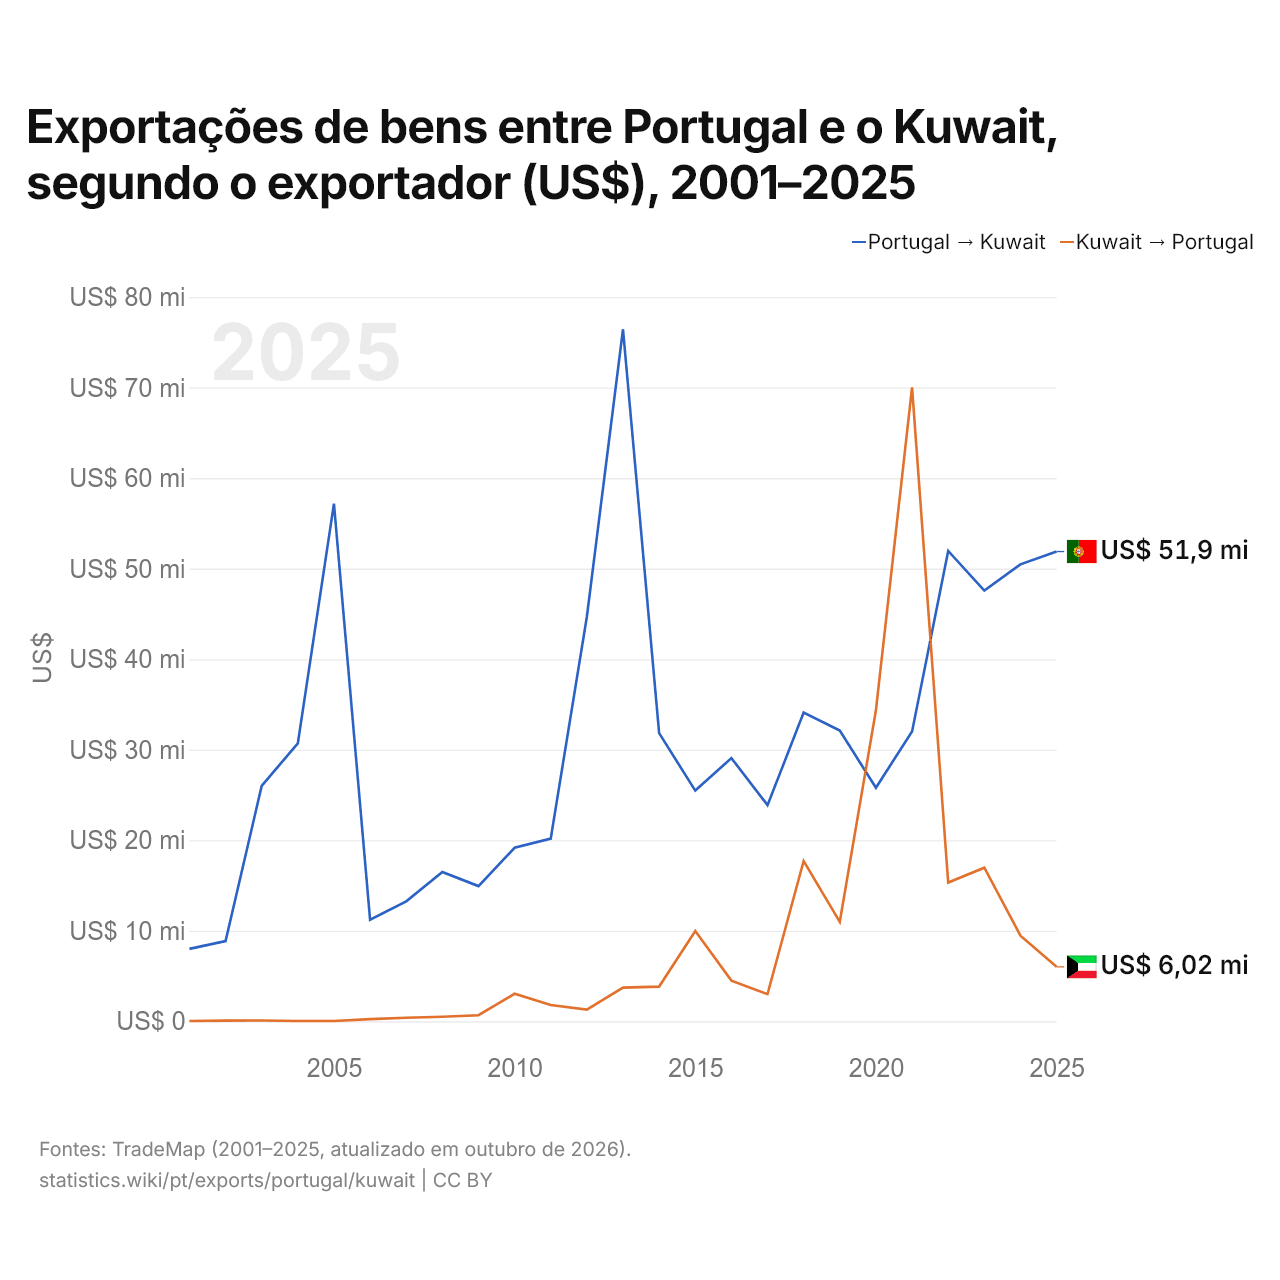
Em 2025, as exportações de bens de Portugal para o Kuwait, segundo Portugal, foram de US$ 51,9 milhões, e as do Kuwait para Portugal, segundo o Kuwait, de US$ 6,02 milhões: 8,6 vezes mais de Portugal. Em 2001, foram de US$ 8 milhões de Portugal e de US$ 35.000 do Kuwait.
Portugal vs Kuwait: dados de exportações
|
Portugal
|
Kuwait
|
|
|---|---|---|
| Exportações | US$ 151 bi (2025) | US$ 83,4 bi (2025) |
| Posição mundial | 39/176 | 52/176 |
| Participação mundial | 0,43% | 0,24% |
| % do PIB | 43,7% | 53,0% |
| Maior categoria de bens | Máquinas, eletrônicos e veículos (31,6%, 2025) | Petróleo, gás, minérios e outras matérias-primas (87,9%, 2025) |
| Principal destino dos bens | Espanha (26%, 2025) | Emirados Árabes Unidos (2,73%, 2025) |
Comparar as exportações de 2 países quaisquer
Fontes:
- Banco Mundial | Economy & Growth (1965–2025, atualizado em outubro de 2026)
- TradeMap (2001–2025, atualizado em outubro de 2026)
Creative Commons Atribuição (CC BY): você pode copiar, compartilhar, adaptar e reutilizar este conteúdo, inclusive para fins comerciais, desde que cite o statistics.wiki e indique as alterações que fizer. As fontes listadas acima podem ter suas próprias condições de licença.