
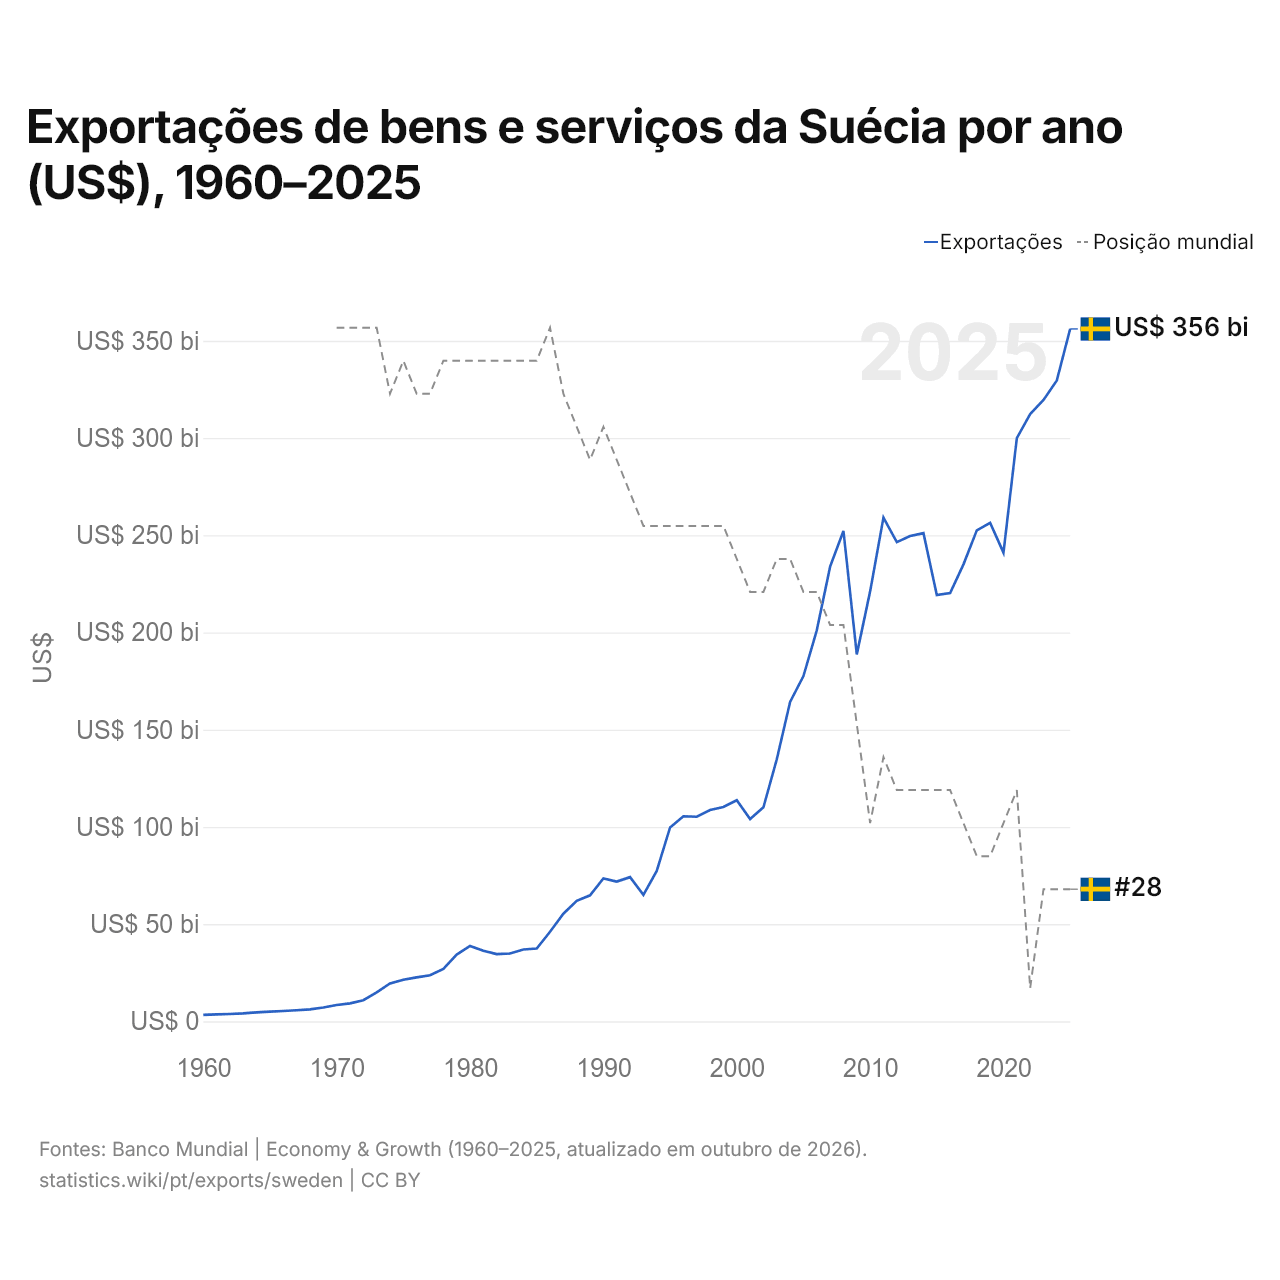
Exportações de bens e serviços da Suécia por ano (US$), 1960–2025
| Ano | US$ | Posição mundial |
|---|---|---|
| Exportações | Posição mundial | |
| 2025 | US$ 356.098.645.397 | #28 |
| 2024 | US$ 329.613.629.462 | #28 |
| 2023 | US$ 319.579.119.038 | #28 |
| 2022 | US$ 312.333.054.945 | #31 |
| 2021 | US$ 299.954.758.724 | #25 |
| 2020 | US$ 241.040.989.303 | #26 |
| 2019 | US$ 256.361.650.143 | #27 |
| 2018 | US$ 252.513.588.793 | #27 |
| 2017 | US$ 235.035.642.663 | #26 |
| 2016 | US$ 220.294.654.962 | #25 |
| 2015 | US$ 219.257.723.595 | #25 |
| 2014 | US$ 251.073.164.368 | #25 |
| 2013 | US$ 249.633.416.172 | #25 |
| 2012 | US$ 246.467.911.084 | #25 |
| 2011 | US$ 259.105.070.011 | #24 |
| 2010 | US$ 221.131.967.531 | #26 |
| 2009 | US$ 188.748.072.853 | #23 |
| 2008 | US$ 252.233.466.341 | #20 |
| 2007 | US$ 233.870.509.558 | #20 |
| 2006 | US$ 201.116.532.488 | #19 |
| 2005 | US$ 177.558.710.575 | #19 |
| 2004 | US$ 164.273.700.826 | #18 |
| 2003 | US$ 134.751.740.598 | #18 |
| 2002 | US$ 110.054.739.091 | #19 |
| 2001 | US$ 104.030.360.825 | #19 |
| 2000 | US$ 113.693.763.507 | #18 |
| 1999 | US$ 110.212.408.017 | #17 |
| 1998 | US$ 108.707.782.488 | #17 |
| 1997 | US$ 105.238.706.466 | #17 |
| 1996 | US$ 105.471.368.923 | #17 |
| 1995 | US$ 99.716.260.356 | #17 |
| 1994 | US$ 77.327.890.098 | #17 |
| 1993 | US$ 65.075.545.391 | #17 |
| 1992 | US$ 74.162.970.569 | #16 |
| 1991 | US$ 71.908.405.788 | #15 |
| 1990 | US$ 73.469.841.353 | #14 |
| 1989 | US$ 64.788.686.811 | #15 |
| 1988 | US$ 62.002.451.691 | #14 |
| 1987 | US$ 55.328.058.324 | #13 |
| 1986 | US$ 46.083.452.608 | #11 |
| 1985 | US$ 37.450.573.228 | #12 |
| 1984 | US$ 36.959.043.618 | #12 |
| 1983 | US$ 34.880.514.536 | #12 |
| 1982 | US$ 34.607.827.969 | #12 |
| 1981 | US$ 36.270.607.694 | #12 |
| 1980 | US$ 38.777.578.731 | #12 |
| 1979 | US$ 34.345.349.770 | #12 |
| 1978 | US$ 26.992.994.135 | #12 |
| 1977 | US$ 23.692.379.061 | #13 |
| 1976 | US$ 22.620.156.569 | #13 |
| 1975 | US$ 21.363.794.615 | #12 |
| 1974 | US$ 19.469.658.738 | #13 |
| 1973 | US$ 14.907.783.528 | #11 |
| 1972 | US$ 10.843.484.588 | #11 |
| 1971 | US$ 9.260.327.747 | #11 |
| 1970 | US$ 8.403.319.222 | #11 |
| 1969 | US$ 7.088.694.250 | - |
| 1968 | US$ 6.160.444.504 | - |
| 1967 | US$ 5.682.819.986 | - |
| 1966 | US$ 5.313.573.629 | - |
| 1965 | US$ 4.982.734.952 | - |
| 1964 | US$ 4.623.375.686 | - |
| 1963 | US$ 4.076.731.162 | - |
| 1962 | US$ 3.759.772.648 | - |
| 1961 | US$ 3.536.171.254 | - |
| 1960 | US$ 3.347.365.082 | - |
Em 2025, as exportações de bens e serviços da Suécia foram de US$ 356 bilhões, ante US$ 3,35 bilhões em 1960. Foram as 28ª maiores do mundo, posição que mantêm desde 2023. Sua melhor posição foi o 11º lugar, ocupado pela última vez em 1986.
Em 2025, as exportações de bens e serviços da Suécia foram as 12ª maiores de 41 países da Europa. As importações de bens e serviços da Suécia foram de US$ 342 bilhões em 2025, as 28ª maiores do mundo. Em 2025, as exportações da Suécia superaram as importações em US$ 14,2 bilhões, um superávit comercial.
Exportações de bens da Suécia por categoria, 2025
Exportações de bens, 2025: US$ 208 bi
Em 2025, a maior categoria das exportações de bens da Suécia foi máquinas, eletrônicos e veículos, com 39,8%, seguida de produtos químicos, farmacêuticos e plásticos, com 14,8%.
Destinos das exportações de bens da Suécia: os 10 principais, 2025
| Posição | País | Exportações de bens | Participação | |
|---|---|---|---|---|
| 1 |
 Alemanha |
US$ 20,5 bi | 9,85% | vs Alemanha |
| 2 |
 Noruega |
US$ 20,5 bi | 9,83% | vs Noruega |
| 3 |
 Estados Unidos |
US$ 16,6 bi | 7,97% | vs EUA |
| 4 |
 Dinamarca |
US$ 14,6 bi | 6,99% | vs Dinamarca |
| 5 |
 Finlândia |
US$ 13,5 bi | 6,49% | vs Finlândia |
| 6 |
 Reino Unido |
US$ 10,8 bi | 5,2% | vs RU |
| 7 |
 Países Baixos |
US$ 10,1 bi | 4,84% | vs Países Baixos |
| 8 |
 Bélgica |
US$ 9,82 bi | 4,71% | vs Bélgica |
| 9 |
 Polônia |
US$ 8,51 bi | 4,08% | vs Polônia |
| 10 |
 França |
US$ 8,36 bi | 4,01% | vs França |
| Outros parceiros e não especificados | US$ 75,1 bi | 36% |
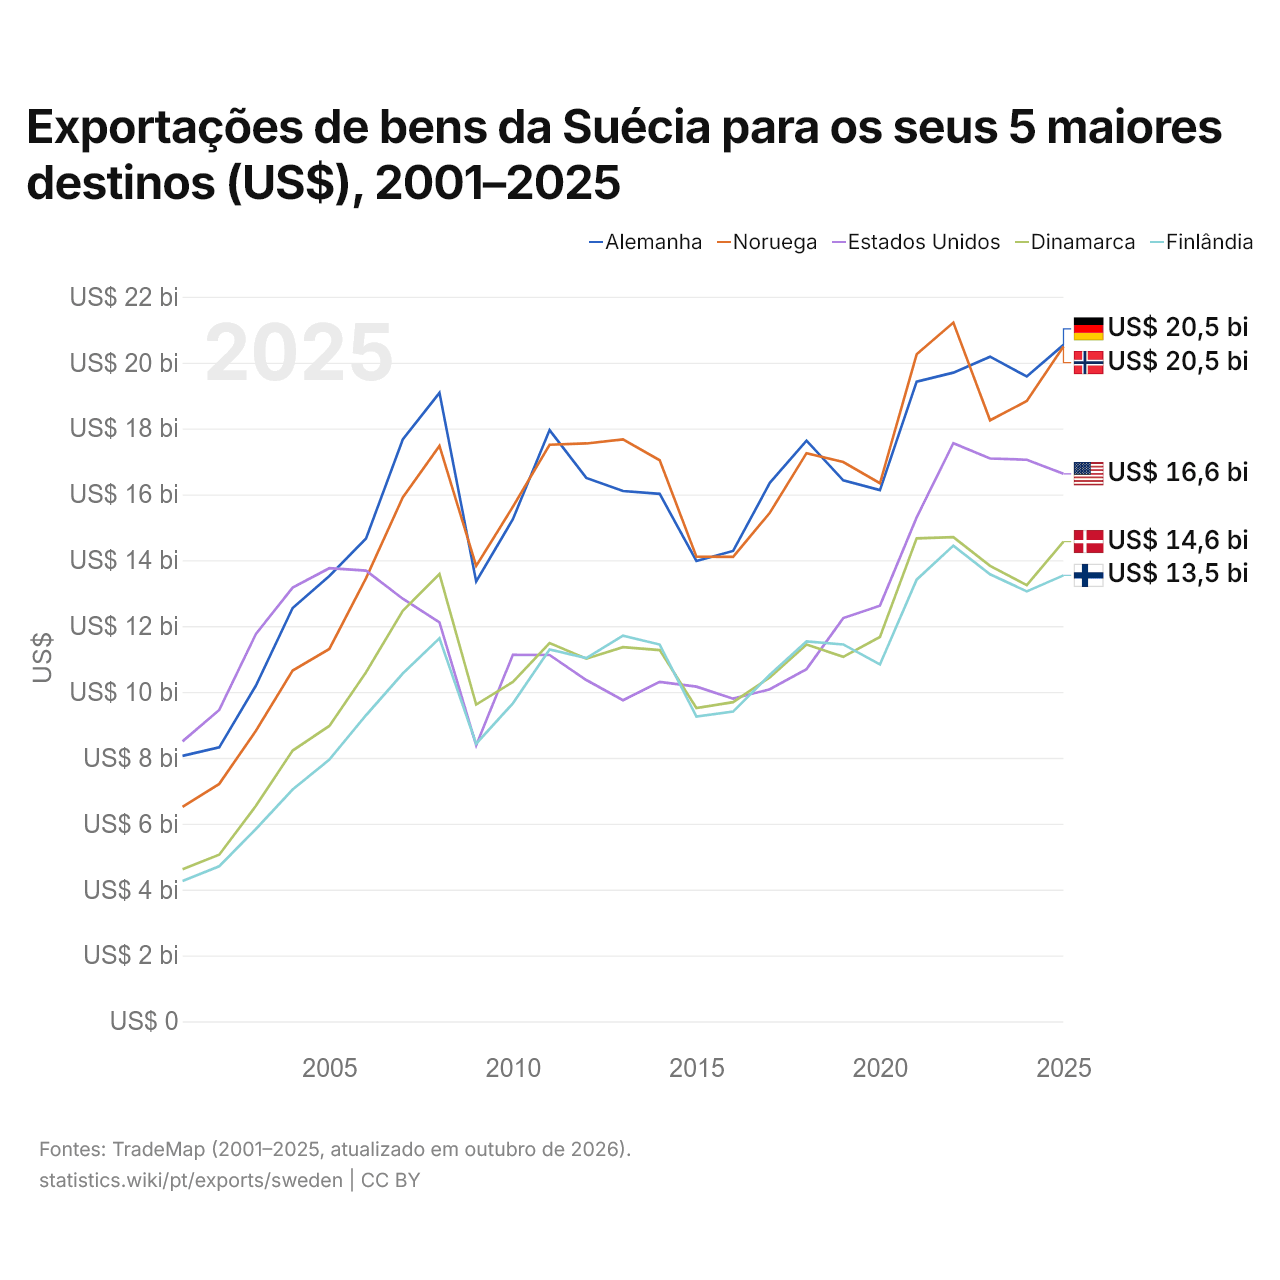
Exportações de bens da Suécia para os seus 5 maiores destinos (US$), 2001–2025
| Ano | US$ | ||||
|---|---|---|---|---|---|
| Alemanha | Noruega | Estados Unidos | Dinamarca | Finlândia | |
| 2025 | US$ 20.538.452.000 | US$ 20.486.827.000 | US$ 16.624.481.000 | US$ 14.565.740.000 | US$ 13.540.177.000 |
| 2024 | US$ 19.580.172.000 | US$ 18.834.647.000 | US$ 17.052.176.000 | US$ 13.243.381.000 | US$ 13.054.191.000 |
| 2023 | US$ 20.181.366.000 | US$ 18.249.030.000 | US$ 17.089.983.000 | US$ 13.829.567.000 | US$ 13.575.226.000 |
| 2022 | US$ 19.696.101.000 | US$ 21.215.828.000 | US$ 17.555.070.000 | US$ 14.703.651.000 | US$ 14.444.051.000 |
| 2021 | US$ 19.422.649.000 | US$ 20.254.230.000 | US$ 15.301.714.000 | US$ 14.664.109.000 | US$ 13.411.323.000 |
| 2020 | US$ 16.128.219.000 | US$ 16.337.098.000 | US$ 12.621.523.000 | US$ 11.668.764.000 | US$ 10.833.990.000 |
| 2019 | US$ 16.426.166.000 | US$ 16.982.088.000 | US$ 12.244.073.000 | US$ 11.066.878.000 | US$ 11.443.676.000 |
| 2018 | US$ 17.631.585.000 | US$ 17.251.720.000 | US$ 10.692.900.000 | US$ 11.441.963.000 | US$ 11.534.158.000 |
| 2017 | US$ 16.349.159.000 | US$ 15.441.320.000 | US$ 10.082.724.000 | US$ 10.445.666.000 | US$ 10.525.043.000 |
| 2016 | US$ 14.282.182.000 | US$ 14.102.309.000 | US$ 9.797.671.000 | US$ 9.690.410.000 | US$ 9.404.345.000 |
| 2015 | US$ 13.978.875.000 | US$ 14.107.673.000 | US$ 10.161.580.000 | US$ 9.510.975.000 | US$ 9.253.672.000 |
| 2014 | US$ 16.015.508.000 | US$ 17.036.348.000 | US$ 10.306.942.000 | US$ 11.271.354.000 | US$ 11.440.161.000 |
| 2013 | US$ 16.102.611.000 | US$ 17.670.764.000 | US$ 9.749.160.000 | US$ 11.359.372.000 | US$ 11.710.255.000 |
| 2012 | US$ 16.500.155.000 | US$ 17.546.126.000 | US$ 10.362.257.000 | US$ 11.010.540.000 | US$ 11.026.586.000 |
| 2011 | US$ 17.952.267.000 | US$ 17.507.768.000 | US$ 11.122.841.000 | US$ 11.487.326.000 | US$ 11.288.256.000 |
| 2010 | US$ 15.246.295.000 | US$ 15.623.284.000 | US$ 11.128.501.000 | US$ 10.306.144.000 | US$ 9.654.932.000 |
| 2009 | US$ 13.357.552.000 | US$ 13.828.390.000 | US$ 8.382.141.000 | US$ 9.618.224.000 | US$ 8.430.931.000 |
| 2008 | US$ 19.083.565.000 | US$ 17.471.448.000 | US$ 12.111.317.000 | US$ 13.580.078.000 | US$ 11.629.407.000 |
| 2007 | US$ 17.666.346.000 | US$ 15.907.048.000 | US$ 12.832.056.000 | US$ 12.466.498.000 | US$ 10.561.414.000 |
| 2006 | US$ 14.661.966.000 | US$ 13.460.130.000 | US$ 13.683.751.000 | US$ 10.598.537.000 | US$ 9.294.005.000 |
| 2005 | US$ 13.520.752.000 | US$ 11.305.416.000 | US$ 13.757.965.000 | US$ 8.969.329.000 | US$ 7.945.522.000 |
| 2004 | US$ 12.549.477.000 | US$ 10.651.367.000 | US$ 13.169.164.000 | US$ 8.223.108.000 | US$ 7.038.150.000 |
| 2003 | US$ 10.194.615.000 | US$ 8.824.741.000 | US$ 11.764.457.000 | US$ 6.543.404.000 | US$ 5.840.974.000 |
| 2002 | US$ 8.316.936.000 | US$ 7.209.256.000 | US$ 9.453.931.000 | US$ 5.058.870.000 | US$ 4.707.319.000 |
| 2001 | US$ 8.060.570.000 | US$ 6.510.345.000 | US$ 8.500.648.000 | US$ 4.618.278.000 | US$ 4.257.478.000 |
Em 2025, as exportações de bens foram de US$ 20,5 bilhões para a Alemanha, US$ 20,5 bilhões para a Noruega, US$ 16,6 bilhões para os Estados Unidos, US$ 14,6 bilhões para a Dinamarca e US$ 13,5 bilhões para a Finlândia. O primeiro lugar dos cinco destinos da Suécia fica com a Alemanha desde 2023.
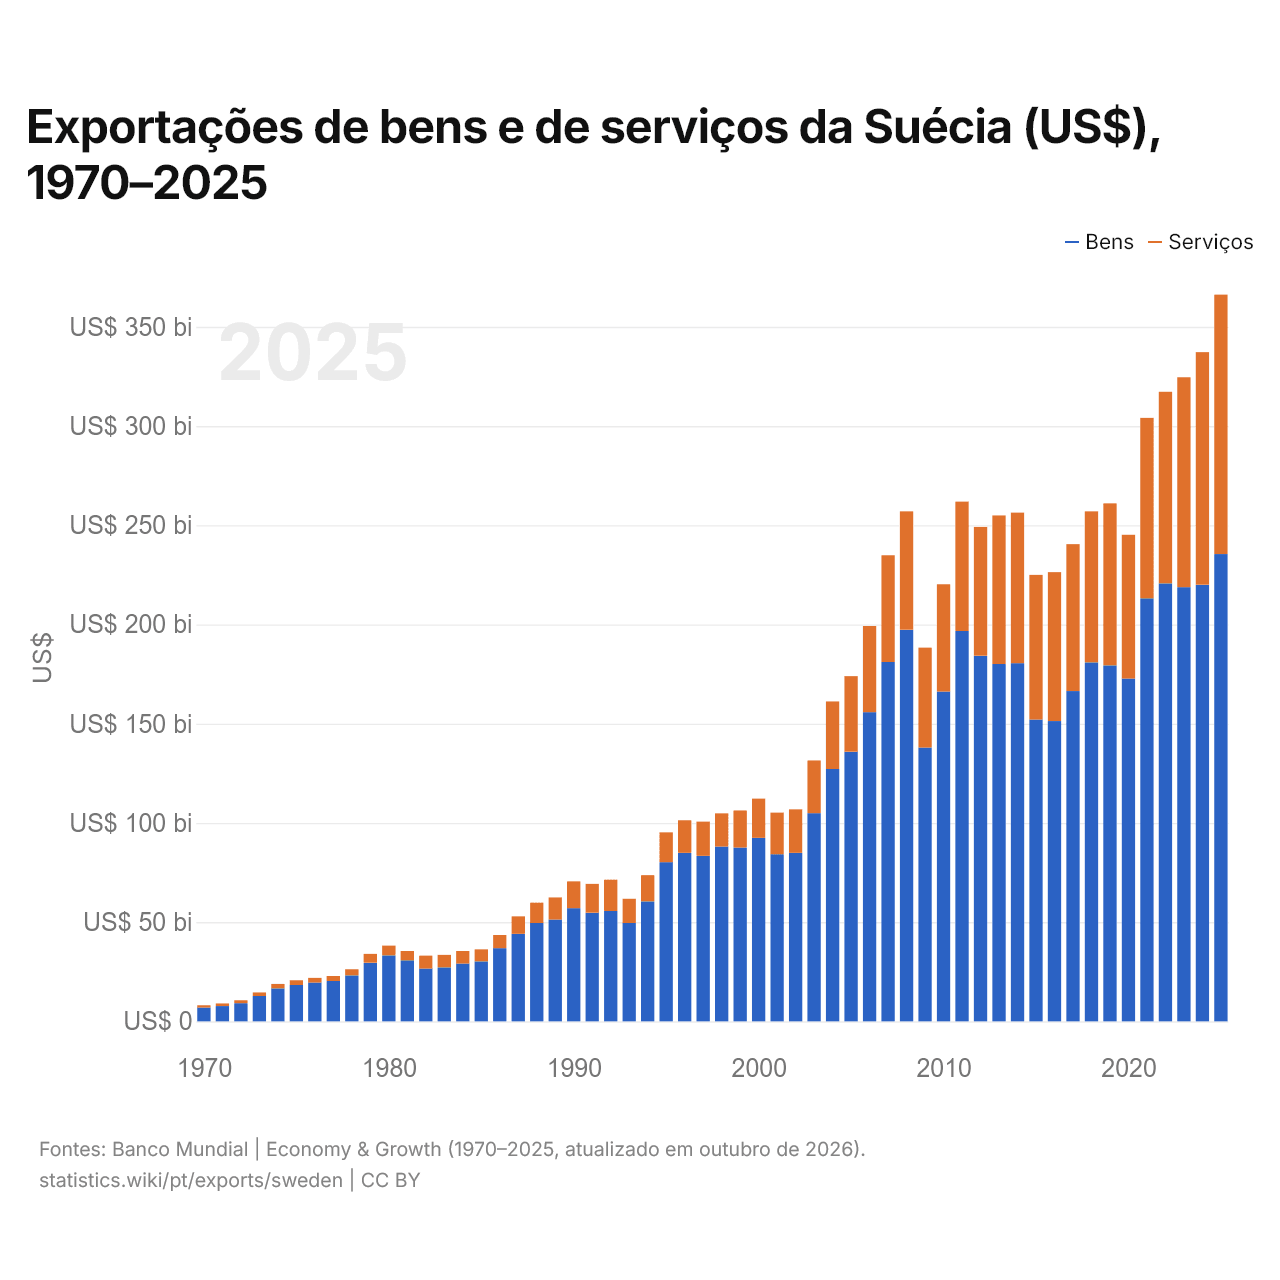
Exportações de bens e de serviços da Suécia (US$), 1970–2025
| Ano | US$ | |
|---|---|---|
| Bens | Serviços | |
| 2025 | US$ 235.482.700.446 | US$ 130.728.731.918 |
| 2024 | US$ 220.032.592.218 | US$ 117.190.312.334 |
| 2023 | US$ 218.805.832.433 | US$ 105.797.047.615 |
| 2022 | US$ 220.716.212.599 | US$ 96.530.026.084 |
| 2021 | US$ 213.193.542.717 | US$ 90.940.629.791 |
| 2020 | US$ 172.777.152.833 | US$ 72.458.123.883 |
| 2019 | US$ 179.360.888.453 | US$ 81.675.957.430 |
| 2018 | US$ 180.871.244.851 | US$ 76.159.800.470 |
| 2017 | US$ 166.450.970.691 | US$ 74.013.417.067 |
| 2016 | US$ 151.317.226.606 | US$ 75.048.990.004 |
| 2015 | US$ 152.033.620.304 | US$ 72.957.554.007 |
| 2014 | US$ 180.493.944.558 | US$ 75.888.253.379 |
| 2013 | US$ 180.075.739.258 | US$ 74.863.448.366 |
| 2012 | US$ 184.265.550.199 | US$ 64.911.302.489 |
| 2011 | US$ 196.756.415.540 | US$ 65.185.244.764 |
| 2010 | US$ 166.225.378.894 | US$ 54.051.178.672 |
| 2009 | US$ 137.966.200.599 | US$ 50.375.602.117 |
| 2008 | US$ 197.330.660.427 | US$ 59.684.860.668 |
| 2007 | US$ 181.101.772.272 | US$ 53.777.951.808 |
| 2006 | US$ 155.838.490.570 | US$ 43.403.125.758 |
| 2005 | US$ 135.861.187.561 | US$ 38.113.559.603 |
| 2004 | US$ 127.162.333.903 | US$ 34.062.735.477 |
| 2003 | US$ 104.935.699.527 | US$ 26.502.640.688 |
| 2002 | US$ 84.897.425.344 | US$ 21.926.492.754 |
| 2001 | US$ 84.198.841.253 | US$ 21.003.750.868 |
| 2000 | US$ 92.441.279.022 | US$ 19.786.458.527 |
| 1999 | US$ 87.623.542.500 | US$ 18.629.317.998 |
| 1998 | US$ 88.073.833.673 | US$ 16.730.229.216 |
| 1997 | US$ 83.398.079.668 | US$ 17.286.219.453 |
| 1996 | US$ 84.942.949.248 | US$ 16.401.002.552 |
| 1995 | US$ 80.203.401.434 | US$ 15.051.446.452 |
| 1994 | US$ 60.456.913.143 | US$ 13.200.676.510 |
| 1993 | US$ 49.558.393.055 | US$ 12.226.599.496 |
| 1992 | US$ 55.632.443.821 | US$ 15.750.761.040 |
| 1991 | US$ 54.747.422.635 | US$ 14.519.852.951 |
| 1990 | US$ 57.020.002.086 | US$ 13.510.172.667 |
| 1989 | US$ 51.306.544.774 | US$ 11.119.018.627 |
| 1988 | US$ 49.551.200.516 | US$ 10.235.701.329 |
| 1987 | US$ 44.101.260.182 | US$ 8.830.274.242 |
| 1986 | US$ 36.845.461.737 | US$ 6.663.954.605 |
| 1985 | US$ 30.172.874.075 | US$ 6.120.779.793 |
| 1984 | US$ 29.122.824.384 | US$ 6.293.083.977 |
| 1983 | US$ 27.203.808.028 | US$ 6.291.598.365 |
| 1982 | US$ 26.575.301.678 | US$ 6.521.304.432 |
| 1981 | US$ 30.770.137.926 | US$ 4.653.958.891 |
| 1980 | US$ 33.215.407.017 | US$ 4.935.254.820 |
| 1979 | US$ 29.525.250.211 | US$ 4.470.982.578 |
| 1978 | US$ 23.174.455.423 | US$ 3.077.613.142 |
| 1977 | US$ 20.315.963.817 | US$ 2.522.652.621 |
| 1976 | US$ 19.508.716.823 | US$ 2.402.564.241 |
| 1975 | US$ 18.321.015.148 | US$ 2.369.383.032 |
| 1974 | US$ 16.608.006.671 | US$ 2.230.018.528 |
| 1973 | US$ 12.760.890.724 | US$ 1.818.077.738 |
| 1972 | US$ 9.159.215.386 | US$ 1.455.143.572 |
| 1971 | US$ 7.694.250.692 | US$ 1.322.693.197 |
| 1970 | US$ 6.904.803.782 | US$ 1.198.482.179 |
Em 2025, as exportações de bens da Suécia foram de US$ 235 bilhões e as de serviços, de US$ 131 bilhões; os serviços representaram 35,7% do total, ante 14,8% em 1970.
A Suécia na classificação mundial de exportações, 2025
| Posição | País | Exportações | Participação mundial | |
|---|---|---|---|---|
| 25 |
 Brasil |
US$ 406 bi | 1,16% | vs Brasil |
| 26 |
 Turquia |
US$ 397 bi | 1,14% | |
| 27 |
 Arábia Saudita |
US$ 380 bi | 1,09% | |
| 28 |
 Suécia |
US$ 356 bi | 1,02% | |
| 29 |
 Malásia |
US$ 335 bi | 0,96% | |
| 30 |
 Indonésia |
US$ 330 bi | 0,95% | |
| 31 |
Dinamarca
|
US$ 324 bi | 0,93% | vs Dinamarca |
Exportações de bens e serviços da Suécia, % do PIB, 1960–2025
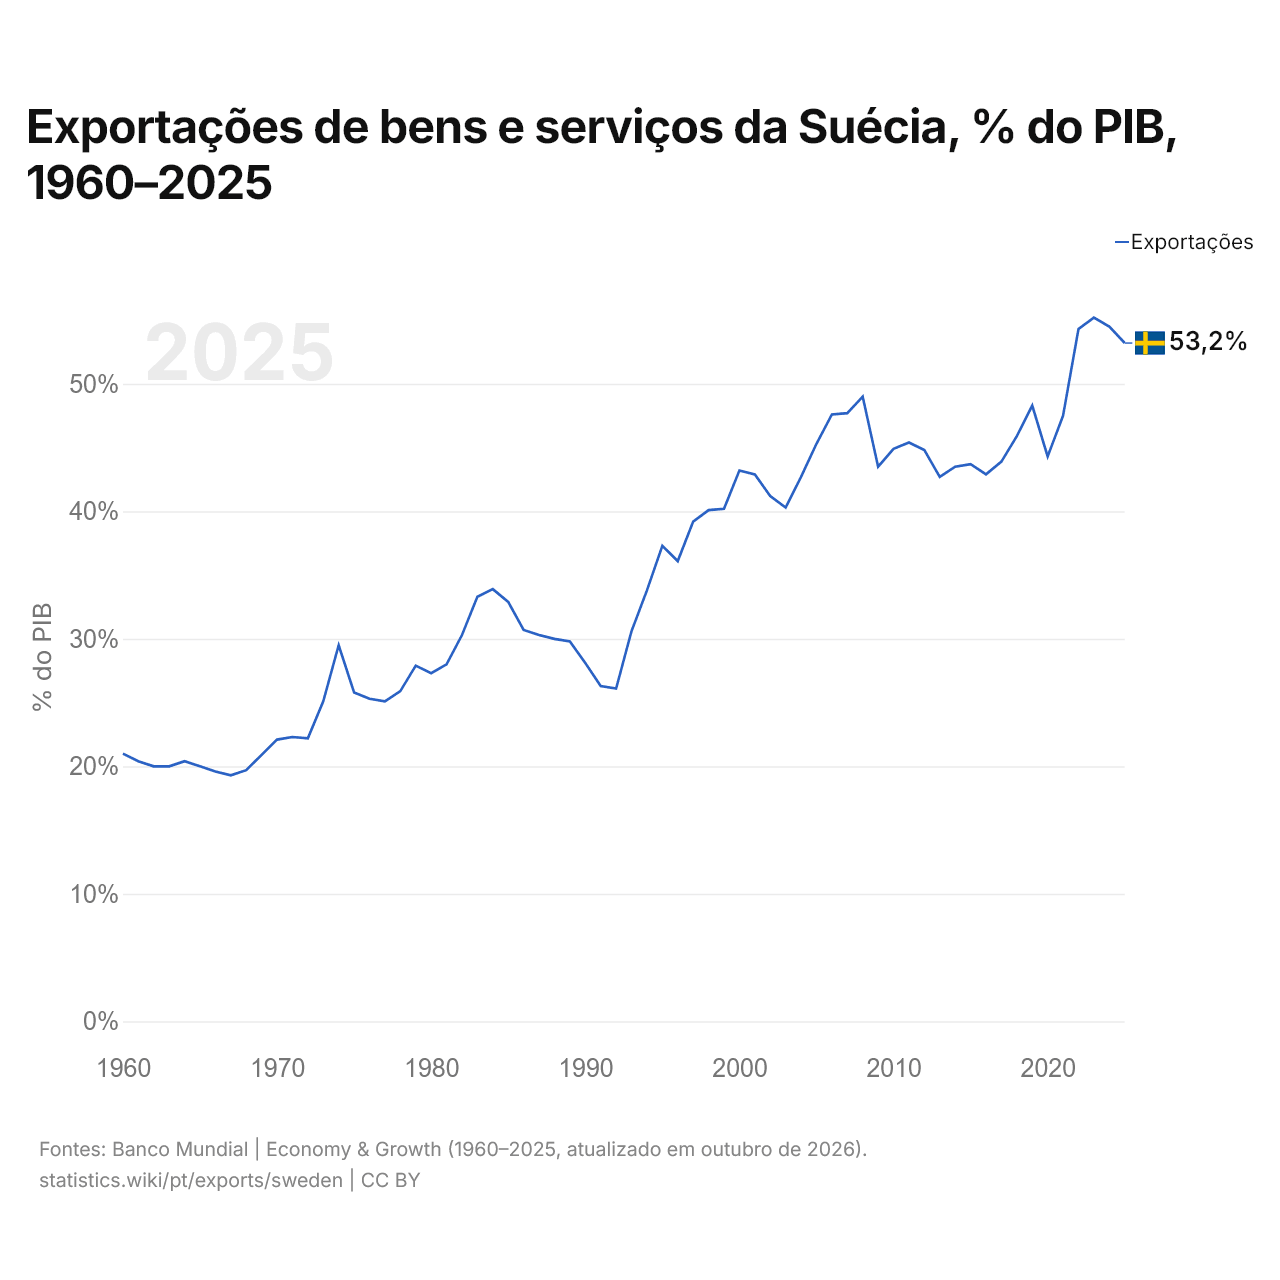
Em 2025, as exportações de bens e serviços da Suécia equivaleram a 53,2% do seu PIB, ante 21,0% em 1960. A maior participação foi de 55,2%, em 2023.
Comparar as exportações da Suécia com as de outros países
Fontes:
- TradeMap (2001–2025, atualizado em outubro de 2026)
- Banco Mundial | Economy & Growth (1960–2025, atualizado em outubro de 2026)
Creative Commons Atribuição (CC BY): você pode copiar, compartilhar, adaptar e reutilizar este conteúdo, inclusive para fins comerciais, desde que cite o statistics.wiki e indique as alterações que fizer. As fontes listadas acima podem ter suas próprias condições de licença.