
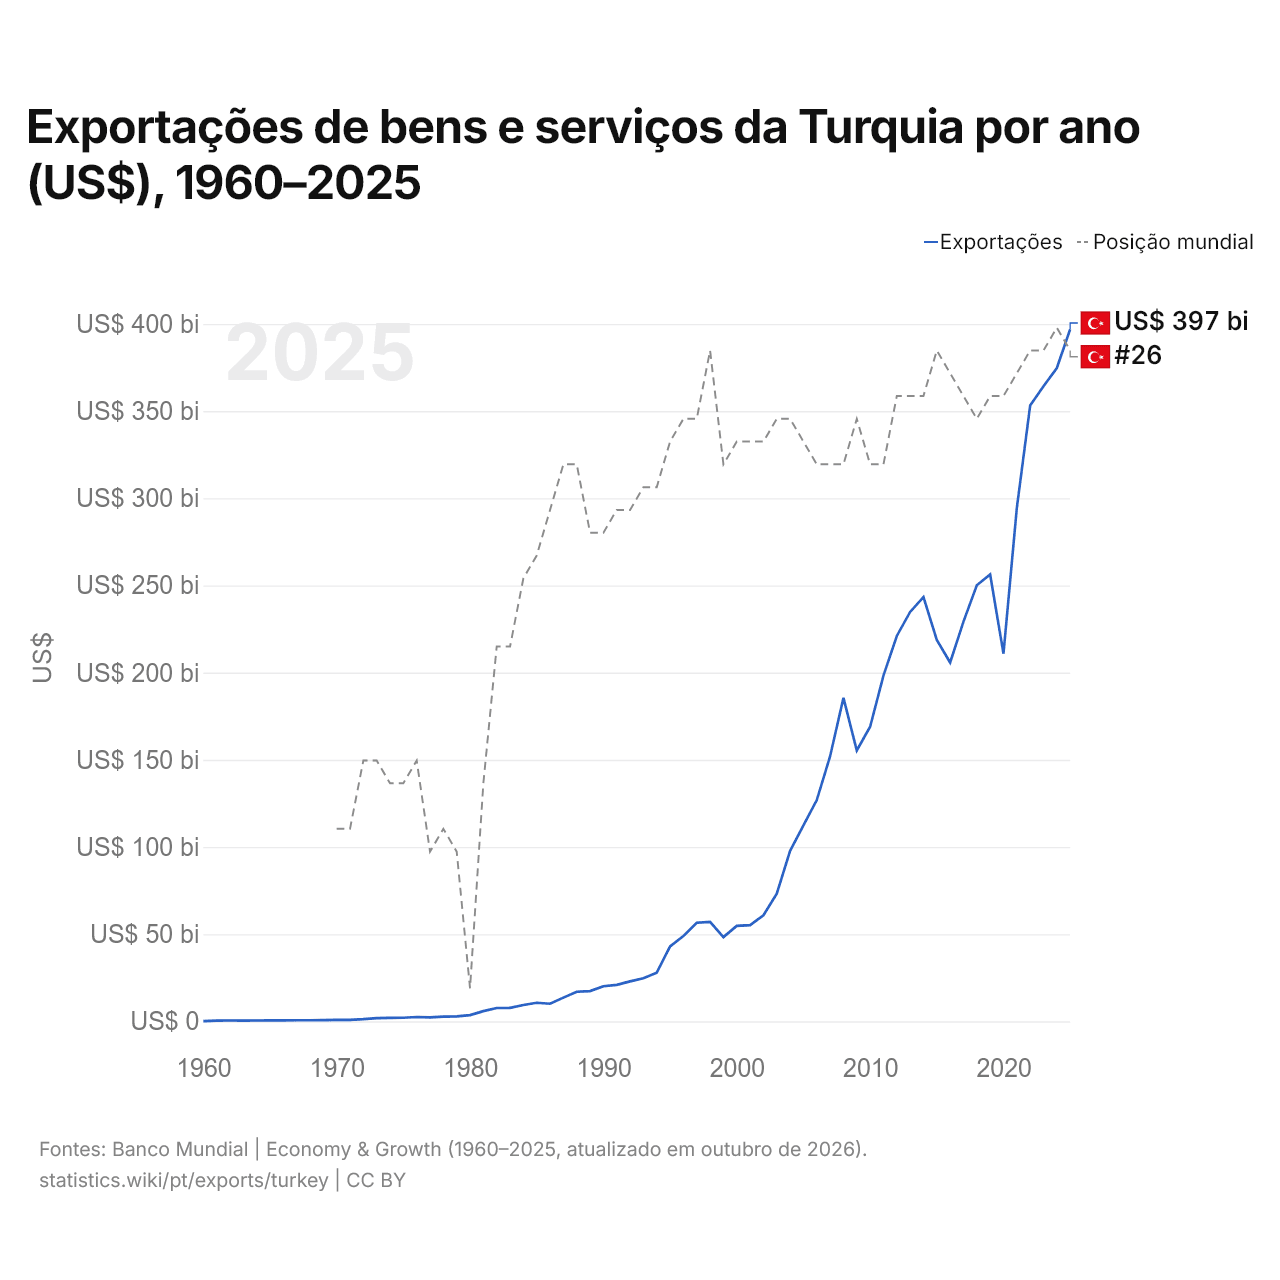
Exportações de bens e serviços da Turquia por ano (US$), 1960–2025
| Ano | US$ | Posição mundial |
|---|---|---|
| Exportações | Posição mundial | |
| 2025 | US$ 396.923.725.496 | #26 |
| 2024 | US$ 374.686.274.270 | #25 |
| 2023 | US$ 364.211.599.327 | #26 |
| 2022 | US$ 353.224.790.396 | #26 |
| 2021 | US$ 294.429.020.560 | #27 |
| 2020 | US$ 210.844.790.112 | #28 |
| 2019 | US$ 256.263.371.549 | #28 |
| 2018 | US$ 250.128.750.717 | #29 |
| 2017 | US$ 229.267.970.164 | #28 |
| 2016 | US$ 205.793.476.583 | #27 |
| 2015 | US$ 218.795.091.046 | #26 |
| 2014 | US$ 243.287.863.473 | #28 |
| 2013 | US$ 234.800.269.886 | #28 |
| 2012 | US$ 221.029.283.948 | #28 |
| 2011 | US$ 198.303.837.476 | #31 |
| 2010 | US$ 168.951.184.650 | #31 |
| 2009 | US$ 155.351.324.873 | #29 |
| 2008 | US$ 185.490.178.806 | #31 |
| 2007 | US$ 152.035.619.691 | #31 |
| 2006 | US$ 126.908.581.381 | #31 |
| 2005 | US$ 112.432.994.612 | #30 |
| 2004 | US$ 97.840.598.666 | #29 |
| 2003 | US$ 73.154.313.089 | #29 |
| 2002 | US$ 60.832.867.533 | #30 |
| 2001 | US$ 55.193.312.761 | #30 |
| 2000 | US$ 54.766.754.849 | #30 |
| 1999 | US$ 48.333.647.259 | #31 |
| 1998 | US$ 57.013.676.915 | #26 |
| 1997 | US$ 56.559.938.761 | #29 |
| 1996 | US$ 48.967.049.936 | #29 |
| 1995 | US$ 43.006.009.379 | #30 |
| 1994 | US$ 27.909.720.018 | #32 |
| 1993 | US$ 24.669.695.039 | #32 |
| 1992 | US$ 22.898.733.993 | #33 |
| 1991 | US$ 20.904.913.710 | #33 |
| 1990 | US$ 20.135.262.553 | #34 |
| 1989 | US$ 17.357.728.558 | #34 |
| 1988 | US$ 16.951.828.411 | #31 |
| 1987 | US$ 13.584.947.491 | #31 |
| 1986 | US$ 10.073.925.926 | #33 |
| 1985 | US$ 10.663.601.533 | #35 |
| 1984 | US$ 9.354.223.433 | #36 |
| 1983 | US$ 7.708.888.889 | #39 |
| 1982 | US$ 7.636.809.816 | #39 |
| 1981 | US$ 5.863.063.063 | #45 |
| 1980 | US$ 3.552.631.579 | #54 |
| 1979 | US$ 2.883.870.968 | #48 |
| 1978 | US$ 2.733.333.333 | #47 |
| 1977 | US$ 2.238.888.889 | #48 |
| 1976 | US$ 2.500.000.000 | #44 |
| 1975 | US$ 2.035.714.286 | #45 |
| 1974 | US$ 2.028.571.429 | #45 |
| 1973 | US$ 1.828.571.429 | #44 |
| 1972 | US$ 1.242.857.143 | #44 |
| 1971 | US$ 860.000.000 | #47 |
| 1970 | US$ 790.909.091 | #47 |
| 1969 | US$ 700.000.000 | - |
| 1968 | US$ 644.444.444 | - |
| 1967 | US$ 644.444.444 | - |
| 1966 | US$ 577.777.778 | - |
| 1965 | US$ 544.444.444 | - |
| 1964 | US$ 500.000.000 | - |
| 1963 | US$ 433.333.333 | - |
| 1962 | US$ 500.000.000 | - |
| 1961 | US$ 411.111.111 | - |
| 1960 | US$ 155.555.556 | - |
Em 2025, as exportações de bens e serviços da Turquia foram de US$ 397 bilhões, ante US$ 156 milhões em 1960. Foram as 26ª maiores do mundo; em 2024, eram as 25ª. Sua melhor posição foi o 25º lugar, ocupado pela última vez em 2024.
Em 2025, as exportações de bens e serviços da Turquia foram as 10ª maiores de 44 países da Ásia. As importações de bens e serviços da Turquia foram de US$ 401 bilhões em 2025, as 23ª maiores do mundo. Em 2025, as importações da Turquia superaram as exportações em US$ 3,76 bilhões, um déficit comercial.
Exportações de bens da Turquia por categoria, 2025
Exportações de bens, 2025: US$ 273 bi
Em 2025, a maior categoria das exportações de bens da Turquia foi máquinas, eletrônicos e veículos, com 32,6%, seguida de têxteis, roupas, calçados, móveis e brinquedos, com 15,1%.
Destinos das exportações de bens da Turquia: os 10 principais, 2025
| Posição | País | Exportações de bens | Participação | |
|---|---|---|---|---|
| 1 |
 Alemanha |
US$ 22,2 bi | 8,11% | vs Alemanha |
| 2 |
 Reino Unido |
US$ 16,8 bi | 6,14% | vs RU |
| 3 |
 Estados Unidos |
US$ 16,3 bi | 5,98% | vs EUA |
| 4 |
 Itália |
US$ 13,2 bi | 4,84% | vs Itália |
| 5 |
 Iraque |
US$ 12,4 bi | 4,53% | vs Iraque |
| 6 |
 França |
US$ 11,2 bi | 4,1% | vs França |
| 7 |
 Espanha |
US$ 10,4 bi | 3,81% | vs Espanha |
| 8 |
 EAU |
US$ 9,28 bi | 3,4% | |
| 9 |
 Romênia |
US$ 8,55 bi | 3,13% | vs Romênia |
| 10 |
 Países Baixos |
US$ 8,17 bi | 2,99% | vs Países Baixos |
| Outros parceiros e não especificados | US$ 145 bi | 53% |
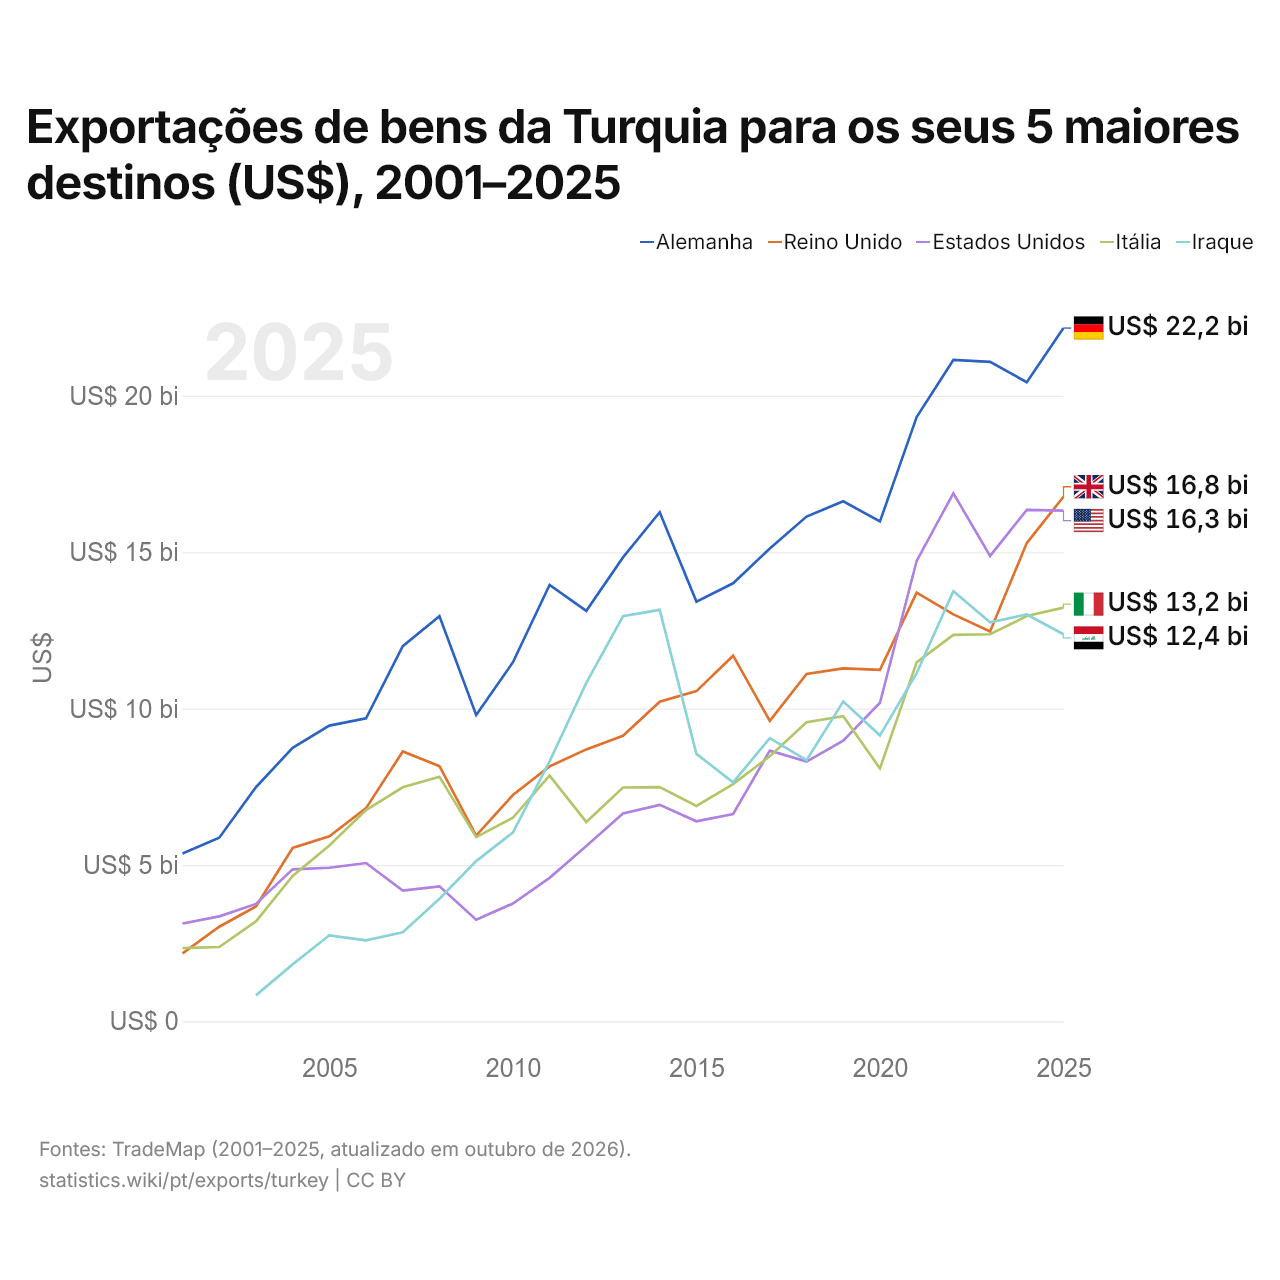
Exportações de bens da Turquia para os seus 5 maiores destinos (US$), 2001–2025
| Ano | US$ | ||||
|---|---|---|---|---|---|
| Alemanha | Reino Unido | Estados Unidos | Itália | Iraque | |
| 2025 | US$ 22.164.295.000 | US$ 16.771.231.000 | US$ 16.327.902.000 | US$ 13.224.439.000 | US$ 12.374.097.000 |
| 2024 | US$ 20.432.312.000 | US$ 15.289.517.000 | US$ 16.351.880.000 | US$ 12.956.297.000 | US$ 13.006.477.000 |
| 2023 | US$ 21.083.354.000 | US$ 12.463.116.000 | US$ 14.879.654.000 | US$ 12.373.834.000 | US$ 12.759.358.000 |
| 2022 | US$ 21.144.909.000 | US$ 13.010.911.000 | US$ 16.882.282.000 | US$ 12.353.974.000 | US$ 13.750.841.000 |
| 2021 | US$ 19.317.751.000 | US$ 13.705.148.000 | US$ 14.719.306.000 | US$ 11.474.990.000 | US$ 11.131.282.000 |
| 2020 | US$ 15.980.400.000 | US$ 11.236.969.000 | US$ 10.183.213.000 | US$ 8.082.942.000 | US$ 9.142.515.000 |
| 2019 | US$ 16.624.070.000 | US$ 11.281.350.000 | US$ 8.971.874.000 | US$ 9.754.698.000 | US$ 10.224.285.000 |
| 2018 | US$ 16.137.388.000 | US$ 11.107.336.000 | US$ 8.304.672.000 | US$ 9.560.597.000 | US$ 8.346.276.000 |
| 2017 | US$ 15.118.910.000 | US$ 9.603.189.000 | US$ 8.654.268.000 | US$ 8.473.629.000 | US$ 9.054.612.000 |
| 2016 | US$ 14.004.848.000 | US$ 11.690.650.000 | US$ 6.627.394.000 | US$ 7.583.132.000 | US$ 7.640.287.000 |
| 2015 | US$ 13.417.478.000 | US$ 10.556.863.000 | US$ 6.395.899.000 | US$ 6.887.778.000 | US$ 8.550.298.000 |
| 2014 | US$ 16.275.367.000 | US$ 10.216.479.000 | US$ 6.921.399.000 | US$ 7.486.545.000 | US$ 13.154.131.000 |
| 2013 | US$ 14.832.546.000 | US$ 9.126.733.000 | US$ 6.647.525.000 | US$ 7.474.685.000 | US$ 12.949.891.000 |
| 2012 | US$ 13.124.375.000 | US$ 8.693.599.000 | US$ 5.606.487.000 | US$ 6.373.488.000 | US$ 10.822.144.000 |
| 2011 | US$ 13.950.825.000 | US$ 8.151.430.000 | US$ 4.585.849.000 | US$ 7.854.463.000 | US$ 8.310.130.000 |
| 2010 | US$ 11.479.066.000 | US$ 7.235.861.000 | US$ 3.766.034.000 | US$ 6.507.052.000 | US$ 6.036.362.000 |
| 2009 | US$ 9.793.006.000 | US$ 5.937.997.000 | US$ 3.250.109.000 | US$ 5.889.622.000 | US$ 5.123.406.000 |
| 2008 | US$ 12.951.755.000 | US$ 8.158.669.000 | US$ 4.316.424.000 | US$ 7.820.270.000 | US$ 3.916.685.000 |
| 2007 | US$ 11.993.232.000 | US$ 8.626.776.000 | US$ 4.177.593.000 | US$ 7.480.711.000 | US$ 2.844.767.000 |
| 2006 | US$ 9.686.235.000 | US$ 6.814.301.000 | US$ 5.061.330.000 | US$ 6.752.991.000 | US$ 2.589.352.000 |
| 2005 | US$ 9.455.050.000 | US$ 5.917.163.000 | US$ 4.910.817.000 | US$ 5.618.164.000 | US$ 2.750.080.000 |
| 2004 | US$ 8.745.282.000 | US$ 5.544.303.000 | US$ 4.860.148.000 | US$ 4.649.422.000 | US$ 1.820.802.000 |
| 2003 | US$ 7.484.931.000 | US$ 3.670.093.000 | US$ 3.753.865.000 | US$ 3.194.797.000 | US$ 829.058.000 |
| 2002 | US$ 5.868.813.000 | US$ 3.024.942.000 | US$ 3.356.360.000 | US$ 2.375.994.000 | - |
| 2001 | US$ 5.366.680.000 | US$ 2.174.892.000 | US$ 3.125.804.000 | US$ 2.342.204.000 | - |
Em 2025, as exportações de bens foram de US$ 22,2 bilhões para a Alemanha, US$ 16,8 bilhões para o Reino Unido, US$ 16,3 bilhões para os Estados Unidos, US$ 13,2 bilhões para a Itália e US$ 12,4 bilhões para o Iraque. O primeiro lugar dos cinco destinos da Turquia ficou com a Alemanha em todos os anos desde 2001. A mudança mais recente nessa ordem foi em 2025, quando as exportações da Turquia para o Reino Unido superaram as exportações para os Estados Unidos.
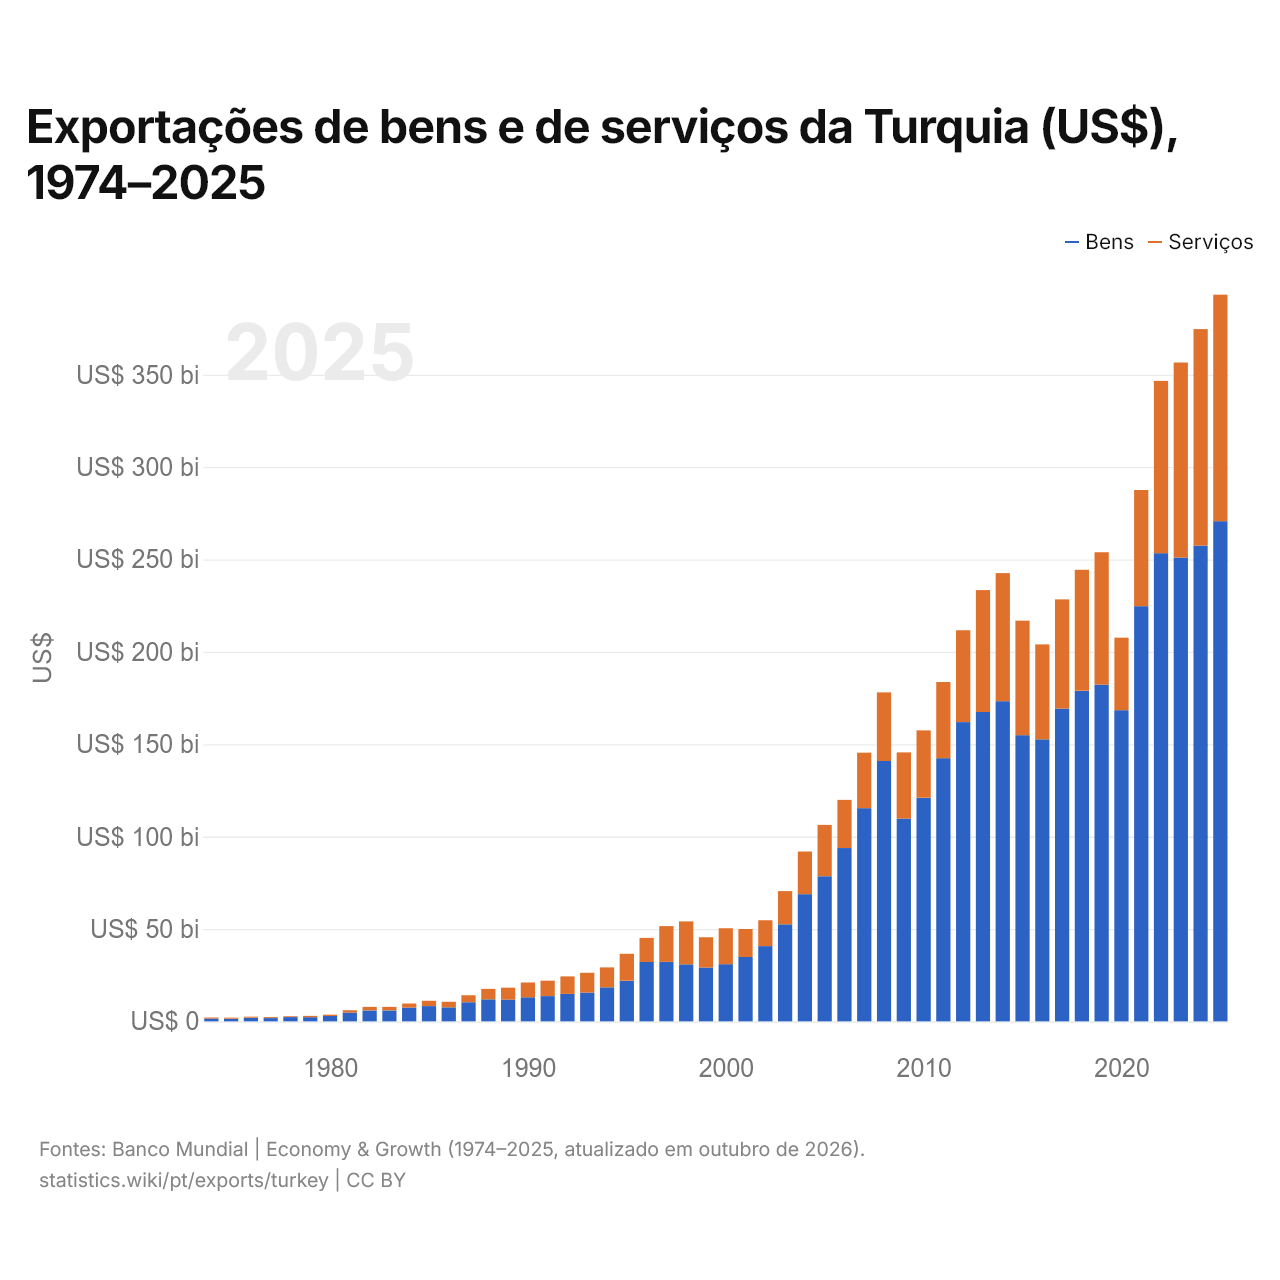
Exportações de bens e de serviços da Turquia (US$), 1974–2025
| Ano | US$ | |
|---|---|---|
| Bens | Serviços | |
| 2025 | US$ 270.673.000.000 | US$ 122.604.000.000 |
| 2024 | US$ 257.453.000.000 | US$ 117.189.000.000 |
| 2023 | US$ 250.994.000.000 | US$ 105.534.000.000 |
| 2022 | US$ 253.352.000.000 | US$ 93.250.000.000 |
| 2021 | US$ 224.673.000.000 | US$ 62.863.000.000 |
| 2020 | US$ 168.378.000.000 | US$ 39.256.000.000 |
| 2019 | US$ 182.200.000.000 | US$ 71.665.000.000 |
| 2018 | US$ 178.905.000.000 | US$ 65.470.000.000 |
| 2017 | US$ 169.214.000.000 | US$ 59.118.000.000 |
| 2016 | US$ 152.645.000.000 | US$ 51.382.000.000 |
| 2015 | US$ 154.865.000.000 | US$ 62.022.000.000 |
| 2014 | US$ 173.292.000.000 | US$ 69.311.000.000 |
| 2013 | US$ 167.397.000.000 | US$ 65.981.000.000 |
| 2012 | US$ 161.948.000.000 | US$ 49.690.000.000 |
| 2011 | US$ 142.392.000.000 | US$ 41.255.000.000 |
| 2010 | US$ 120.992.000.000 | US$ 36.449.000.000 |
| 2009 | US$ 109.732.000.000 | US$ 35.816.000.000 |
| 2008 | US$ 140.906.000.000 | US$ 37.112.000.000 |
| 2007 | US$ 115.379.000.000 | US$ 30.006.000.000 |
| 2006 | US$ 93.778.000.000 | US$ 26.093.000.000 |
| 2005 | US$ 78.509.000.000 | US$ 27.822.000.000 |
| 2004 | US$ 68.833.000.000 | US$ 23.085.000.000 |
| 2003 | US$ 52.472.000.000 | US$ 18.030.000.000 |
| 2002 | US$ 40.705.000.000 | US$ 14.045.000.000 |
| 2001 | US$ 34.810.000.000 | US$ 15.153.000.000 |
| 2000 | US$ 30.923.000.000 | US$ 19.430.000.000 |
| 1999 | US$ 29.135.000.000 | US$ 16.347.000.000 |
| 1998 | US$ 30.852.000.000 | US$ 23.265.000.000 |
| 1997 | US$ 32.195.000.000 | US$ 19.333.000.000 |
| 1996 | US$ 32.142.000.000 | US$ 13.008.000.000 |
| 1995 | US$ 21.975.000.000 | US$ 14.606.000.000 |
| 1994 | US$ 18.390.000.000 | US$ 10.801.000.000 |
| 1993 | US$ 15.611.000.000 | US$ 10.652.000.000 |
| 1992 | US$ 14.891.000.000 | US$ 9.407.000.000 |
| 1991 | US$ 13.667.000.000 | US$ 8.372.000.000 |
| 1990 | US$ 13.026.000.000 | US$ 8.016.000.000 |
| 1989 | US$ 11.780.000.000 | US$ 6.414.000.000 |
| 1988 | US$ 11.929.000.000 | US$ 5.652.000.000 |
| 1987 | US$ 10.322.000.000 | US$ 3.813.000.000 |
| 1986 | US$ 7.583.000.000 | US$ 2.997.000.000 |
| 1985 | US$ 8.255.000.000 | US$ 2.864.000.000 |
| 1984 | US$ 7.389.000.000 | US$ 2.220.000.000 |
| 1983 | US$ 5.905.000.000 | US$ 1.939.000.000 |
| 1982 | US$ 5.890.000.000 | US$ 1.918.000.000 |
| 1981 | US$ 4.703.000.000 | US$ 1.264.000.000 |
| 1980 | US$ 2.910.000.000 | US$ 711.000.000 |
| 1979 | US$ 2.261.000.000 | US$ 674.000.000 |
| 1978 | US$ 2.288.000.000 | US$ 467.000.000 |
| 1977 | US$ 1.753.000.000 | US$ 534.000.000 |
| 1976 | US$ 1.960.000.000 | US$ 580.000.000 |
| 1975 | US$ 1.401.000.000 | US$ 616.000.000 |
| 1974 | US$ 1.532.000.000 | US$ 549.000.000 |
Em 2025, as exportações de bens da Turquia foram de US$ 271 bilhões e as de serviços, de US$ 123 bilhões; os serviços representaram 31,2% do total, ante 26,4% em 1974.
A Turquia na classificação mundial de exportações, 2025
| Posição | País | Exportações | Participação mundial | |
|---|---|---|---|---|
| 23 |
 Austrália |
US$ 418 bi | 1,2% | vs Austrália |
| 24 |
 Tailândia |
US$ 411 bi | 1,18% | vs Tailândia |
| 25 |
 Brasil |
US$ 406 bi | 1,16% | vs Brasil |
| 26 |
 Turquia |
US$ 397 bi | 1,14% | |
| 27 |
 Arábia Saudita |
US$ 380 bi | 1,09% | vs Arábia Saudita |
| 28 |
 Suécia |
US$ 356 bi | 1,02% | |
| 29 |
 Malásia |
US$ 335 bi | 0,96% | vs Malásia |
Exportações de bens e serviços da Turquia, % do PIB, 1960–2025
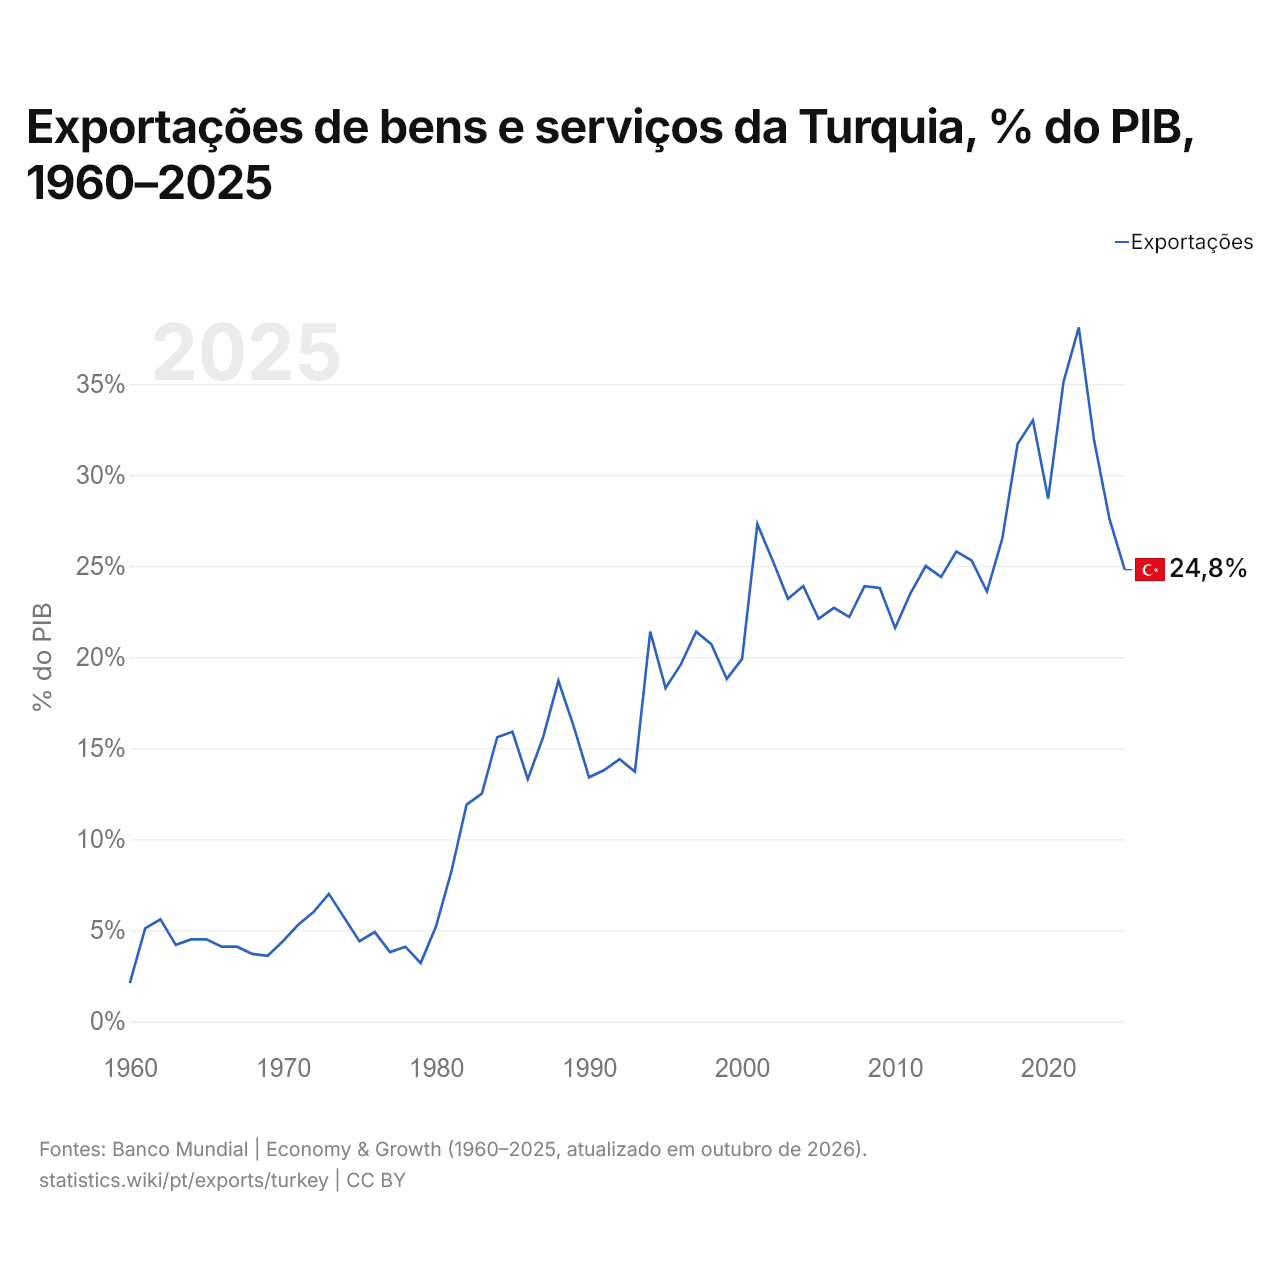
Em 2025, as exportações de bens e serviços da Turquia equivaleram a 24,8% do seu PIB, ante 2,1% em 1960. A maior participação foi de 38,1%, em 2022.
Comparar as exportações da Turquia com as de outros países
Fontes:
- TradeMap (2001–2025, atualizado em outubro de 2026)
- Banco Mundial | Economy & Growth (1960–2025, atualizado em outubro de 2026)
Creative Commons Atribuição (CC BY): você pode copiar, compartilhar, adaptar e reutilizar este conteúdo, inclusive para fins comerciais, desde que cite o statistics.wiki e indique as alterações que fizer. As fontes listadas acima podem ter suas próprias condições de licença.