
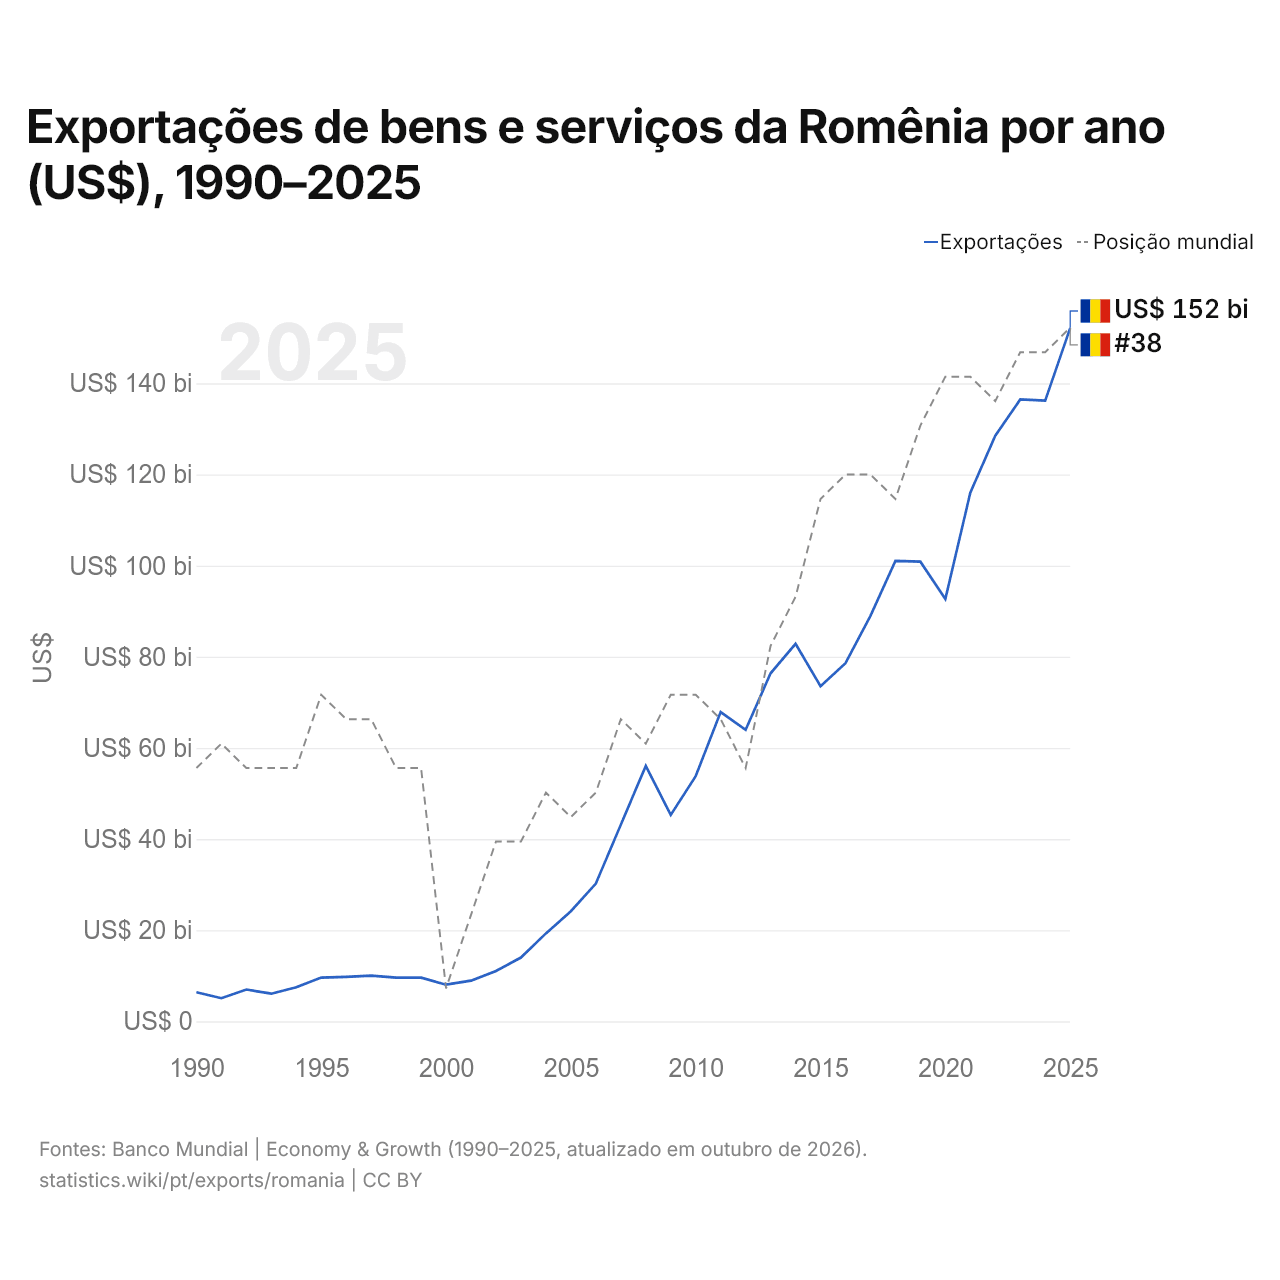
Exportações de bens e serviços da Romênia por ano (US$), 1990–2025
| Ano | US$ | Posição mundial |
|---|---|---|
| Exportações | Posição mundial | |
| 2025 | US$ 152.113.432.502 | #38 |
| 2024 | US$ 136.204.440.675 | #39 |
| 2023 | US$ 136.476.225.871 | #39 |
| 2022 | US$ 128.501.972.912 | #41 |
| 2021 | US$ 116.008.484.761 | #40 |
| 2020 | US$ 92.658.765.316 | #40 |
| 2019 | US$ 100.870.449.571 | #42 |
| 2018 | US$ 101.030.592.267 | #45 |
| 2017 | US$ 88.964.370.565 | #44 |
| 2016 | US$ 78.593.549.490 | #44 |
| 2015 | US$ 73.554.067.275 | #45 |
| 2014 | US$ 82.838.251.211 | #49 |
| 2013 | US$ 76.385.138.211 | #51 |
| 2012 | US$ 63.959.863.906 | #56 |
| 2011 | US$ 67.874.157.648 | #54 |
| 2010 | US$ 53.811.070.204 | #53 |
| 2009 | US$ 45.307.699.245 | #53 |
| 2008 | US$ 56.055.402.885 | #55 |
| 2007 | US$ 43.142.335.692 | #54 |
| 2006 | US$ 30.226.776.025 | #57 |
| 2005 | US$ 24.155.999.359 | #58 |
| 2004 | US$ 19.301.170.435 | #57 |
| 2003 | US$ 13.996.506.634 | #59 |
| 2002 | US$ 11.061.722.688 | #59 |
| 2001 | US$ 8.929.729.715 | #62 |
| 2000 | US$ 8.042.666.726 | #65 |
| 1999 | US$ 9.585.764.933 | #56 |
| 1998 | US$ 9.596.555.943 | #56 |
| 1997 | US$ 10.031.194.458 | #54 |
| 1996 | US$ 9.772.624.067 | #54 |
| 1995 | US$ 9.593.366.383 | #53 |
| 1994 | US$ 7.488.535.367 | #56 |
| 1993 | US$ 6.067.363.989 | #56 |
| 1992 | US$ 6.981.666.667 | #56 |
| 1991 | US$ 5.077.889.776 | #55 |
| 1990 | US$ 6.397.681.676 | #56 |
Em 2025, as exportações de bens e serviços da Romênia foram de US$ 152 bilhões, ante US$ 6,4 bilhões em 1990. O mínimo foi de US$ 5,08 bilhões, em 1991. Foram as 38ª maiores do mundo; em 2024, eram as 39ª.
Em 2025, as exportações de bens e serviços da Romênia foram as 19ª maiores de 41 países da Europa. As importações de bens e serviços da Romênia foram de US$ 175 bilhões em 2025, as 36ª maiores do mundo. Em 2025, as importações da Romênia superaram as exportações em US$ 22,5 bilhões, um déficit comercial.
Exportações de bens da Romênia por categoria, 2025
Exportações de bens, 2025: US$ 109 bi
Em 2025, a maior categoria das exportações de bens da Romênia foi máquinas, eletrônicos e veículos, com 49,7%, seguida de petróleo, gás, minérios e outras matérias-primas, com 10,0%.
Destinos das exportações de bens da Romênia: os 10 principais, 2025
| Posição | País | Exportações de bens | Participação | |
|---|---|---|---|---|
| 1 |
 Alemanha |
US$ 21,8 bi | 20% | vs Alemanha |
| 2 |
 Itália |
US$ 9,70 bi | 8,9% | vs Itália |
| 3 |
 França |
US$ 6,84 bi | 6,27% | |
| 4 |
 Hungria |
US$ 6,03 bi | 5,53% | vs Hungria |
| 5 |
 Bulgária |
US$ 4,71 bi | 4,32% | vs Bulgária |
| 6 |
 Países Baixos |
US$ 4,46 bi | 4,09% | vs Países Baixos |
| 7 |
 Turquia |
US$ 4,38 bi | 4,02% | vs Turquia |
| 8 |
 Polônia |
US$ 4,36 bi | 4% | vs Polônia |
| 9 |
 Tchéquia |
US$ 3,53 bi | 3,24% | vs Tchéquia |
| 10 |
 Moldávia |
US$ 3,27 bi | 3% | vs Moldávia |
| Outros parceiros e não especificados | US$ 40,0 bi | 36,7% |
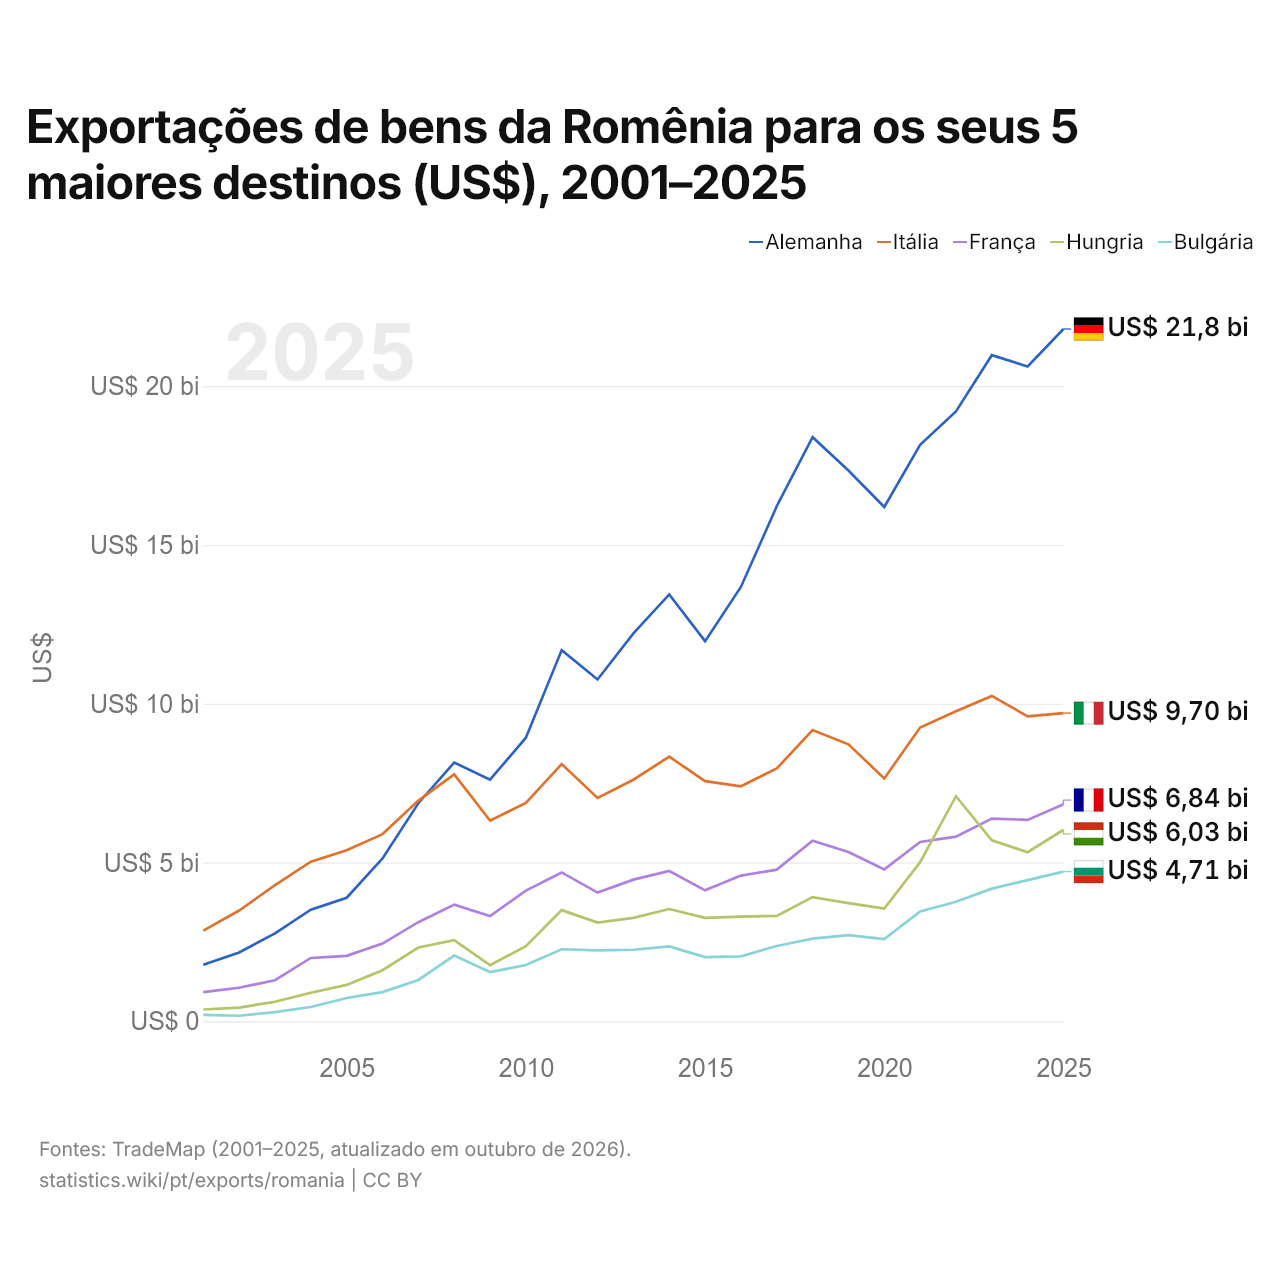
Exportações de bens da Romênia para os seus 5 maiores destinos (US$), 2001–2025
| Ano | US$ | ||||
|---|---|---|---|---|---|
| Alemanha | Itália | França | Hungria | Bulgária | |
| 2025 | US$ 21.797.351.000 | US$ 9.704.591.000 | US$ 6.837.188.000 | US$ 6.031.357.000 | US$ 4.714.052.000 |
| 2024 | US$ 20.618.520.000 | US$ 9.602.414.000 | US$ 6.342.364.000 | US$ 5.325.393.000 | US$ 4.447.093.000 |
| 2023 | US$ 20.973.002.000 | US$ 10.244.686.000 | US$ 6.383.473.000 | US$ 5.698.841.000 | US$ 4.178.331.000 |
| 2022 | US$ 19.202.057.000 | US$ 9.761.670.000 | US$ 5.815.442.000 | US$ 7.088.133.000 | US$ 3.763.155.000 |
| 2021 | US$ 18.153.087.000 | US$ 9.251.499.000 | US$ 5.647.386.000 | US$ 5.011.873.000 | US$ 3.459.541.000 |
| 2020 | US$ 16.193.180.000 | US$ 7.645.913.000 | US$ 4.782.411.000 | US$ 3.547.298.000 | US$ 2.588.939.000 |
| 2019 | US$ 17.343.320.000 | US$ 8.722.038.000 | US$ 5.330.921.000 | US$ 3.723.309.000 | US$ 2.716.467.000 |
| 2018 | US$ 18.391.579.000 | US$ 9.169.956.000 | US$ 5.686.512.000 | US$ 3.909.901.000 | US$ 2.603.494.000 |
| 2017 | US$ 16.217.812.000 | US$ 7.961.226.000 | US$ 4.776.154.000 | US$ 3.320.944.000 | US$ 2.372.988.000 |
| 2016 | US$ 13.675.875.000 | US$ 7.400.000.000 | US$ 4.589.081.000 | US$ 3.295.009.000 | US$ 2.047.435.000 |
| 2015 | US$ 11.969.665.000 | US$ 7.561.315.000 | US$ 4.124.736.000 | US$ 3.259.095.000 | US$ 2.021.623.000 |
| 2014 | US$ 13.440.966.000 | US$ 8.332.586.000 | US$ 4.733.135.000 | US$ 3.536.216.000 | US$ 2.359.220.000 |
| 2013 | US$ 12.215.477.000 | US$ 7.606.651.000 | US$ 4.461.131.000 | US$ 3.257.143.000 | US$ 2.254.353.000 |
| 2012 | US$ 10.762.246.000 | US$ 7.033.430.000 | US$ 4.052.581.000 | US$ 3.110.201.000 | US$ 2.231.553.000 |
| 2011 | US$ 11.687.889.000 | US$ 8.099.369.000 | US$ 4.688.019.000 | US$ 3.501.243.000 | US$ 2.270.265.000 |
| 2010 | US$ 8.928.650.000 | US$ 6.878.057.000 | US$ 4.115.436.000 | US$ 2.364.258.000 | US$ 1.771.007.000 |
| 2009 | US$ 7.607.412.000 | US$ 6.318.173.000 | US$ 3.316.366.000 | US$ 1.769.623.000 | US$ 1.550.931.000 |
| 2008 | US$ 8.148.007.000 | US$ 7.774.655.000 | US$ 3.673.697.000 | US$ 2.556.428.000 | US$ 2.072.042.000 |
| 2007 | US$ 6.867.377.000 | US$ 6.949.538.000 | US$ 3.120.872.000 | US$ 2.324.768.000 | US$ 1.301.868.000 |
| 2006 | US$ 5.130.532.000 | US$ 5.894.503.000 | US$ 2.446.195.000 | US$ 1.610.586.000 | US$ 919.989.000 |
| 2005 | US$ 3.890.606.000 | US$ 5.383.704.000 | US$ 2.063.080.000 | US$ 1.147.259.000 | US$ 735.150.000 |
| 2004 | US$ 3.513.899.000 | US$ 5.025.275.000 | US$ 1.994.744.000 | US$ 898.109.000 | US$ 451.280.000 |
| 2003 | US$ 2.771.025.000 | US$ 4.288.322.000 | US$ 1.295.174.000 | US$ 617.172.000 | US$ 289.216.000 |
| 2002 | US$ 2.165.526.000 | US$ 3.488.530.000 | US$ 1.056.154.000 | US$ 431.038.000 | US$ 176.615.000 |
| 2001 | US$ 1.781.128.000 | US$ 2.853.966.000 | US$ 918.979.000 | US$ 371.466.000 | US$ 202.170.000 |
Em 2025, as exportações de bens foram de US$ 21,8 bilhões para a Alemanha, US$ 9,7 bilhões para a Itália, US$ 6,84 bilhões para a França, US$ 6,03 bilhões para a Hungria e US$ 4,71 bilhões para a Bulgária. O primeiro lugar dos cinco destinos da Romênia fica com a Alemanha desde 2008. A mudança mais recente nessa ordem foi em 2023, quando as exportações da Romênia para a França superaram as exportações para a Hungria.
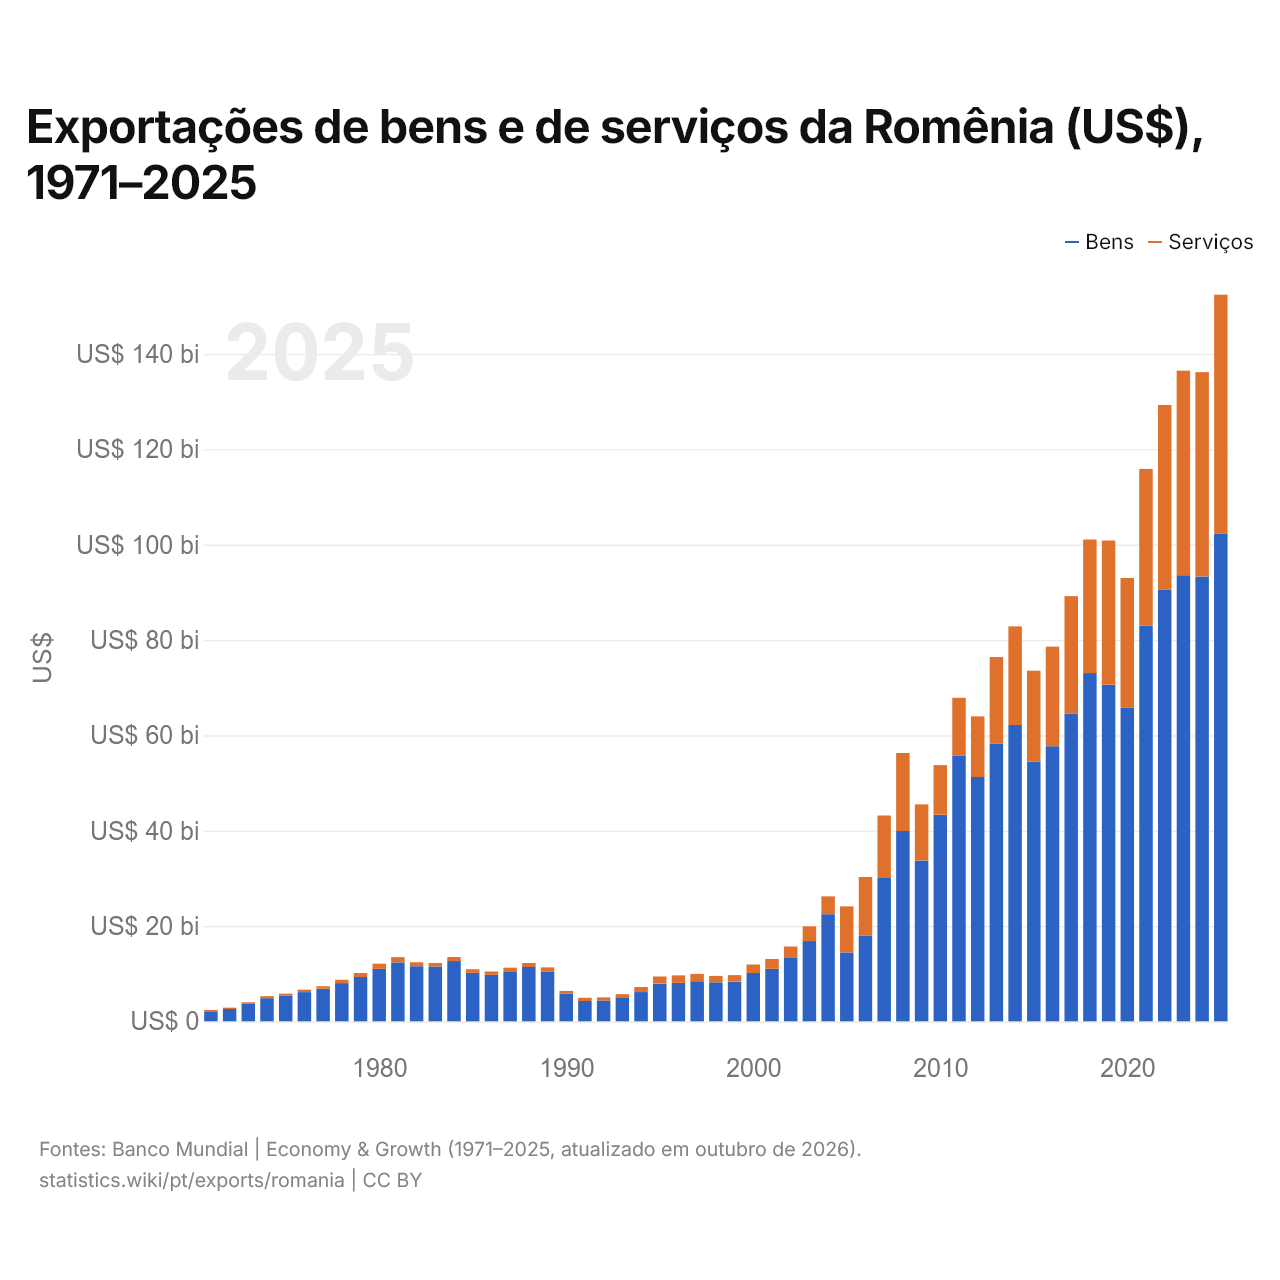
Exportações de bens e de serviços da Romênia (US$), 1971–2025
| Ano | US$ | |
|---|---|---|
| Bens | Serviços | |
| 2025 | US$ 102.366.257.574 | US$ 50.061.495.301 |
| 2024 | US$ 93.290.447.809 | US$ 42.886.218.650 |
| 2023 | US$ 93.566.726.931 | US$ 42.920.721.848 |
| 2022 | US$ 90.527.724.907 | US$ 38.757.962.221 |
| 2021 | US$ 82.964.854.563 | US$ 32.909.210.226 |
| 2020 | US$ 65.859.398.891 | US$ 27.145.025.355 |
| 2019 | US$ 70.622.099.296 | US$ 30.240.338.401 |
| 2018 | US$ 73.050.449.613 | US$ 28.007.732.328 |
| 2017 | US$ 64.585.299.890 | US$ 24.594.588.932 |
| 2016 | US$ 57.715.591.931 | US$ 20.884.911.476 |
| 2015 | US$ 54.502.076.901 | US$ 19.050.853.405 |
| 2014 | US$ 62.164.702.975 | US$ 20.692.073.726 |
| 2013 | US$ 58.312.628.708 | US$ 18.102.045.640 |
| 2012 | US$ 51.267.857.469 | US$ 12.692.032.820 |
| 2011 | US$ 55.793.768.176 | US$ 12.085.197.402 |
| 2010 | US$ 43.347.321.846 | US$ 10.380.510.348 |
| 2009 | US$ 33.710.931.123 | US$ 11.798.530.483 |
| 2008 | US$ 39.933.517.650 | US$ 16.356.330.994 |
| 2007 | US$ 30.070.071.881 | US$ 13.092.354.292 |
| 2006 | US$ 18.002.765.601 | US$ 12.268.192.991 |
| 2005 | US$ 14.451.881.702 | US$ 9.668.082.197 |
| 2004 | US$ 22.478.000.000 | US$ 3.742.000.000 |
| 2003 | US$ 16.843.000.000 | US$ 3.080.000.000 |
| 2002 | US$ 13.293.000.000 | US$ 2.410.000.000 |
| 2001 | US$ 11.016.000.000 | US$ 2.058.000.000 |
| 2000 | US$ 10.143.000.000 | US$ 1.762.000.000 |
| 1999 | US$ 8.307.000.000 | US$ 1.380.000.000 |
| 1998 | US$ 8.189.000.000 | US$ 1.332.000.000 |
| 1997 | US$ 8.403.000.000 | US$ 1.543.000.000 |
| 1996 | US$ 8.068.000.000 | US$ 1.572.000.000 |
| 1995 | US$ 7.900.000.000 | US$ 1.503.000.000 |
| 1994 | US$ 6.146.000.000 | US$ 1.049.000.000 |
| 1993 | US$ 4.892.000.000 | US$ 799.000.000 |
| 1992 | US$ 4.364.000.000 | US$ 659.000.000 |
| 1991 | US$ 4.266.000.000 | US$ 680.000.000 |
| 1990 | US$ 5.770.000.000 | US$ 610.000.000 |
| 1989 | US$ 10.487.000.000 | US$ 834.000.000 |
| 1988 | US$ 11.392.000.000 | US$ 850.000.000 |
| 1987 | US$ 10.491.000.000 | US$ 770.000.000 |
| 1986 | US$ 9.763.000.000 | US$ 681.000.000 |
| 1985 | US$ 10.174.000.000 | US$ 746.000.000 |
| 1984 | US$ 12.646.000.000 | US$ 840.000.000 |
| 1983 | US$ 11.512.000.000 | US$ 727.000.000 |
| 1982 | US$ 11.559.000.000 | US$ 825.000.000 |
| 1981 | US$ 12.367.000.000 | US$ 1.095.000.000 |
| 1980 | US$ 11.024.000.000 | US$ 1.063.000.000 |
| 1979 | US$ 9.303.000.000 | US$ 830.000.000 |
| 1978 | US$ 8.022.000.000 | US$ 706.000.000 |
| 1977 | US$ 6.859.000.000 | US$ 498.000.000 |
| 1976 | US$ 6.134.000.000 | US$ 508.000.000 |
| 1975 | US$ 5.341.000.000 | US$ 471.000.000 |
| 1974 | US$ 4.858.000.000 | US$ 419.000.000 |
| 1973 | US$ 3.667.000.000 | US$ 338.000.000 |
| 1972 | US$ 2.599.000.000 | US$ 265.000.000 |
| 1971 | US$ 2.102.000.000 | US$ 280.000.000 |
Em 2025, as exportações de bens da Romênia foram de US$ 102 bilhões e as de serviços, de US$ 50,1 bilhões; os serviços representaram 32,8% do total, ante 11,8% em 1971.
A Romênia na classificação mundial de exportações, 2025
| Posição | País | Exportações | Participação mundial | |
|---|---|---|---|---|
| 35 |
 Luxemburgo |
US$ 193 bi | 0,55% | vs Luxemburgo |
| 36 |
Hungria
|
US$ 179 bi | 0,51% | vs Hungria |
| 37 |
 Israel |
US$ 168 bi | 0,48% | |
| 38 |
 Romênia |
US$ 152 bi | 0,44% | |
| 39 |
 Portugal |
US$ 151 bi | 0,43% | vs Portugal |
| 40 |
 Finlândia |
US$ 134 bi | 0,38% | |
| 41 |
 África do Sul |
US$ 134 bi | 0,38% |
Exportações de bens e serviços da Romênia, % do PIB, 1990–2025
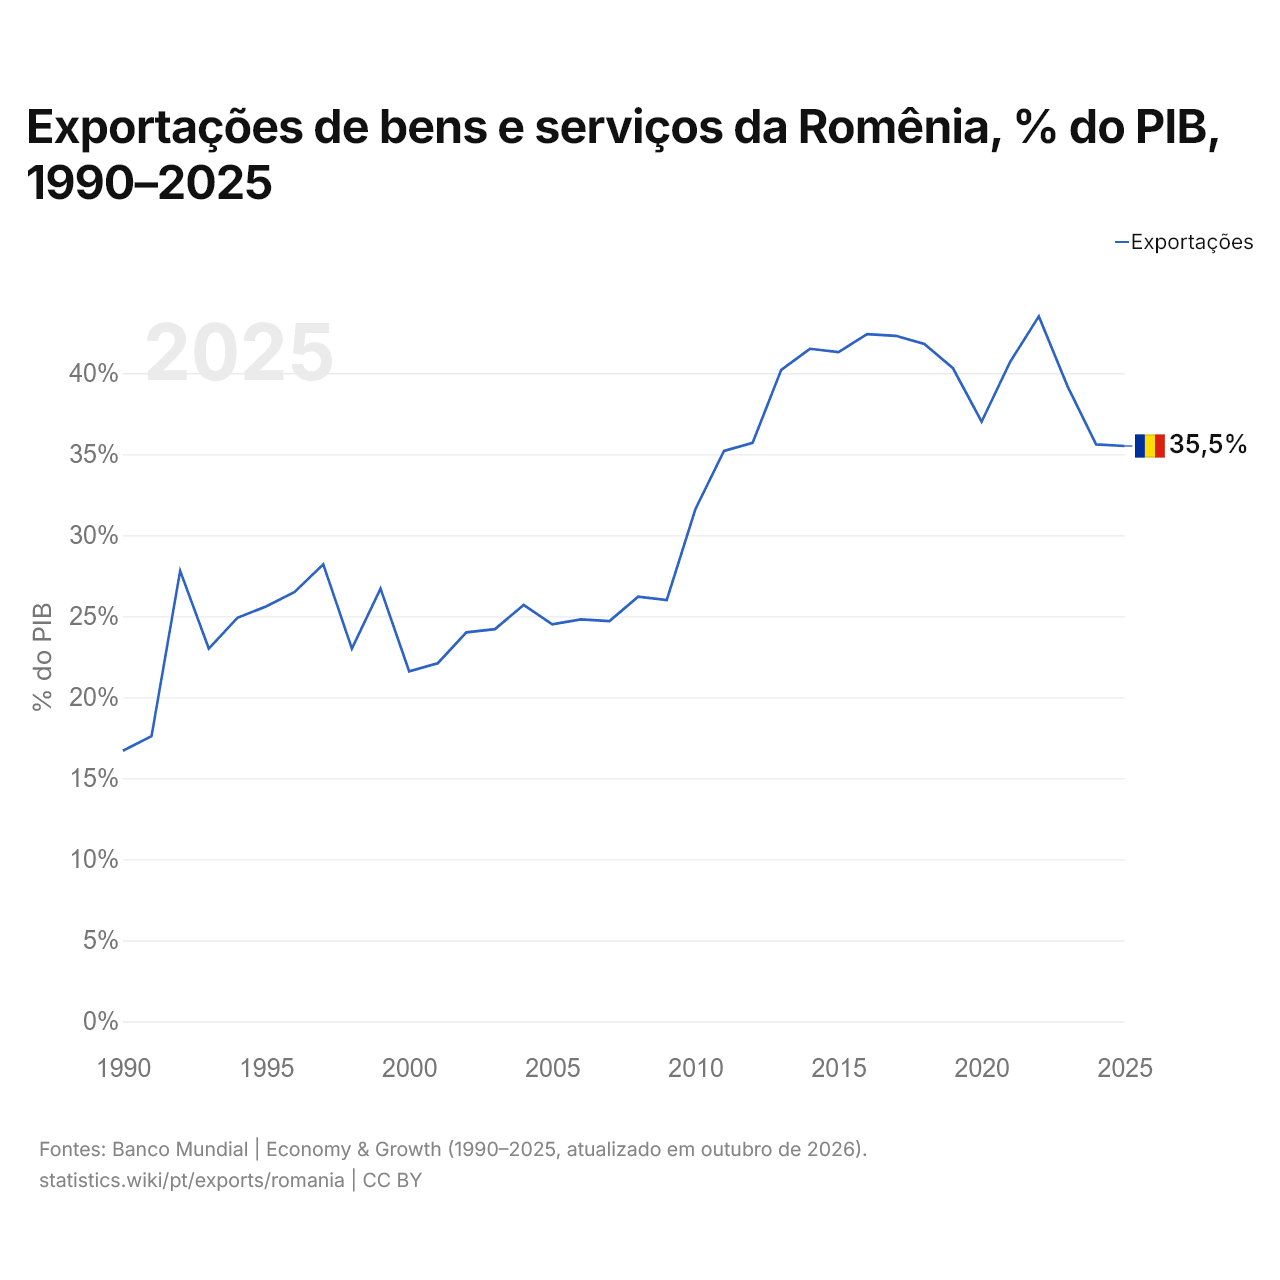
Em 2025, as exportações de bens e serviços da Romênia equivaleram a 35,5% do seu PIB, ante 16,7% em 1990. A maior participação foi de 43,5%, em 2022.
Comparar as exportações da Romênia com as de outros países
Fontes:
- TradeMap (2001–2025, atualizado em outubro de 2026)
- Banco Mundial | Economy & Growth (1971–2025, atualizado em outubro de 2026)
Creative Commons Atribuição (CC BY): você pode copiar, compartilhar, adaptar e reutilizar este conteúdo, inclusive para fins comerciais, desde que cite o statistics.wiki e indique as alterações que fizer. As fontes listadas acima podem ter suas próprias condições de licença.