
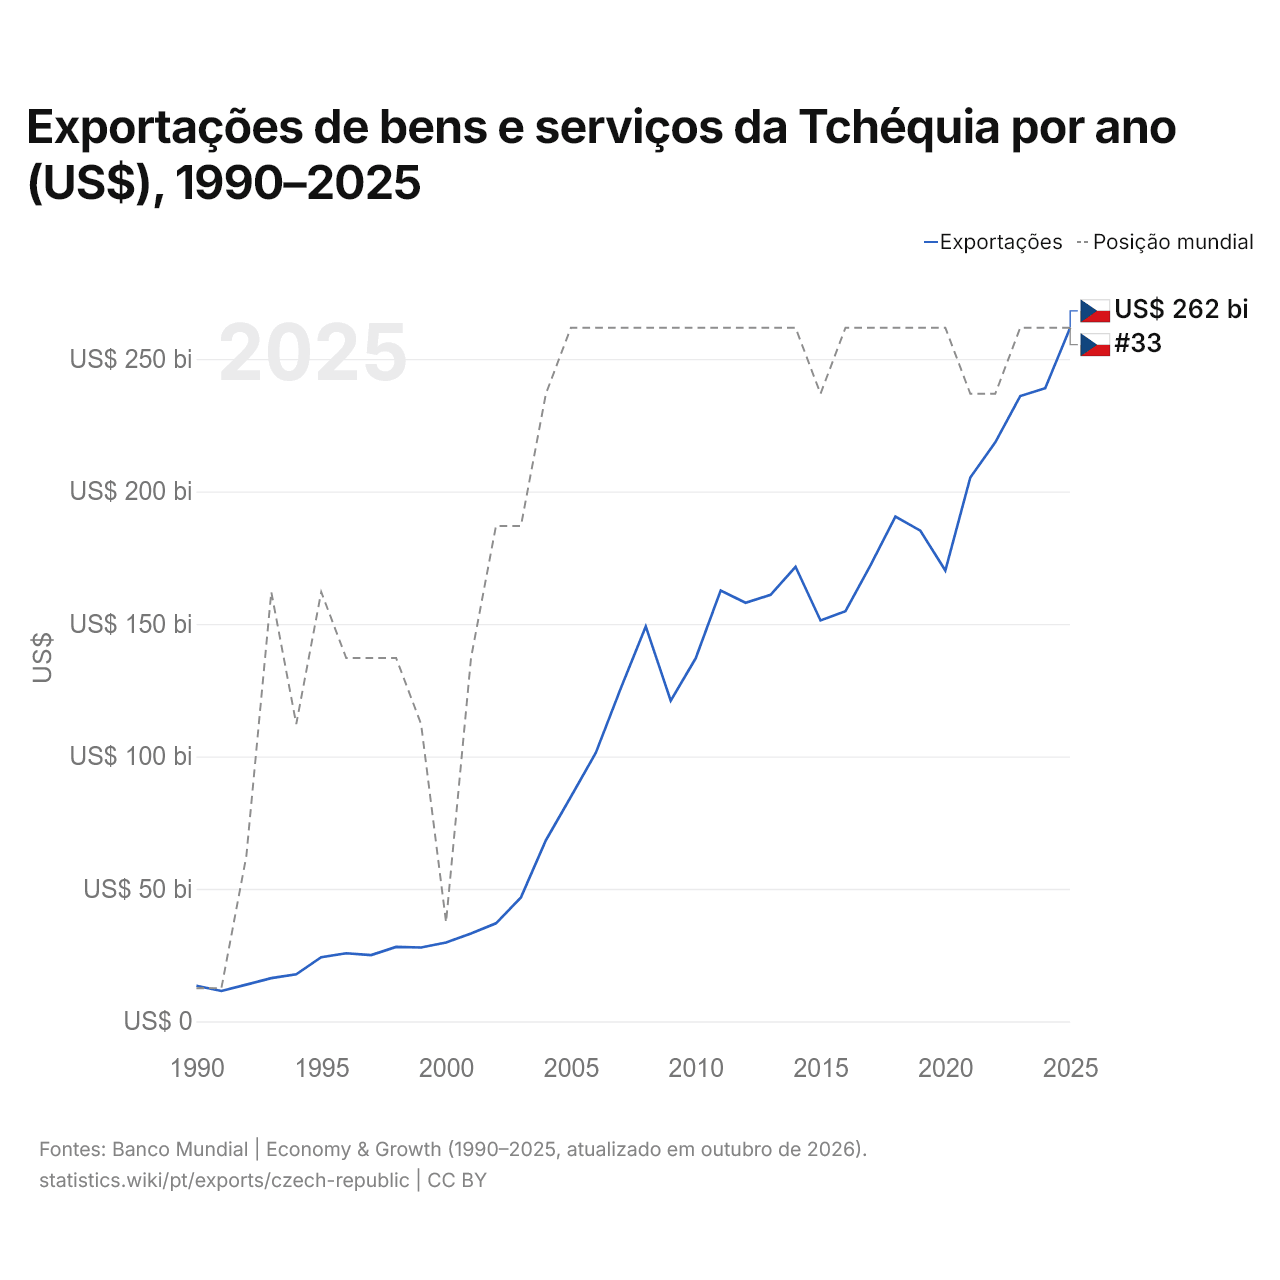
Exportações de bens e serviços da Tchéquia por ano (US$), 1990–2025
| Ano | US$ | Posição mundial |
|---|---|---|
| Exportações | Posição mundial | |
| 2025 | US$ 261.773.375.377 | #33 |
| 2024 | US$ 238.995.944.035 | #33 |
| 2023 | US$ 236.031.278.977 | #33 |
| 2022 | US$ 218.554.266.387 | #34 |
| 2021 | US$ 205.281.381.421 | #34 |
| 2020 | US$ 170.154.349.910 | #33 |
| 2019 | US$ 185.212.440.995 | #33 |
| 2018 | US$ 190.530.873.335 | #33 |
| 2017 | US$ 172.120.406.679 | #33 |
| 2016 | US$ 154.779.987.657 | #33 |
| 2015 | US$ 151.309.924.285 | #34 |
| 2014 | US$ 171.578.513.790 | #33 |
| 2013 | US$ 161.004.654.094 | #33 |
| 2012 | US$ 157.992.900.013 | #33 |
| 2011 | US$ 162.580.614.172 | #33 |
| 2010 | US$ 137.030.722.710 | #33 |
| 2009 | US$ 121.028.432.041 | #33 |
| 2008 | US$ 149.079.880.738 | #33 |
| 2007 | US$ 125.712.955.252 | #33 |
| 2006 | US$ 101.376.993.751 | #33 |
| 2005 | US$ 84.772.805.062 | #33 |
| 2004 | US$ 68.363.528.121 | #34 |
| 2003 | US$ 46.770.321.529 | #36 |
| 2002 | US$ 36.991.594.021 | #36 |
| 2001 | US$ 33.128.639.673 | #38 |
| 2000 | US$ 29.733.777.254 | #42 |
| 1999 | US$ 27.868.246.879 | #39 |
| 1998 | US$ 28.093.534.317 | #38 |
| 1997 | US$ 25.027.225.177 | #38 |
| 1996 | US$ 25.697.102.987 | #38 |
| 1995 | US$ 24.185.606.631 | #37 |
| 1994 | US$ 17.751.255.168 | #39 |
| 1993 | US$ 16.321.369.053 | #37 |
| 1992 | US$ 13.872.829.183 | #41 |
| 1991 | US$ 11.474.470.977 | #43 |
| 1990 | US$ 13.409.039.102 | #43 |
Em 2025, as exportações de bens e serviços da Tchéquia foram de US$ 262 bilhões, ante US$ 13,4 bilhões em 1990. O mínimo foi de US$ 11,5 bilhões, em 1991. Foram as 33ª maiores do mundo, posição que mantêm desde 2023.
Em 2025, as exportações de bens e serviços da Tchéquia foram as 15ª maiores de 41 países da Europa. As importações de bens e serviços da Tchéquia foram de US$ 239 bilhões em 2025, as 33ª maiores do mundo. Em 2025, as exportações da Tchéquia superaram as importações em US$ 22,9 bilhões, um superávit comercial.
Exportações de bens da Tchéquia por categoria, 2025
Exportações de bens, 2025: US$ 282 bi
Em 2025, a maior categoria das exportações de bens da Tchéquia foi máquinas, eletrônicos e veículos, com 62,2%, seguida de têxteis, roupas, calçados, móveis e brinquedos, com 8,8%.
Destinos das exportações de bens da Tchéquia: os 10 principais, 2025
| Posição | País | Exportações de bens | Participação | |
|---|---|---|---|---|
| 1 |
 Alemanha |
US$ 88,9 bi | 31,5% | vs Alemanha |
| 2 |
 Eslováquia |
US$ 21,1 bi | 7,48% | vs Eslováquia |
| 3 |
 Polônia |
US$ 20,7 bi | 7,35% | vs Polônia |
| 4 |
 França |
US$ 13,7 bi | 4,87% | |
| 5 |
 Reino Unido |
US$ 12,0 bi | 4,24% | |
| 6 |
 Áustria |
US$ 11,4 bi | 4,02% | vs Áustria |
| 7 |
 Itália |
US$ 10,8 bi | 3,82% | vs Itália |
| 8 |
 Países Baixos |
US$ 8,84 bi | 3,13% | |
| 9 |
 Hungria |
US$ 8,79 bi | 3,12% | vs Hungria |
| 10 |
 Estados Unidos |
US$ 7,64 bi | 2,71% | |
| Outros parceiros e não especificados | US$ 78,2 bi | 27,7% |
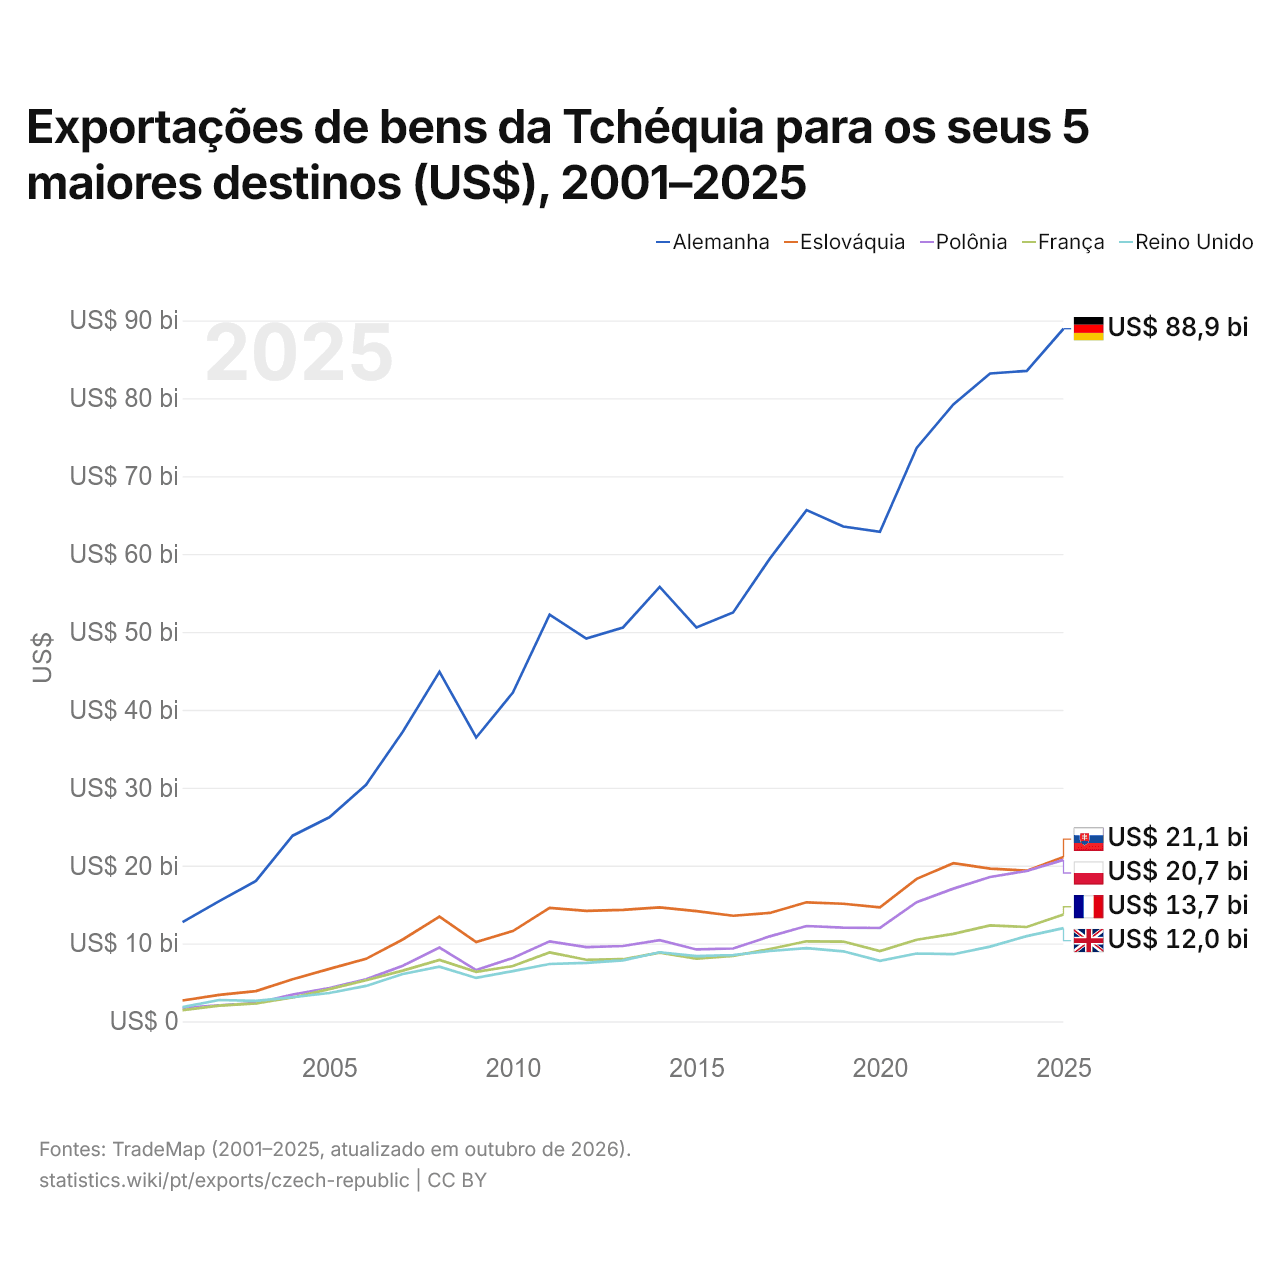
Exportações de bens da Tchéquia para os seus 5 maiores destinos (US$), 2001–2025
| Ano | US$ | ||||
|---|---|---|---|---|---|
| Alemanha | Eslováquia | Polônia | França | Reino Unido | |
| 2025 | US$ 88.928.287.000 | US$ 21.097.062.000 | US$ 20.729.737.000 | US$ 13.721.760.000 | US$ 11.962.070.000 |
| 2024 | US$ 83.519.431.000 | US$ 19.347.595.000 | US$ 19.308.154.000 | US$ 12.113.964.000 | US$ 10.937.475.000 |
| 2023 | US$ 83.188.060.000 | US$ 19.610.030.000 | US$ 18.526.540.000 | US$ 12.313.965.000 | US$ 9.594.023.000 |
| 2022 | US$ 79.220.953.000 | US$ 20.298.524.000 | US$ 17.039.837.000 | US$ 11.232.564.000 | US$ 8.621.292.000 |
| 2021 | US$ 73.620.759.000 | US$ 18.298.004.000 | US$ 15.288.845.000 | US$ 10.469.127.000 | US$ 8.713.227.000 |
| 2020 | US$ 62.861.382.000 | US$ 14.639.239.000 | US$ 11.988.404.000 | US$ 9.024.393.000 | US$ 7.776.496.000 |
| 2019 | US$ 63.526.531.000 | US$ 15.099.748.000 | US$ 12.027.950.000 | US$ 10.243.179.000 | US$ 8.990.745.000 |
| 2018 | US$ 65.641.693.000 | US$ 15.284.559.000 | US$ 12.235.365.000 | US$ 10.274.895.000 | US$ 9.398.883.000 |
| 2017 | US$ 59.413.682.000 | US$ 13.920.841.000 | US$ 10.912.335.000 | US$ 9.284.502.000 | US$ 9.026.391.000 |
| 2016 | US$ 52.492.419.000 | US$ 13.554.032.000 | US$ 9.349.784.000 | US$ 8.393.055.000 | US$ 8.519.963.000 |
| 2015 | US$ 50.567.277.000 | US$ 14.145.819.000 | US$ 9.228.941.000 | US$ 8.044.975.000 | US$ 8.371.820.000 |
| 2014 | US$ 55.775.424.000 | US$ 14.640.789.000 | US$ 10.415.027.000 | US$ 8.829.540.000 | US$ 8.871.428.000 |
| 2013 | US$ 50.566.481.000 | US$ 14.304.064.000 | US$ 9.667.846.000 | US$ 7.978.846.000 | US$ 7.834.644.000 |
| 2012 | US$ 49.142.434.000 | US$ 14.177.411.000 | US$ 9.520.874.000 | US$ 7.911.709.000 | US$ 7.503.843.000 |
| 2011 | US$ 52.221.249.000 | US$ 14.565.373.000 | US$ 10.267.814.000 | US$ 8.845.137.000 | US$ 7.357.286.000 |
| 2010 | US$ 42.212.766.000 | US$ 11.595.996.000 | US$ 8.129.414.000 | US$ 7.100.947.000 | US$ 6.443.275.000 |
| 2009 | US$ 36.438.817.000 | US$ 10.185.712.000 | US$ 6.577.658.000 | US$ 6.351.707.000 | US$ 5.574.189.000 |
| 2008 | US$ 44.867.595.000 | US$ 13.437.522.000 | US$ 9.468.073.000 | US$ 7.887.134.000 | US$ 7.020.774.000 |
| 2007 | US$ 37.191.790.000 | US$ 10.508.420.000 | US$ 7.146.769.000 | US$ 6.515.460.000 | US$ 6.081.748.000 |
| 2006 | US$ 30.366.436.000 | US$ 8.023.954.000 | US$ 5.390.575.000 | US$ 5.268.095.000 | US$ 4.548.918.000 |
| 2005 | US$ 26.200.643.000 | US$ 6.733.382.000 | US$ 4.266.184.000 | US$ 4.139.348.000 | US$ 3.633.631.000 |
| 2004 | US$ 23.835.740.000 | US$ 5.407.616.000 | US$ 3.443.822.000 | US$ 3.068.659.000 | US$ 3.097.419.000 |
| 2003 | US$ 18.025.635.000 | US$ 3.884.015.000 | US$ 2.336.383.000 | US$ 2.303.960.000 | US$ 2.621.506.000 |
| 2002 | US$ 15.442.116.000 | US$ 3.404.070.000 | US$ 2.053.246.000 | US$ 2.015.193.000 | US$ 2.741.042.000 |
| 2001 | US$ 12.736.693.000 | US$ 2.681.288.000 | US$ 1.729.870.000 | US$ 1.430.237.000 | US$ 1.823.589.000 |
Em 2025, as exportações de bens foram de US$ 88,9 bilhões para a Alemanha, US$ 21,1 bilhões para a Eslováquia, US$ 20,7 bilhões para a Polônia, US$ 13,7 bilhões para a França e US$ 12 bilhões para o Reino Unido. O primeiro lugar dos cinco destinos da Tchéquia ficou com a Alemanha em todos os anos desde 2001. A mudança mais recente nessa ordem foi em 2017, quando as exportações da Tchéquia para a França superaram as exportações para o Reino Unido.
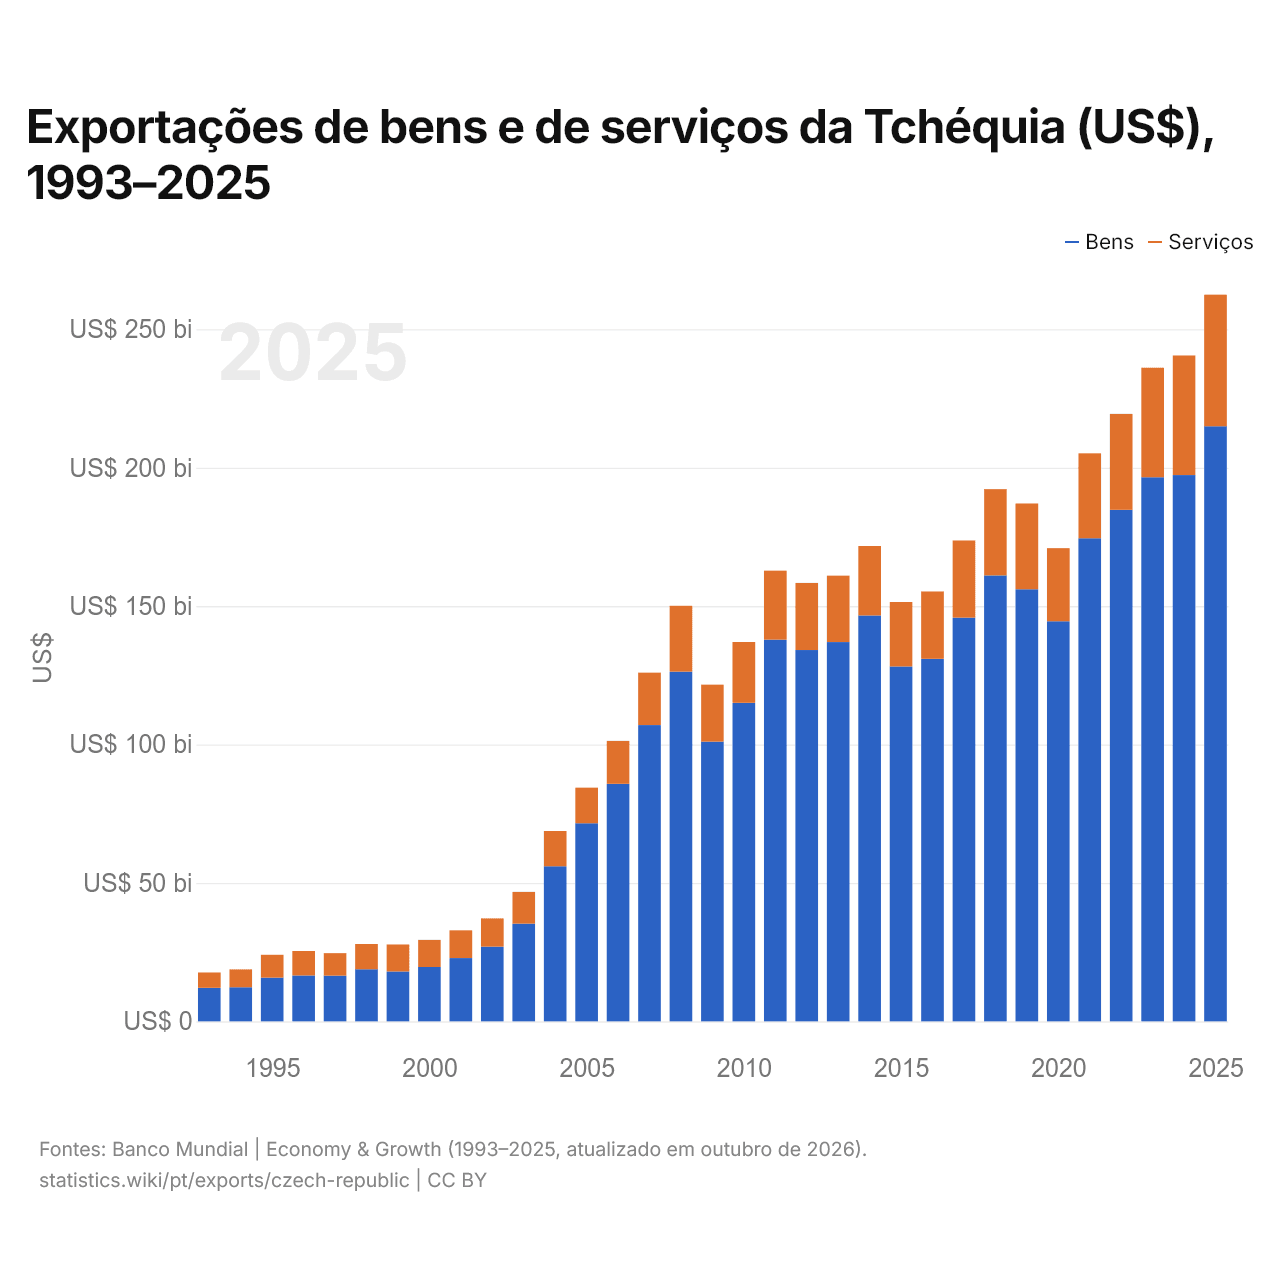
Exportações de bens e de serviços da Tchéquia (US$), 1993–2025
| Ano | US$ | |
|---|---|---|
| Bens | Serviços | |
| 2025 | US$ 214.954.725.294 | US$ 47.538.348.447 |
| 2024 | US$ 197.317.635.982 | US$ 43.229.958.546 |
| 2023 | US$ 196.542.393.365 | US$ 39.560.301.623 |
| 2022 | US$ 184.796.647.571 | US$ 34.621.956.742 |
| 2021 | US$ 174.506.688.258 | US$ 30.655.903.192 |
| 2020 | US$ 144.500.533.136 | US$ 26.437.218.038 |
| 2019 | US$ 156.104.420.901 | US$ 30.983.132.604 |
| 2018 | US$ 161.089.096.032 | US$ 31.151.426.157 |
| 2017 | US$ 145.845.995.179 | US$ 27.855.591.724 |
| 2016 | US$ 130.930.641.059 | US$ 24.359.437.709 |
| 2015 | US$ 128.168.650.728 | US$ 23.277.379.645 |
| 2014 | US$ 146.628.931.541 | US$ 25.071.891.761 |
| 2013 | US$ 136.995.387.018 | US$ 23.982.989.400 |
| 2012 | US$ 134.125.048.606 | US$ 24.235.793.375 |
| 2011 | US$ 137.892.683.126 | US$ 24.928.711.133 |
| 2010 | US$ 115.073.264.309 | US$ 21.956.477.923 |
| 2009 | US$ 101.025.895.121 | US$ 20.607.052.386 |
| 2008 | US$ 126.345.445.810 | US$ 23.745.968.519 |
| 2007 | US$ 107.016.716.975 | US$ 18.953.945.847 |
| 2006 | US$ 85.771.675.081 | US$ 15.527.769.014 |
| 2005 | US$ 71.554.951.811 | US$ 12.847.146.804 |
| 2004 | US$ 56.003.940.481 | US$ 12.753.210.736 |
| 2003 | US$ 35.275.253.693 | US$ 11.472.808.798 |
| 2002 | US$ 26.954.555.173 | US$ 10.228.868.846 |
| 2001 | US$ 22.846.619.264 | US$ 10.044.123.651 |
| 2000 | US$ 19.644.621.430 | US$ 9.767.261.923 |
| 1999 | US$ 18.036.216.541 | US$ 9.701.999.841 |
| 1998 | US$ 18.811.902.360 | US$ 9.111.193.425 |
| 1997 | US$ 16.479.009.082 | US$ 8.132.533.654 |
| 1996 | US$ 16.557.225.814 | US$ 8.848.114.101 |
| 1995 | US$ 15.816.447.990 | US$ 8.222.863.357 |
| 1994 | US$ 12.297.435.857 | US$ 6.461.409.238 |
| 1993 | US$ 12.099.472.139 | US$ 5.558.928.243 |
Em 2025, as exportações de bens da Tchéquia foram de US$ 215 bilhões e as de serviços, de US$ 47,5 bilhões; os serviços representaram 18,1% do total, ante 31,5% em 1993.
A Tchéquia na classificação mundial de exportações, 2025
| Posição | País | Exportações | Participação mundial | |
|---|---|---|---|---|
| 30 |
 Indonésia |
US$ 330 bi | 0,95% | |
| 31 |
 Dinamarca |
US$ 324 bi | 0,93% | |
| 32 |
Áustria
|
US$ 317 bi | 0,91% | vs Áustria |
| 33 |
 Tchéquia |
US$ 262 bi | 0,75% | |
| 34 |
 Noruega |
US$ 241 bi | 0,69% | |
| 35 |
 Luxemburgo |
US$ 193 bi | 0,55% | |
| 36 |
Hungria
|
US$ 179 bi | 0,51% | vs Hungria |
Exportações de bens e serviços da Tchéquia, % do PIB, 1990–2025
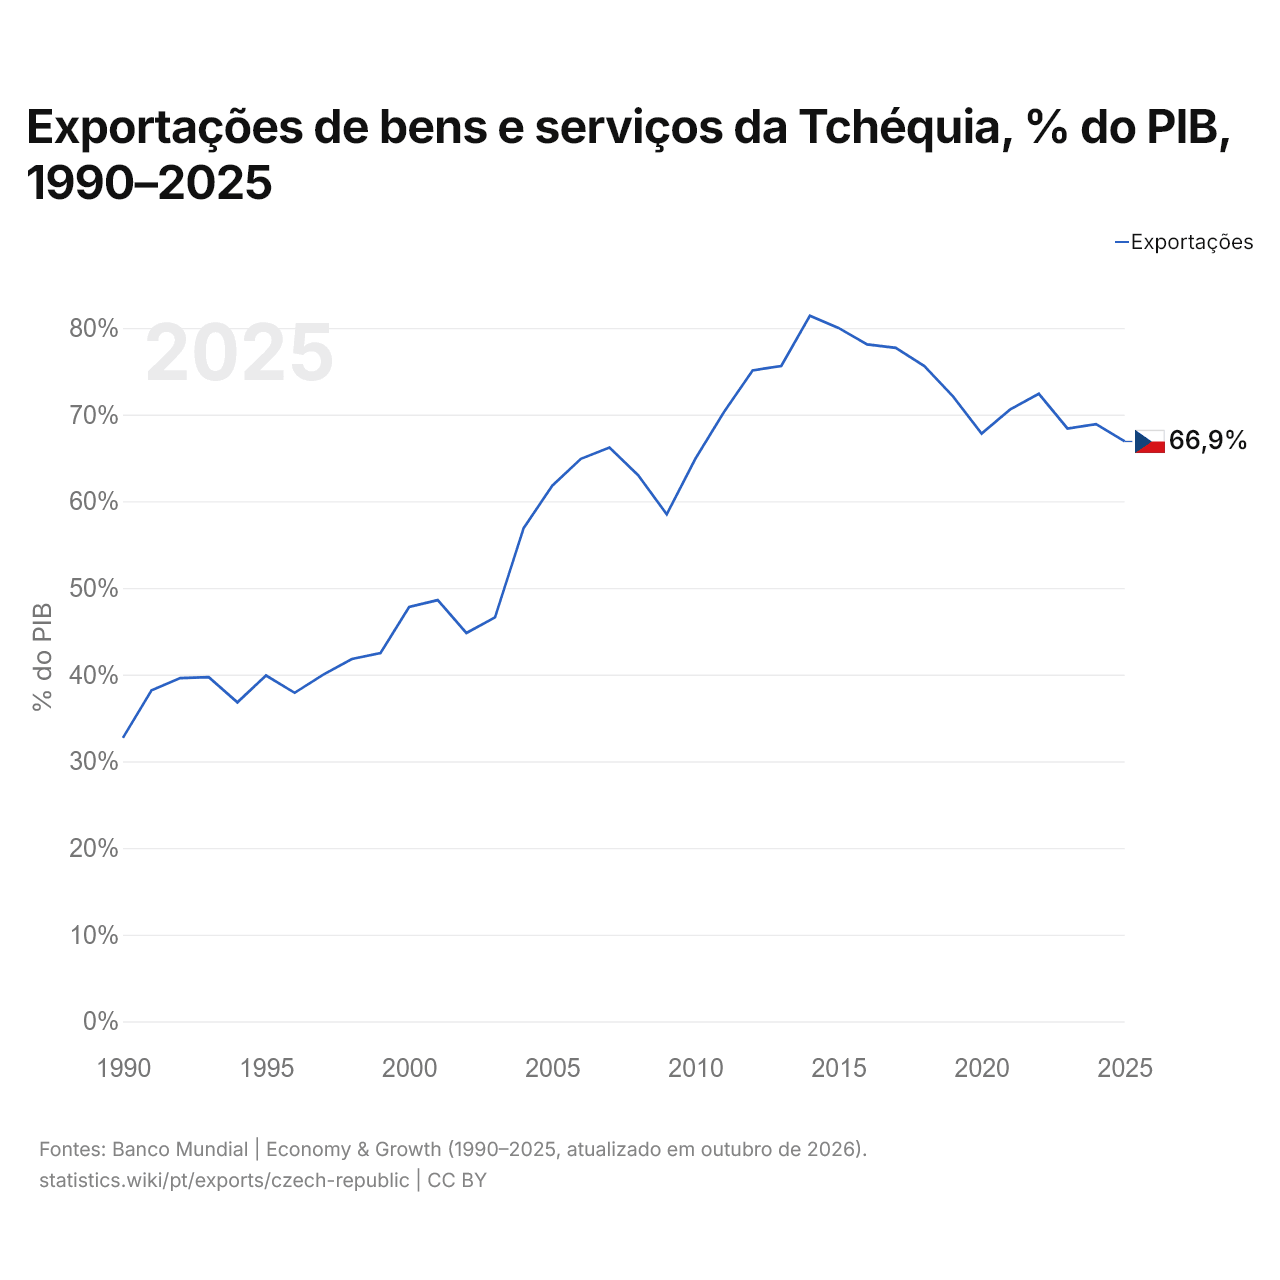
Em 2025, as exportações de bens e serviços da Tchéquia equivaleram a 66,9% do seu PIB, ante 32,7% em 1990. A maior participação foi de 81,4%, em 2014.
Comparar as exportações da Tchéquia com as de outros países
Fontes:
- TradeMap (2001–2025, atualizado em outubro de 2026)
- Banco Mundial | Economy & Growth (1990–2025, atualizado em outubro de 2026)
Creative Commons Atribuição (CC BY): você pode copiar, compartilhar, adaptar e reutilizar este conteúdo, inclusive para fins comerciais, desde que cite o statistics.wiki e indique as alterações que fizer. As fontes listadas acima podem ter suas próprias condições de licença.