
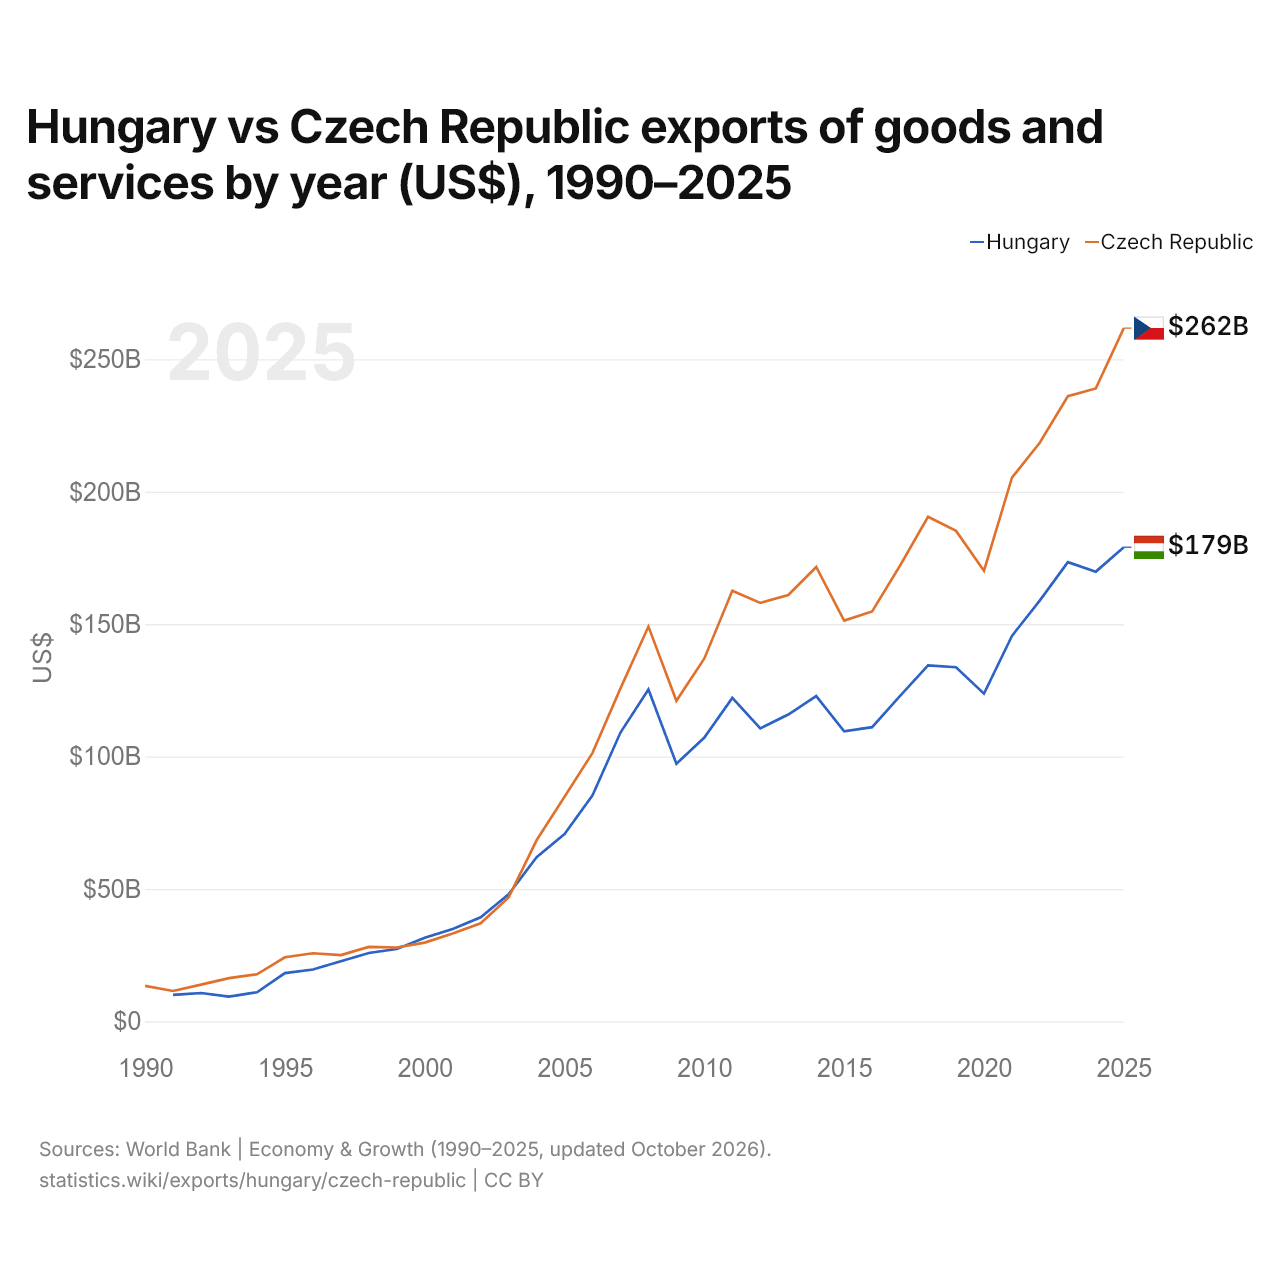
Hungria vs Tchéquia: exportações de bens e serviços por ano (US$), 1990–2025
| Ano | US$ | |
|---|---|---|
 Hungria |
 Tchéquia |
|
| 2025 | US$ 179.026.907.176 | US$ 261.773.375.377 |
| 2024 | US$ 169.805.683.763 | US$ 238.995.944.035 |
| 2023 | US$ 173.379.370.601 | US$ 236.031.278.977 |
| 2022 | US$ 158.966.257.003 | US$ 218.554.266.387 |
| 2021 | US$ 145.547.409.482 | US$ 205.281.381.421 |
| 2020 | US$ 123.744.764.554 | US$ 170.154.349.910 |
| 2019 | US$ 133.707.076.997 | US$ 185.212.440.995 |
| 2018 | US$ 134.422.841.353 | US$ 190.530.873.335 |
| 2017 | US$ 122.904.333.779 | US$ 172.120.406.679 |
| 2016 | US$ 111.069.631.884 | US$ 154.779.987.657 |
| 2015 | US$ 109.507.057.002 | US$ 151.309.924.285 |
| 2014 | US$ 122.820.302.233 | US$ 171.578.513.790 |
| 2013 | US$ 115.833.299.806 | US$ 161.004.654.094 |
| 2012 | US$ 110.596.984.359 | US$ 157.992.900.013 |
| 2011 | US$ 122.146.730.994 | US$ 162.580.614.172 |
| 2010 | US$ 107.172.345.141 | US$ 137.030.722.710 |
| 2009 | US$ 97.259.190.765 | US$ 121.028.432.041 |
| 2008 | US$ 125.323.028.493 | US$ 149.079.880.738 |
| 2007 | US$ 109.047.007.556 | US$ 125.712.955.252 |
| 2006 | US$ 85.323.332.858 | US$ 101.376.993.751 |
| 2005 | US$ 70.710.738.667 | US$ 84.772.805.062 |
| 2004 | US$ 61.955.833.364 | US$ 68.363.528.121 |
| 2003 | US$ 47.999.431.136 | US$ 46.770.321.529 |
| 2002 | US$ 39.274.697.097 | US$ 36.991.594.021 |
| 2001 | US$ 34.859.576.770 | US$ 33.128.639.673 |
| 2000 | US$ 31.571.752.985 | US$ 29.733.777.254 |
| 1999 | US$ 27.319.788.080 | US$ 27.868.246.879 |
| 1998 | US$ 25.799.585.544 | US$ 28.093.534.317 |
| 1997 | US$ 22.676.867.827 | US$ 25.027.225.177 |
| 1996 | US$ 19.562.990.880 | US$ 25.697.102.987 |
| 1995 | US$ 18.216.633.112 | US$ 24.185.606.631 |
| 1994 | US$ 10.978.579.285 | US$ 17.751.255.168 |
| 1993 | US$ 9.317.495.622 | US$ 16.321.369.053 |
| 1992 | US$ 10.708.915.903 | US$ 13.872.829.183 |
| 1991 | US$ 10.010.613.260 | US$ 11.474.470.977 |
| 1990 | - | US$ 13.409.039.102 |
Em 2025, as exportações de bens e serviços da Hungria foram de US$ 179 bilhões e as da Tchéquia, de US$ 262 bilhões: as da Tchéquia foram 46% maiores. Em 1991, as exportações da Tchéquia foram 15% maiores: US$ 10 bilhões da Hungria e US$ 11,5 bilhões da Tchéquia.
As exportações de bens e serviços da Tchéquia têm sido maiores que as da Hungria todos os anos desde 2004.
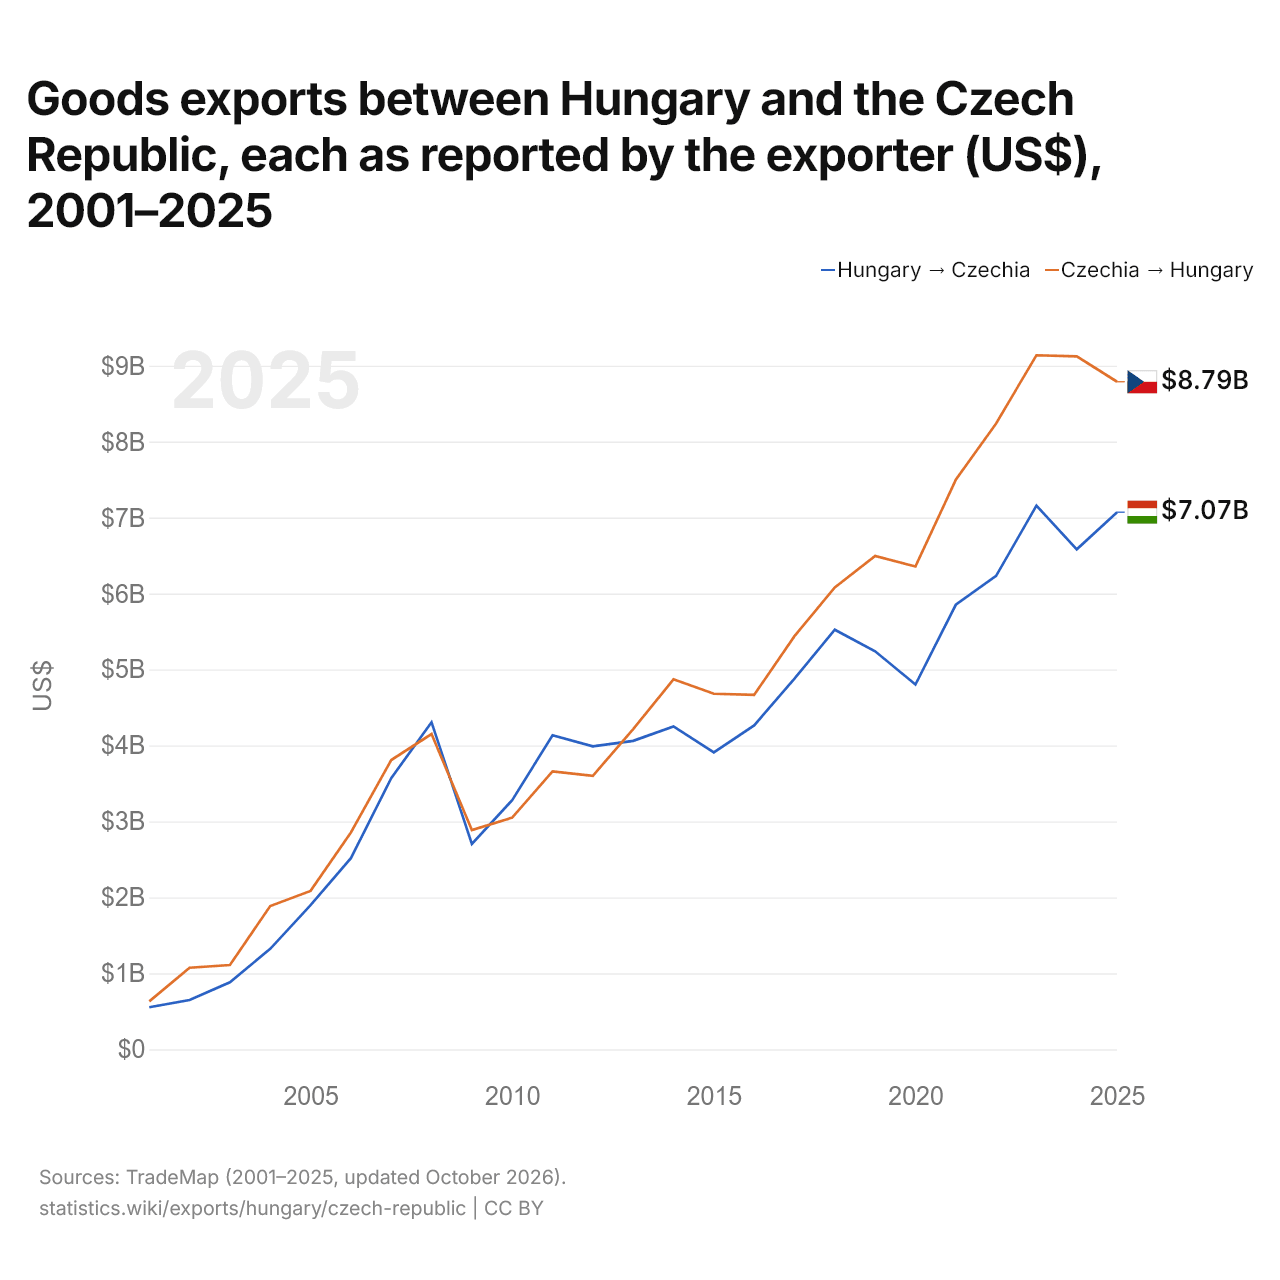
Exportações de bens entre a Hungria e a Tchéquia, segundo o exportador (US$), 2001–2025
| Ano | US$ | |
|---|---|---|
| Hungria → Tchéquia | Tchéquia → Hungria | |
| 2025 | US$ 7.071.178.000 | US$ 8.788.231.000 |
| 2024 | US$ 6.581.881.000 | US$ 9.121.216.000 |
| 2023 | US$ 7.157.673.000 | US$ 9.136.673.000 |
| 2022 | US$ 6.232.039.000 | US$ 8.239.401.000 |
| 2021 | US$ 5.852.265.000 | US$ 7.497.271.000 |
| 2020 | US$ 4.802.120.000 | US$ 6.356.616.000 |
| 2019 | US$ 5.239.908.000 | US$ 6.495.043.000 |
| 2018 | US$ 5.523.512.000 | US$ 6.080.249.000 |
| 2017 | US$ 4.879.209.000 | US$ 5.438.717.000 |
| 2016 | US$ 4.264.396.000 | US$ 4.666.629.000 |
| 2015 | US$ 3.908.886.000 | US$ 4.680.773.000 |
| 2014 | US$ 4.250.297.000 | US$ 4.871.279.000 |
| 2013 | US$ 4.061.092.000 | US$ 4.216.270.000 |
| 2012 | US$ 3.989.435.000 | US$ 3.600.919.000 |
| 2011 | US$ 4.133.890.000 | US$ 3.658.347.000 |
| 2010 | US$ 3.280.195.000 | US$ 3.050.705.000 |
| 2009 | US$ 2.703.144.000 | US$ 2.886.198.000 |
| 2008 | US$ 4.306.426.000 | US$ 4.150.478.000 |
| 2007 | US$ 3.570.206.000 | US$ 3.807.697.000 |
| 2006 | US$ 2.516.256.000 | US$ 2.855.510.000 |
| 2005 | US$ 1.898.539.000 | US$ 2.085.684.000 |
| 2004 | US$ 1.323.205.000 | US$ 1.886.742.000 |
| 2003 | US$ 883.103.000 | US$ 1.110.621.000 |
| 2002 | US$ 649.270.000 | US$ 1.074.292.000 |
| 2001 | US$ 553.383.000 | US$ 630.816.000 |
Em 2025, as exportações de bens da Hungria para a Tchéquia, segundo a Hungria, foram de US$ 7,07 bilhões, e as da Tchéquia para a Hungria, segundo a Tchéquia, de US$ 8,79 bilhões: 24% mais da Tchéquia. Em 2001, foram de US$ 553 milhões da Hungria e de US$ 631 milhões da Tchéquia.
Hungria vs Tchéquia: dados de exportações
|
Hungria
|
Tchéquia
|
|
|---|---|---|
| Exportações | US$ 179 bi (2025) | US$ 262 bi (2025) |
| Posição mundial | 36/176 | 33/176 |
| Participação mundial | 0,51% | 0,75% |
| % do PIB | 72,6% | 66,9% |
| Maior categoria de bens | Máquinas, eletrônicos e veículos (60,4%, 2025) | Máquinas, eletrônicos e veículos (62,2%, 2025) |
| Principal destino dos bens | Alemanha (24,8%, 2025) | Alemanha (31,5%, 2025) |
Comparar as exportações de 2 países quaisquer
Fontes:
- Banco Mundial | Economy & Growth (1990–2025, atualizado em outubro de 2026)
- TradeMap (2001–2025, atualizado em outubro de 2026)
Creative Commons Atribuição (CC BY): você pode copiar, compartilhar, adaptar e reutilizar este conteúdo, inclusive para fins comerciais, desde que cite o statistics.wiki e indique as alterações que fizer. As fontes listadas acima podem ter suas próprias condições de licença.