
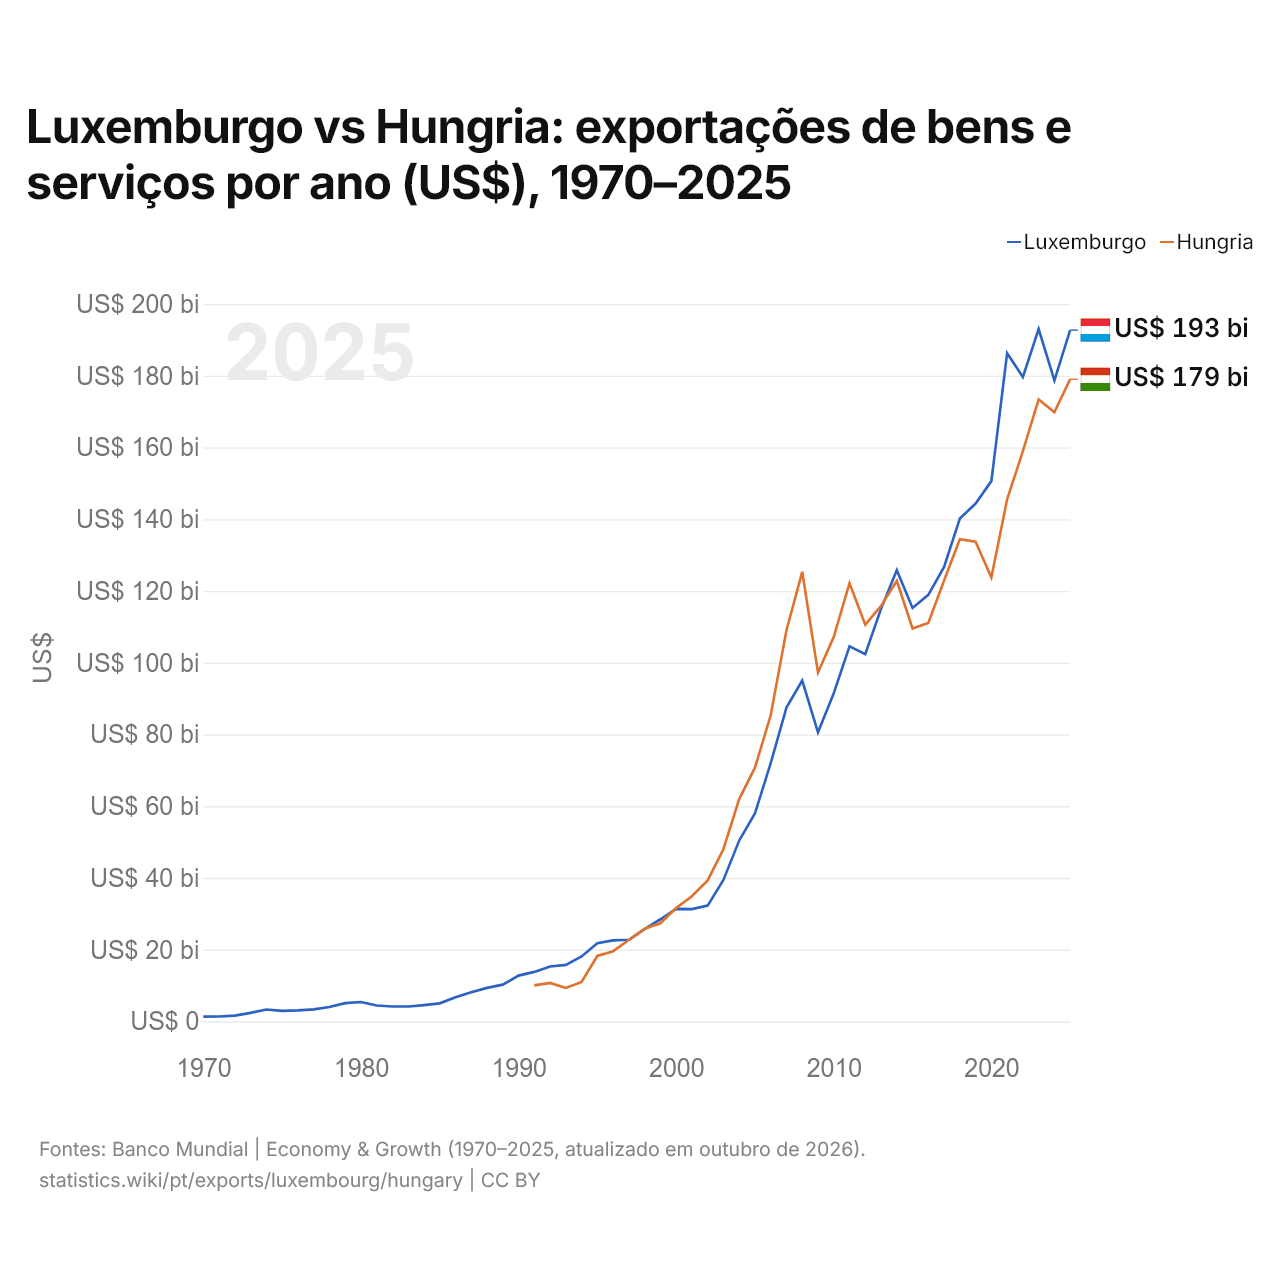
Luxemburgo vs Hungria: exportações de bens e serviços por ano (US$), 1970–2025
| Ano | US$ | |
|---|---|---|
 Luxemburgo |
 Hungria |
|
| 2025 | US$ 192.728.057.158 | US$ 179.026.907.176 |
| 2024 | US$ 178.661.670.861 | US$ 169.805.683.763 |
| 2023 | US$ 193.009.113.165 | US$ 173.379.370.601 |
| 2022 | US$ 179.628.968.244 | US$ 158.966.257.003 |
| 2021 | US$ 186.265.544.320 | US$ 145.547.409.482 |
| 2020 | US$ 150.610.309.021 | US$ 123.744.764.554 |
| 2019 | US$ 144.341.752.039 | US$ 133.707.076.997 |
| 2018 | US$ 140.193.787.083 | US$ 134.422.841.353 |
| 2017 | US$ 126.658.587.133 | US$ 122.904.333.779 |
| 2016 | US$ 118.895.618.024 | US$ 111.069.631.884 |
| 2015 | US$ 115.238.581.123 | US$ 109.507.057.002 |
| 2014 | US$ 125.763.218.896 | US$ 122.820.302.233 |
| 2013 | US$ 115.007.710.906 | US$ 115.833.299.806 |
| 2012 | US$ 102.344.215.079 | US$ 110.596.984.359 |
| 2011 | US$ 104.568.486.413 | US$ 122.146.730.994 |
| 2010 | US$ 91.465.696.293 | US$ 107.172.345.141 |
| 2009 | US$ 80.570.783.796 | US$ 97.259.190.765 |
| 2008 | US$ 95.030.426.101 | US$ 125.323.028.493 |
| 2007 | US$ 87.480.215.781 | US$ 109.047.007.556 |
| 2006 | US$ 71.977.613.140 | US$ 85.323.332.858 |
| 2005 | US$ 57.949.162.558 | US$ 70.710.738.667 |
| 2004 | US$ 50.400.230.064 | US$ 61.955.833.364 |
| 2003 | US$ 39.412.388.094 | US$ 47.999.431.136 |
| 2002 | US$ 32.249.319.538 | US$ 39.274.697.097 |
| 2001 | US$ 31.268.767.983 | US$ 34.859.576.770 |
| 2000 | US$ 31.345.279.140 | US$ 31.571.752.985 |
| 1999 | US$ 28.455.196.289 | US$ 27.319.788.080 |
| 1998 | US$ 25.731.039.120 | US$ 25.799.585.544 |
| 1997 | US$ 22.737.276.725 | US$ 22.676.867.827 |
| 1996 | US$ 22.562.990.228 | US$ 19.562.990.880 |
| 1995 | US$ 21.787.067.597 | US$ 18.216.633.112 |
| 1994 | US$ 18.080.553.412 | US$ 10.978.579.285 |
| 1993 | US$ 15.744.739.972 | US$ 9.317.495.622 |
| 1992 | US$ 15.301.225.847 | US$ 10.708.915.903 |
| 1991 | US$ 13.779.657.413 | US$ 10.010.613.260 |
| 1990 | US$ 12.742.102.849 | - |
| 1989 | US$ 10.219.753.276 | - |
| 1988 | US$ 9.327.494.240 | - |
| 1987 | US$ 8.110.552.134 | - |
| 1986 | US$ 6.703.202.998 | - |
| 1985 | US$ 5.014.838.644 | - |
| 1984 | US$ 4.532.564.926 | - |
| 1983 | US$ 4.124.129.389 | - |
| 1982 | US$ 4.137.952.499 | - |
| 1981 | US$ 4.423.440.895 | - |
| 1980 | US$ 5.383.032.142 | - |
| 1979 | US$ 5.067.336.269 | - |
| 1978 | US$ 3.993.266.299 | - |
| 1977 | US$ 3.324.898.143 | - |
| 1976 | US$ 3.047.749.216 | - |
| 1975 | US$ 2.917.697.708 | - |
| 1974 | US$ 3.300.803.645 | - |
| 1973 | US$ 2.355.188.367 | - |
| 1972 | US$ 1.592.229.860 | - |
| 1971 | US$ 1.352.359.884 | - |
| 1970 | US$ 1.308.913.271 | - |
Em 2025, as exportações de bens e serviços do Luxemburgo foram de US$ 193 bilhões e as da Hungria, de US$ 179 bilhões: as do Luxemburgo foram 7,7% maiores. Em 1991, as exportações do Luxemburgo foram 38% maiores: US$ 13,8 bilhões do Luxemburgo e US$ 10 bilhões da Hungria.
As exportações de bens e serviços do Luxemburgo têm sido maiores que as da Hungria todos os anos desde 2014.
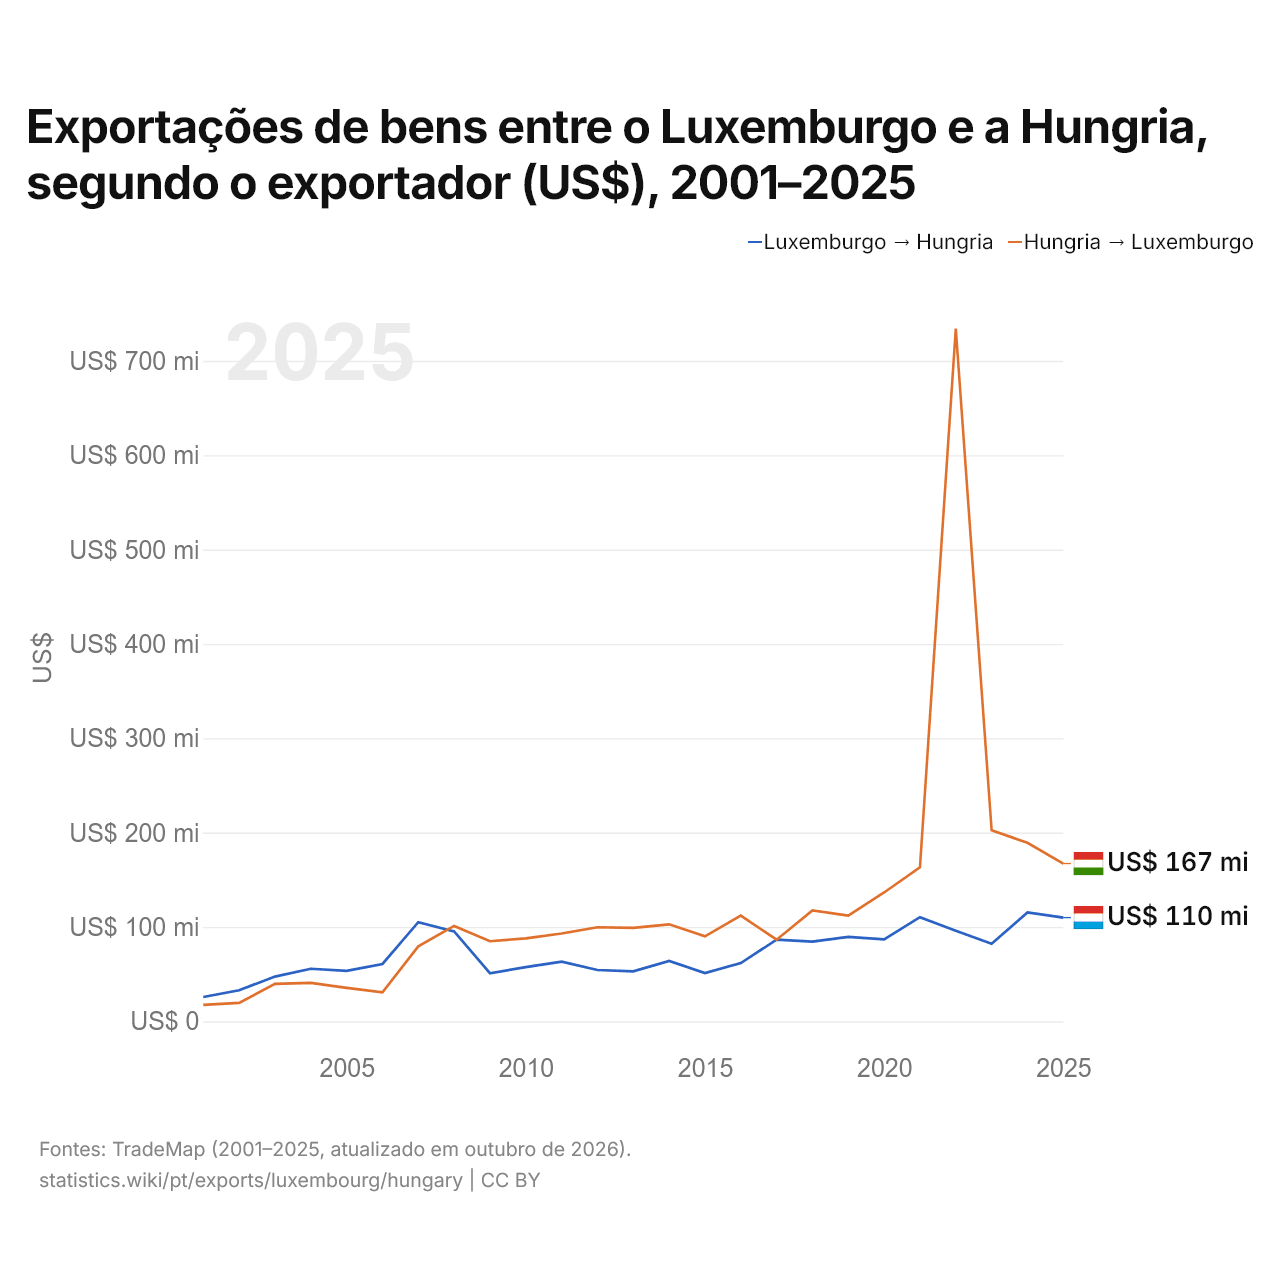
Exportações de bens entre o Luxemburgo e a Hungria, segundo o exportador (US$), 2001–2025
| Ano | US$ | |
|---|---|---|
| Luxemburgo → Hungria | Hungria → Luxemburgo | |
| 2025 | US$ 109.954.000 | US$ 167.203.000 |
| 2024 | US$ 115.376.000 | US$ 189.193.000 |
| 2023 | US$ 82.315.000 | US$ 202.495.000 |
| 2022 | US$ 95.906.000 | US$ 734.295.000 |
| 2021 | US$ 110.438.000 | US$ 163.247.000 |
| 2020 | US$ 86.812.000 | US$ 136.543.000 |
| 2019 | US$ 89.478.000 | US$ 112.148.000 |
| 2018 | US$ 84.463.000 | US$ 117.642.000 |
| 2017 | US$ 86.556.000 | US$ 86.538.000 |
| 2016 | US$ 61.790.000 | US$ 112.000.000 |
| 2015 | US$ 51.231.000 | US$ 90.023.000 |
| 2014 | US$ 63.927.000 | US$ 102.840.000 |
| 2013 | US$ 52.977.000 | US$ 99.036.000 |
| 2012 | US$ 54.423.000 | US$ 99.718.000 |
| 2011 | US$ 63.276.000 | US$ 93.037.000 |
| 2010 | US$ 57.511.000 | US$ 87.968.000 |
| 2009 | US$ 50.967.000 | US$ 84.885.000 |
| 2008 | US$ 95.261.000 | US$ 101.121.000 |
| 2007 | US$ 105.085.000 | US$ 79.428.000 |
| 2006 | US$ 60.771.000 | US$ 30.804.000 |
| 2005 | US$ 53.463.000 | US$ 35.471.000 |
| 2004 | US$ 55.732.000 | US$ 40.768.000 |
| 2003 | US$ 47.439.000 | US$ 39.786.000 |
| 2002 | US$ 32.989.000 | US$ 19.535.000 |
| 2001 | US$ 25.778.000 | US$ 17.430.000 |
Em 2025, as exportações de bens do Luxemburgo para a Hungria, segundo o Luxemburgo, foram de US$ 110 milhões, e as da Hungria para o Luxemburgo, segundo a Hungria, de US$ 167 milhões: 1,5 vezes mais da Hungria. Em 2001, foram de US$ 25,8 milhões do Luxemburgo e de US$ 17,4 milhões da Hungria.
Luxemburgo vs Hungria: dados de exportações
|
Luxemburgo
|
Hungria
|
|
|---|---|---|
| Exportações | US$ 193 bi (2025) | US$ 179 bi (2025) |
| Posição mundial | 35/176 | 36/176 |
| Participação mundial | 0,55% | 0,51% |
| % do PIB | 190,5% | 72,6% |
| Maior categoria de bens | Máquinas, eletrônicos e veículos (29%, 2025) | Máquinas, eletrônicos e veículos (60,4%, 2025) |
| Principal destino dos bens | Alemanha (25,3%, 2025) | Alemanha (24,8%, 2025) |
Comparar as exportações de 2 países quaisquer
Fontes:
- Banco Mundial | Economy & Growth (1970–2025, atualizado em outubro de 2026)
- TradeMap (2001–2025, atualizado em outubro de 2026)
Creative Commons Atribuição (CC BY): você pode copiar, compartilhar, adaptar e reutilizar este conteúdo, inclusive para fins comerciais, desde que cite o statistics.wiki e indique as alterações que fizer. As fontes listadas acima podem ter suas próprias condições de licença.