
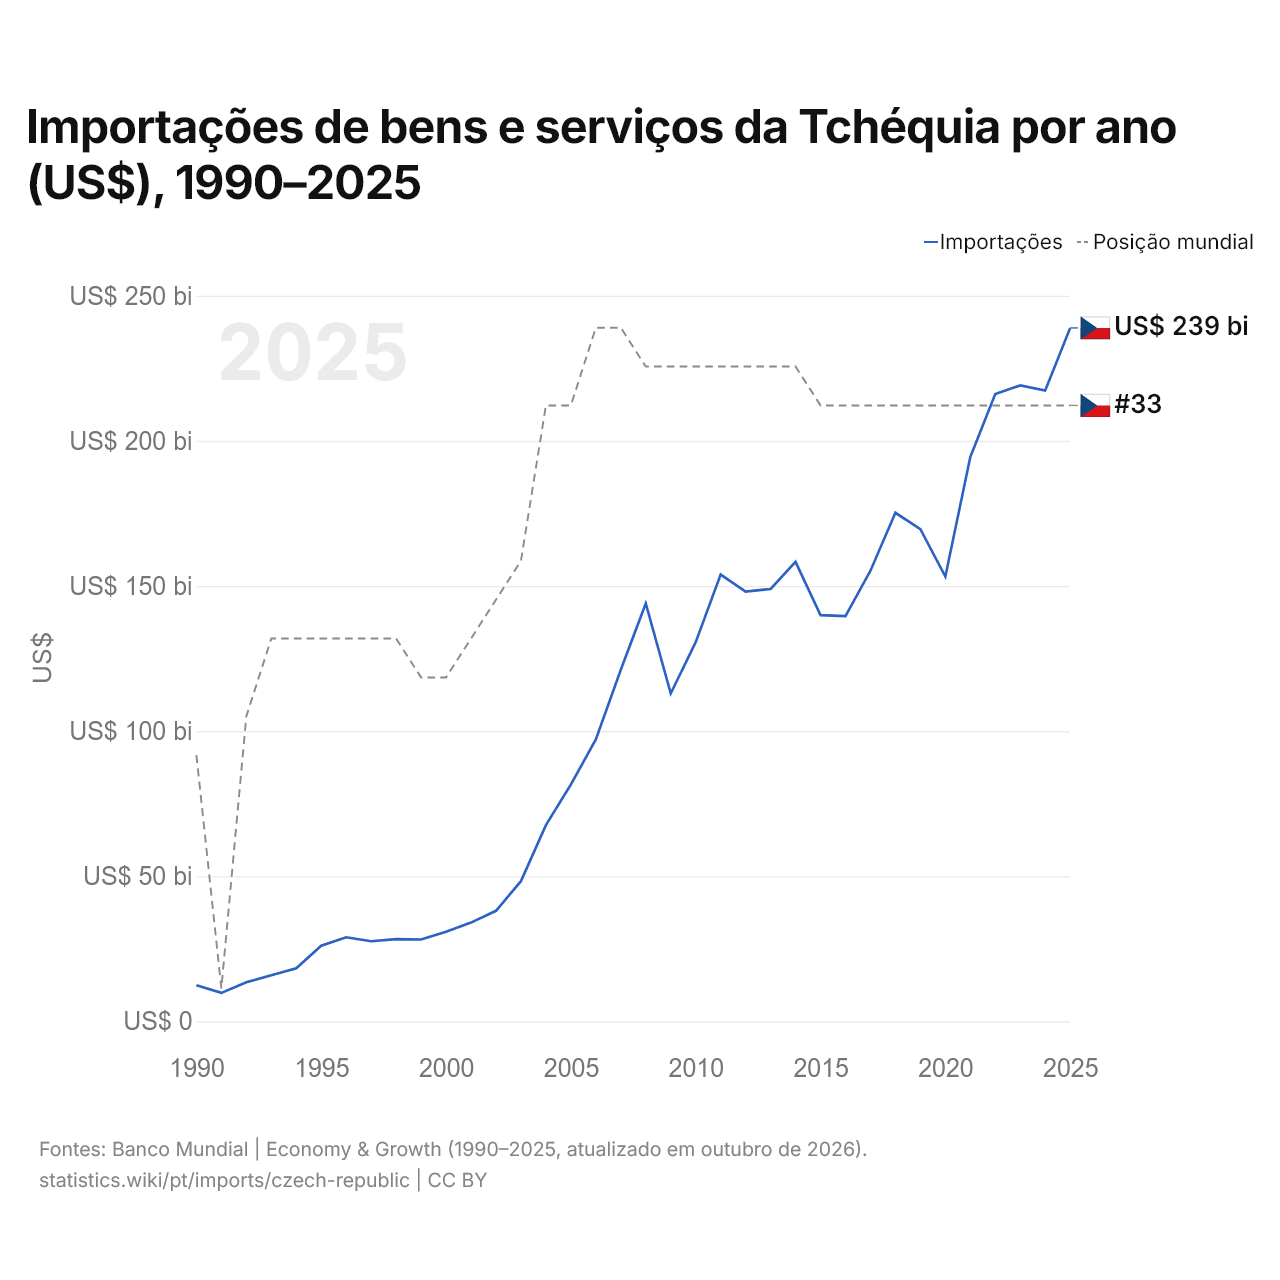
Importações de bens e serviços da Tchéquia por ano (US$), 1990–2025
| Ano | US$ | Posição mundial |
|---|---|---|
| Importações | Posição mundial | |
| 2025 | US$ 238.895.347.774 | #33 |
| 2024 | US$ 217.301.727.913 | #33 |
| 2023 | US$ 219.076.391.731 | #33 |
| 2022 | US$ 216.117.395.213 | #33 |
| 2021 | US$ 194.451.452.690 | #33 |
| 2020 | US$ 153.225.751.554 | #33 |
| 2019 | US$ 169.560.596.976 | #33 |
| 2018 | US$ 175.215.168.029 | #33 |
| 2017 | US$ 155.241.626.146 | #33 |
| 2016 | US$ 139.581.736.162 | #33 |
| 2015 | US$ 139.950.729.204 | #33 |
| 2014 | US$ 158.318.631.820 | #32 |
| 2013 | US$ 148.950.542.268 | #32 |
| 2012 | US$ 148.043.927.979 | #32 |
| 2011 | US$ 153.901.041.201 | #32 |
| 2010 | US$ 130.639.247.051 | #32 |
| 2009 | US$ 112.951.738.971 | #32 |
| 2008 | US$ 143.962.757.078 | #32 |
| 2007 | US$ 121.105.712.610 | #31 |
| 2006 | US$ 97.122.758.413 | #31 |
| 2005 | US$ 81.579.428.486 | #33 |
| 2004 | US$ 67.612.627.336 | #33 |
| 2003 | US$ 48.289.127.583 | #37 |
| 2002 | US$ 38.081.836.120 | #38 |
| 2001 | US$ 34.009.759.252 | #39 |
| 2000 | US$ 30.886.476.403 | #40 |
| 1999 | US$ 28.180.143.017 | #40 |
| 1998 | US$ 28.302.510.440 | #39 |
| 1997 | US$ 27.602.007.660 | #39 |
| 1996 | US$ 28.952.706.187 | #39 |
| 1995 | US$ 26.029.502.638 | #39 |
| 1994 | US$ 18.295.180.997 | #39 |
| 1993 | US$ 15.861.421.535 | #39 |
| 1992 | US$ 13.453.377.892 | #41 |
| 1991 | US$ 9.807.155.002 | #48 |
| 1990 | US$ 12.452.629.310 | #42 |
Em 2025, as importações de bens e serviços da Tchéquia foram de US$ 239 bilhões, ante US$ 12,5 bilhões em 1990. O mínimo foi de US$ 9,81 bilhões, em 1991. Foram as 33ª maiores do mundo, posição que mantêm desde 2015. Sua melhor posição foi o 31º lugar, ocupado pela última vez em 2007.
Em 2025, as importações de bens e serviços da Tchéquia foram as 15ª maiores de 41 países da Europa. Em 2025, as exportações da Tchéquia superaram as importações em US$ 22,9 bilhões, um superávit comercial. O comércio da Tchéquia, exportações e importações somadas, equivaleu a 128,0% do seu PIB em 2025, o 36º lugar do mundo.
Importações de bens da Tchéquia por categoria, 2025
Importações de bens, 2025: US$ 250 bi
Em 2025, a maior categoria das importações de bens da Tchéquia foi máquinas, eletrônicos e veículos, com 50,1%, seguida de produtos químicos, farmacêuticos e plásticos, com 12,2%.
Origens das importações de bens da Tchéquia: as 10 principais, 2025
| Posição | País | Importações de bens | Participação | |
|---|---|---|---|---|
| 1 |
 Alemanha |
US$ 50,5 bi | 20,2% | vs Alemanha |
| 2 |
 China |
US$ 40,5 bi | 16,2% | |
| 3 |
 Polônia |
US$ 20,5 bi | 8,19% | vs Polônia |
| 4 |
 Eslováquia |
US$ 11,2 bi | 4,49% | vs Eslováquia |
| 5 |
 Itália |
US$ 9,66 bi | 3,86% | vs Itália |
| 6 |
 França |
US$ 7,22 bi | 2,88% | |
| 7 |
 Países Baixos |
US$ 7,02 bi | 2,81% | |
| 8 |
 Áustria |
US$ 6,63 bi | 2,65% | vs Áustria |
| 9 |
 Estados Unidos |
US$ 6,49 bi | 2,6% | |
| 10 |
 Hungria |
US$ 5,64 bi | 2,25% | vs Hungria |
| Outros parceiros e não especificados | US$ 84,9 bi | 33,9% |
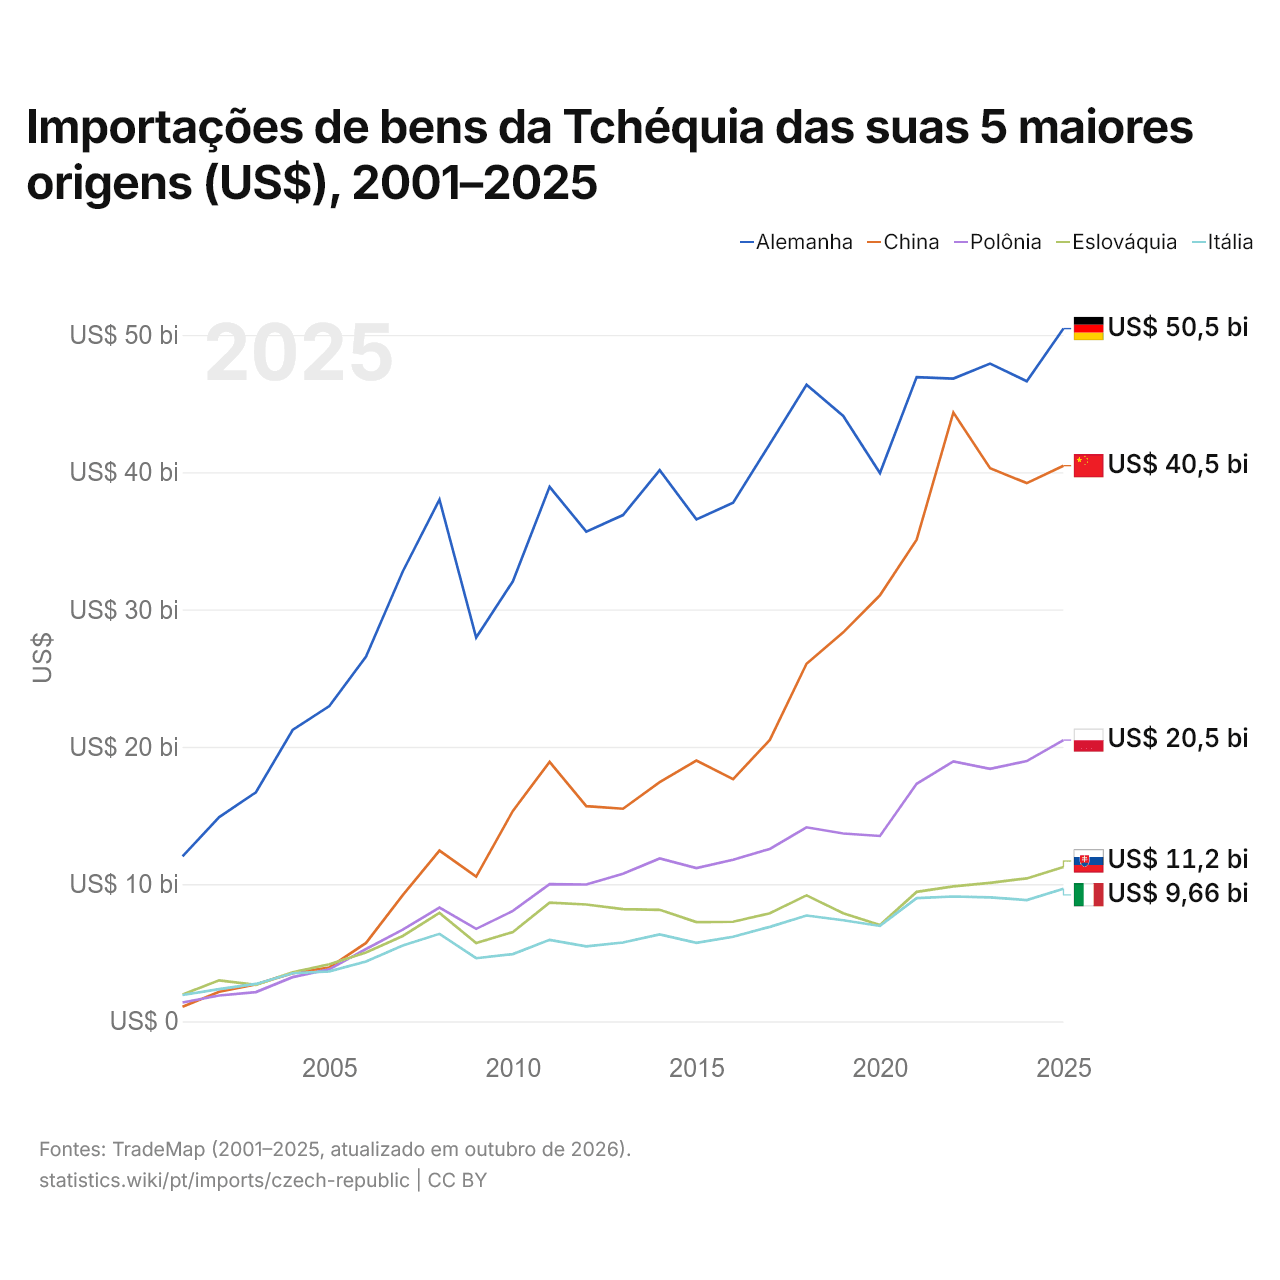
Importações de bens da Tchéquia das suas 5 maiores origens (US$), 2001–2025
| Ano | US$ | ||||
|---|---|---|---|---|---|
| Alemanha | China | Polônia | Eslováquia | Itália | |
| 2025 | US$ 50.468.922.000 | US$ 40.480.414.000 | US$ 20.484.492.000 | US$ 11.237.163.000 | US$ 9.661.619.000 |
| 2024 | US$ 46.630.775.000 | US$ 39.210.201.000 | US$ 18.960.611.000 | US$ 10.411.895.000 | US$ 8.835.679.000 |
| 2023 | US$ 47.917.349.000 | US$ 40.293.225.000 | US$ 18.398.201.000 | US$ 10.091.406.000 | US$ 9.036.136.000 |
| 2022 | US$ 46.824.989.000 | US$ 44.356.730.000 | US$ 18.932.677.000 | US$ 9.830.162.000 | US$ 9.091.962.000 |
| 2021 | US$ 46.932.182.000 | US$ 35.084.744.000 | US$ 17.308.254.000 | US$ 9.430.848.000 | US$ 8.972.245.000 |
| 2020 | US$ 39.942.873.000 | US$ 31.037.334.000 | US$ 13.503.618.000 | US$ 7.024.294.000 | US$ 6.949.287.000 |
| 2019 | US$ 44.101.048.000 | US$ 28.337.633.000 | US$ 13.685.788.000 | US$ 7.868.115.000 | US$ 7.365.105.000 |
| 2018 | US$ 46.370.435.000 | US$ 26.052.061.000 | US$ 14.135.084.000 | US$ 9.174.322.000 | US$ 7.710.302.000 |
| 2017 | US$ 42.065.680.000 | US$ 20.498.182.000 | US$ 12.559.436.000 | US$ 7.868.064.000 | US$ 6.882.934.000 |
| 2016 | US$ 37.779.178.000 | US$ 17.648.830.000 | US$ 11.776.829.000 | US$ 7.252.605.000 | US$ 6.165.007.000 |
| 2015 | US$ 36.564.621.000 | US$ 18.998.267.000 | US$ 11.159.827.000 | US$ 7.227.570.000 | US$ 5.721.963.000 |
| 2014 | US$ 40.154.997.000 | US$ 17.426.277.000 | US$ 11.865.463.000 | US$ 8.121.679.000 | US$ 6.331.813.000 |
| 2013 | US$ 36.880.510.000 | US$ 15.486.206.000 | US$ 10.756.290.000 | US$ 8.176.816.000 | US$ 5.746.656.000 |
| 2012 | US$ 35.674.359.000 | US$ 15.672.786.000 | US$ 9.966.393.000 | US$ 8.514.253.000 | US$ 5.459.669.000 |
| 2011 | US$ 38.938.450.000 | US$ 18.905.321.000 | US$ 10.001.664.000 | US$ 8.648.624.000 | US$ 5.938.001.000 |
| 2010 | US$ 32.057.289.000 | US$ 15.332.149.000 | US$ 8.041.080.000 | US$ 6.505.286.000 | US$ 4.897.753.000 |
| 2009 | US$ 27.960.029.000 | US$ 10.546.002.000 | US$ 6.736.388.000 | US$ 5.708.548.000 | US$ 4.596.731.000 |
| 2008 | US$ 38.009.386.000 | US$ 12.442.373.000 | US$ 8.290.826.000 | US$ 7.894.163.000 | US$ 6.373.553.000 |
| 2007 | US$ 32.771.955.000 | US$ 9.193.963.000 | US$ 6.684.487.000 | US$ 6.220.489.000 | US$ 5.523.691.000 |
| 2006 | US$ 26.583.076.000 | US$ 5.711.362.000 | US$ 5.270.903.000 | US$ 5.009.875.000 | US$ 4.364.051.000 |
| 2005 | US$ 22.965.404.000 | US$ 3.924.155.000 | US$ 3.789.015.000 | US$ 4.155.098.000 | US$ 3.637.917.000 |
| 2004 | US$ 21.227.732.000 | US$ 3.511.680.000 | US$ 3.218.977.000 | US$ 3.573.032.000 | US$ 3.501.502.000 |
| 2003 | US$ 16.685.346.000 | US$ 2.681.355.000 | US$ 2.129.850.000 | US$ 2.656.817.000 | US$ 2.725.721.000 |
| 2002 | US$ 14.882.864.000 | US$ 2.151.254.000 | US$ 1.880.905.000 | US$ 2.988.055.000 | US$ 2.350.712.000 |
| 2001 | US$ 12.013.812.000 | US$ 1.068.089.000 | US$ 1.368.242.000 | US$ 1.961.543.000 | US$ 1.916.802.000 |
Em 2025, as importações de bens foram de US$ 50,5 bilhões da Alemanha, US$ 40,5 bilhões da China, US$ 20,5 bilhões da Polônia, US$ 11,2 bilhões da Eslováquia e US$ 9,66 bilhões da Itália. O primeiro lugar dos cinco fornecedores da Tchéquia ficou com a Alemanha em todos os anos desde 2001. A mudança mais recente nessa ordem foi em 2006, quando as importações da Tchéquia vindas da Polônia superaram as vindas da Eslováquia.
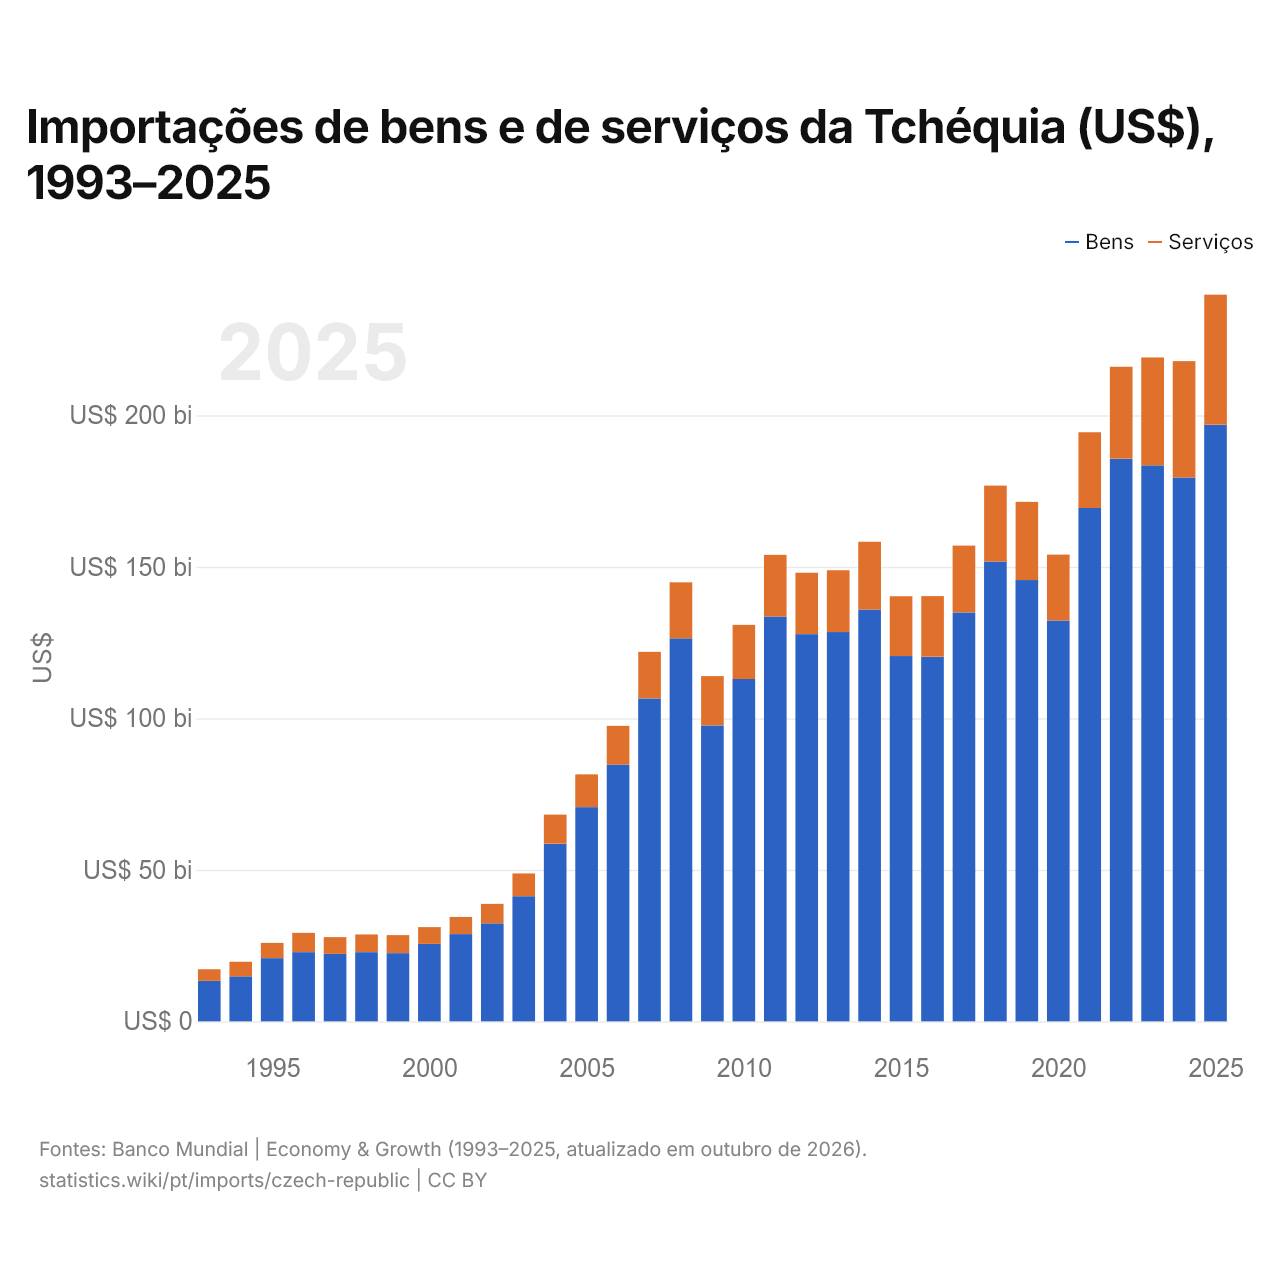
Importações de bens e de serviços da Tchéquia (US$), 1993–2025
| Ano | US$ | |
|---|---|---|
| Bens | Serviços | |
| 2025 | US$ 196.908.638.479 | US$ 42.899.337.471 |
| 2024 | US$ 179.463.699.666 | US$ 38.420.982.963 |
| 2023 | US$ 183.488.220.582 | US$ 35.601.598.612 |
| 2022 | US$ 185.655.543.051 | US$ 30.385.976.898 |
| 2021 | US$ 169.401.245.303 | US$ 25.001.071.962 |
| 2020 | US$ 132.251.778.108 | US$ 21.763.183.856 |
| 2019 | US$ 145.622.670.082 | US$ 25.803.030.019 |
| 2018 | US$ 151.709.828.168 | US$ 25.071.618.946 |
| 2017 | US$ 134.945.644.958 | US$ 22.059.249.864 |
| 2016 | US$ 120.322.121.362 | US$ 19.997.367.298 |
| 2015 | US$ 120.537.758.450 | US$ 19.755.982.688 |
| 2014 | US$ 135.907.935.272 | US$ 22.356.403.335 |
| 2013 | US$ 128.468.646.961 | US$ 20.386.006.050 |
| 2012 | US$ 127.786.130.885 | US$ 20.265.456.587 |
| 2011 | US$ 133.616.083.834 | US$ 20.310.687.934 |
| 2010 | US$ 112.974.269.863 | US$ 17.863.181.296 |
| 2009 | US$ 97.660.114.670 | US$ 16.272.646.315 |
| 2008 | US$ 126.415.007.098 | US$ 18.456.408.324 |
| 2007 | US$ 106.581.250.890 | US$ 15.337.251.661 |
| 2006 | US$ 84.734.951.025 | US$ 12.774.227.509 |
| 2005 | US$ 70.694.381.723 | US$ 10.809.651.732 |
| 2004 | US$ 58.614.624.516 | US$ 9.614.252.828 |
| 2003 | US$ 41.289.288.426 | US$ 7.508.094.925 |
| 2002 | US$ 32.343.324.383 | US$ 6.436.791.092 |
| 2001 | US$ 28.787.876.345 | US$ 5.656.567.784 |
| 2000 | US$ 25.544.095.996 | US$ 5.559.786.563 |
| 1999 | US$ 22.487.802.460 | US$ 5.954.034.646 |
| 1998 | US$ 22.818.209.981 | US$ 5.836.250.440 |
| 1997 | US$ 22.251.271.129 | US$ 5.555.987.596 |
| 1996 | US$ 22.831.963.921 | US$ 6.362.589.040 |
| 1995 | US$ 20.841.309.905 | US$ 5.039.751.481 |
| 1994 | US$ 14.865.720.127 | US$ 4.818.863.651 |
| 1993 | US$ 13.352.188.735 | US$ 3.810.578.457 |
Em 2025, as importações de bens da Tchéquia foram de US$ 197 bilhões e as de serviços, de US$ 42,9 bilhões; os serviços representaram 17,9% do total, ante 22,2% em 1993.
A Tchéquia na classificação mundial de importações, 2025
| Posição | País | Importações | Participação mundial | |
|---|---|---|---|---|
| 30 |
Áustria
|
US$ 303 bi | 0,9% | vs Áustria |
| 31 |
 Indonésia |
US$ 297 bi | 0,88% | |
| 32 |
 Dinamarca |
US$ 273 bi | 0,81% | |
| 33 |
 Tchéquia |
US$ 239 bi | 0,71% | |
| 34 |
 Filipinas |
US$ 196 bi | 0,58% | |
| 35 |
 Noruega |
US$ 179 bi | 0,53% | |
| 36 |
 Romênia |
US$ 175 bi | 0,52% | vs Romênia |
Importações de bens e serviços da Tchéquia, % do PIB, 1990–2025
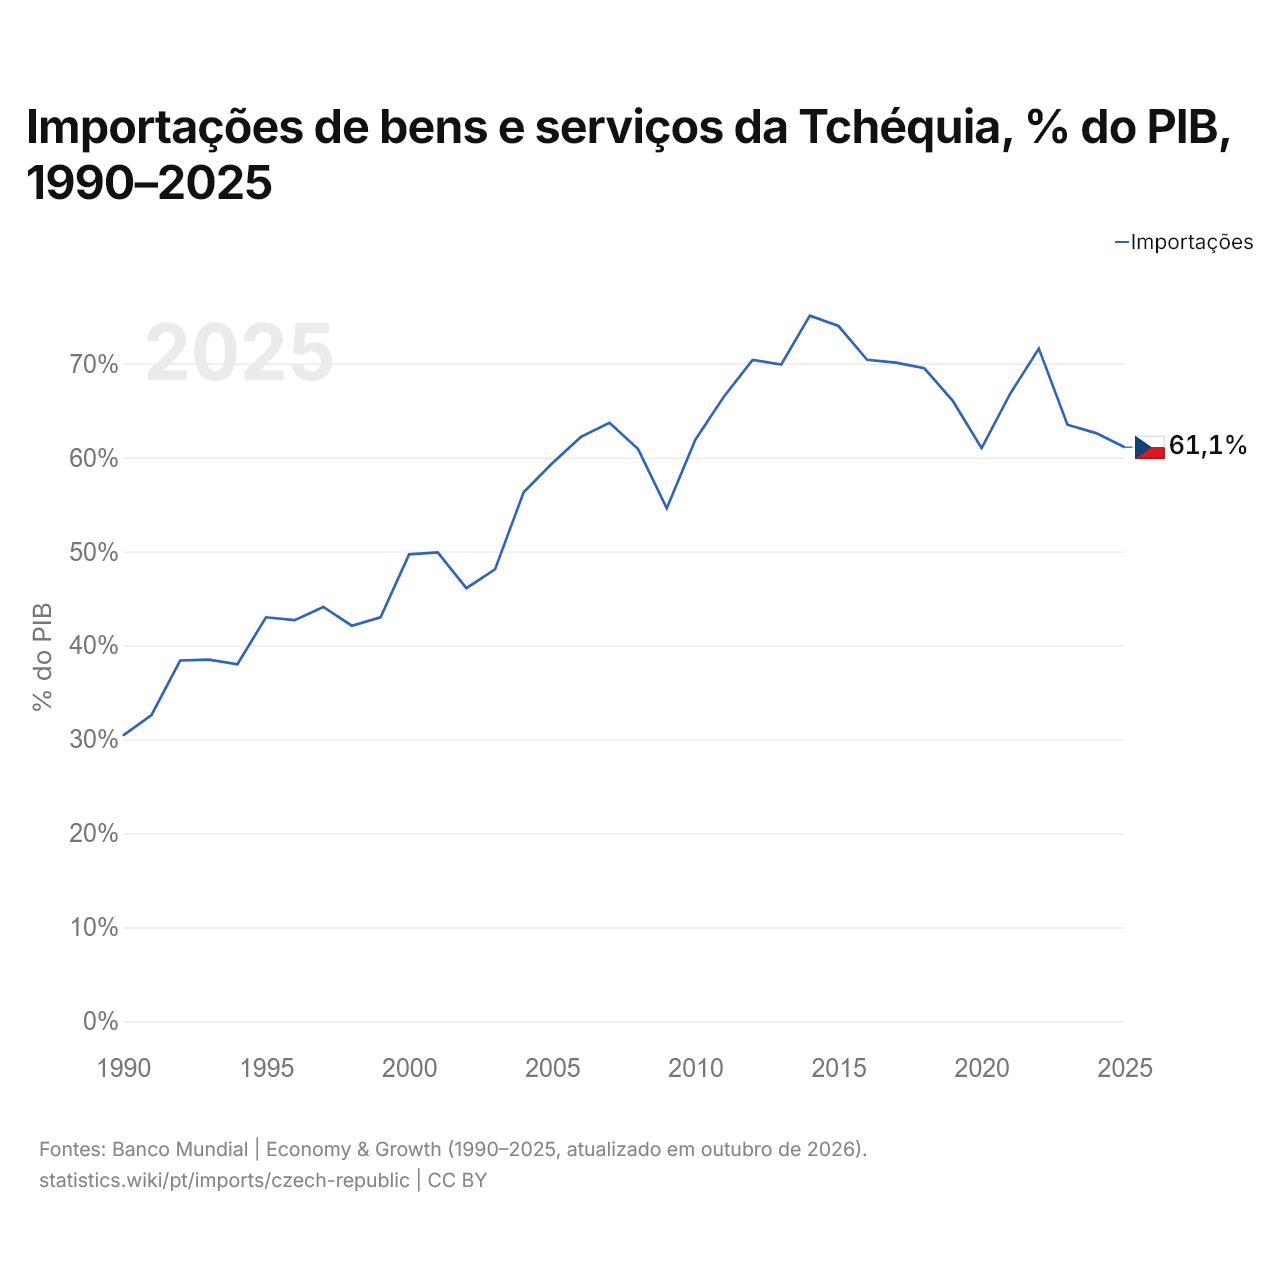
Em 2025, as importações de bens e serviços da Tchéquia equivaleram a 61,1% do seu PIB, ante 30,4% em 1990. A maior participação foi de 75,1%, em 2014.
Comparar as importações da Tchéquia com as de outros países
Fontes:
- TradeMap (2001–2025, atualizado em outubro de 2026)
- Banco Mundial | Economy & Growth (1990–2025, atualizado em outubro de 2026)
Creative Commons Atribuição (CC BY): você pode copiar, compartilhar, adaptar e reutilizar este conteúdo, inclusive para fins comerciais, desde que cite o statistics.wiki e indique as alterações que fizer. As fontes listadas acima podem ter suas próprias condições de licença.