
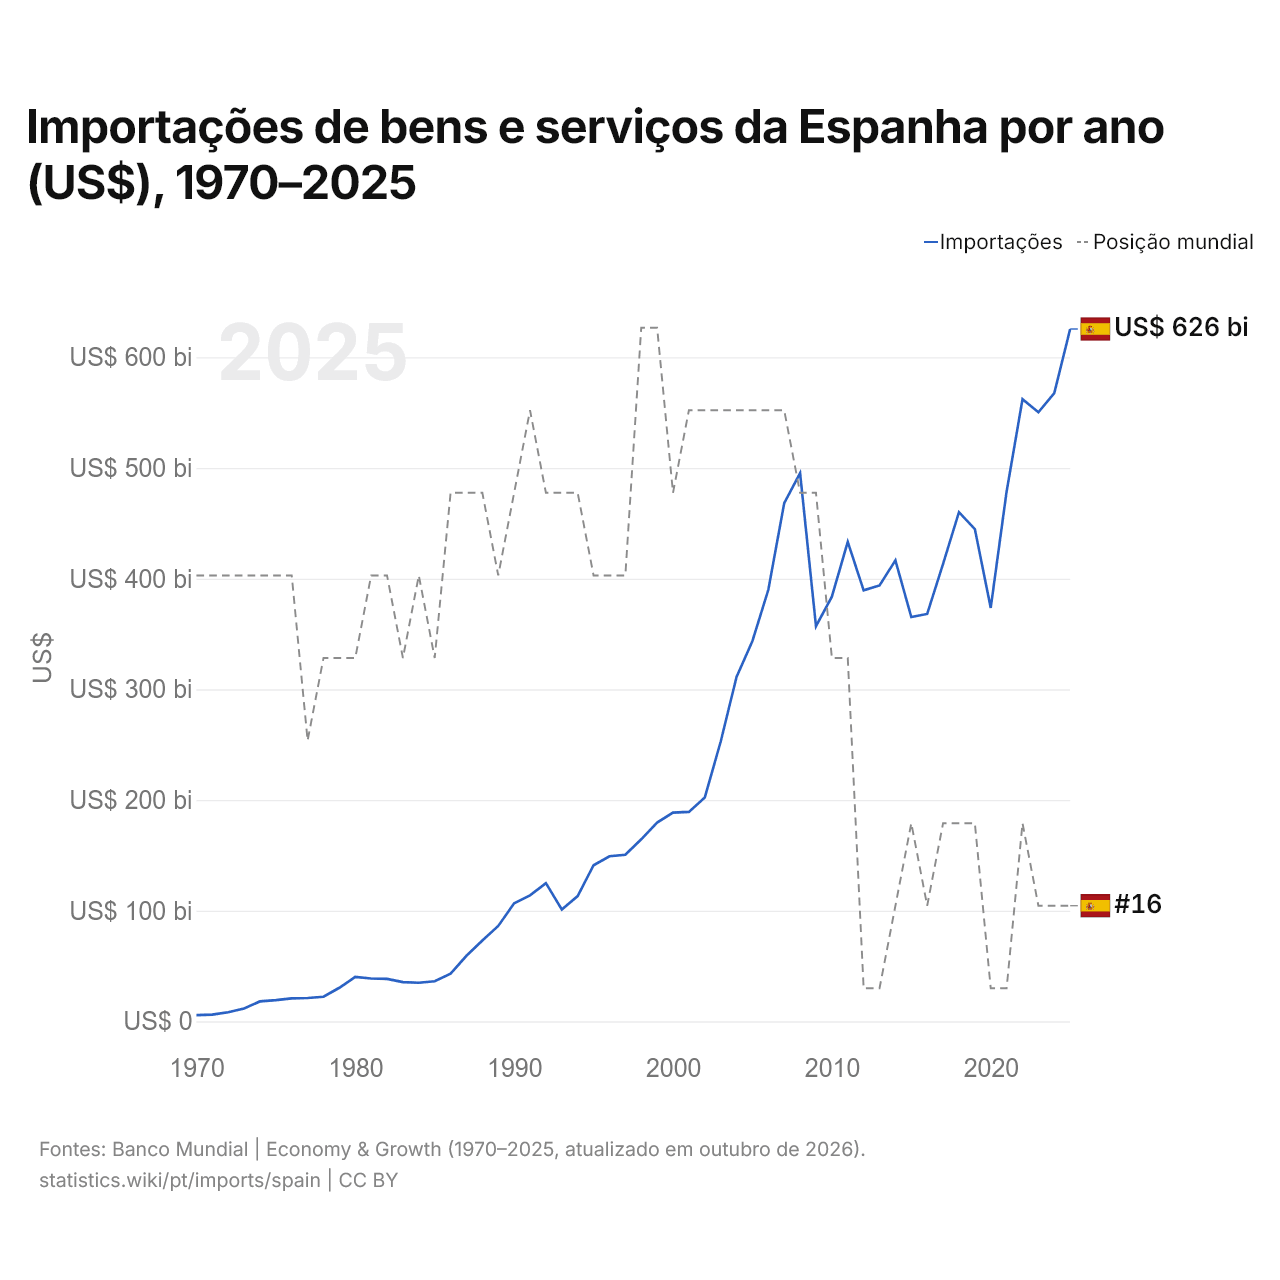
Importações de bens e serviços da Espanha por ano (US$), 1970–2025
| Ano | US$ | Posição mundial |
|---|---|---|
| Importações | Posição mundial | |
| 2025 | US$ 625.571.094.599 | #16 |
| 2024 | US$ 567.649.024.934 | #16 |
| 2023 | US$ 550.315.993.016 | #16 |
| 2022 | US$ 562.067.869.749 | #15 |
| 2021 | US$ 478.813.490.690 | #17 |
| 2020 | US$ 373.587.218.923 | #17 |
| 2019 | US$ 444.777.298.016 | #15 |
| 2018 | US$ 460.052.638.839 | #15 |
| 2017 | US$ 413.273.524.151 | #15 |
| 2016 | US$ 368.077.385.210 | #16 |
| 2015 | US$ 365.267.176.774 | #15 |
| 2014 | US$ 416.556.734.925 | #16 |
| 2013 | US$ 393.853.404.529 | #17 |
| 2012 | US$ 389.373.194.053 | #17 |
| 2011 | US$ 433.230.760.963 | #13 |
| 2010 | US$ 383.637.214.717 | #13 |
| 2009 | US$ 356.955.506.971 | #11 |
| 2008 | US$ 495.421.038.137 | #11 |
| 2007 | US$ 468.185.448.713 | #10 |
| 2006 | US$ 389.916.169.856 | #10 |
| 2005 | US$ 343.612.756.868 | #10 |
| 2004 | US$ 311.226.847.419 | #10 |
| 2003 | US$ 252.597.164.852 | #10 |
| 2002 | US$ 202.315.899.880 | #10 |
| 2001 | US$ 189.199.946.438 | #10 |
| 2000 | US$ 188.597.988.060 | #11 |
| 1999 | US$ 179.579.068.361 | #9 |
| 1998 | US$ 164.461.521.328 | #9 |
| 1997 | US$ 150.448.863.636 | #12 |
| 1996 | US$ 149.160.646.263 | #12 |
| 1995 | US$ 141.040.832.666 | #12 |
| 1994 | US$ 113.185.677.556 | #11 |
| 1993 | US$ 101.028.880.899 | #11 |
| 1992 | US$ 124.858.948.480 | #11 |
| 1991 | US$ 113.803.519.616 | #10 |
| 1990 | US$ 106.698.684.296 | #11 |
| 1989 | US$ 86.193.191.848 | #12 |
| 1988 | US$ 73.014.657.906 | #11 |
| 1987 | US$ 59.270.990.433 | #11 |
| 1986 | US$ 43.101.197.576 | #11 |
| 1985 | US$ 36.161.758.317 | #13 |
| 1984 | US$ 34.830.495.757 | #12 |
| 1983 | US$ 35.374.945.476 | #13 |
| 1982 | US$ 38.319.582.008 | #12 |
| 1981 | US$ 38.729.324.203 | #12 |
| 1980 | US$ 40.198.018.102 | #13 |
| 1979 | US$ 30.326.926.128 | #13 |
| 1978 | US$ 22.235.898.438 | #13 |
| 1977 | US$ 21.074.790.800 | #14 |
| 1976 | US$ 20.751.158.916 | #12 |
| 1975 | US$ 19.179.240.580 | #12 |
| 1974 | US$ 18.006.071.532 | #12 |
| 1973 | US$ 11.627.215.877 | #12 |
| 1972 | US$ 8.184.827.854 | #12 |
| 1971 | US$ 6.004.950.898 | #12 |
| 1970 | US$ 5.612.265.272 | #12 |
Em 2025, as importações de bens e serviços da Espanha foram de US$ 626 bilhões, ante US$ 5,61 bilhões em 1970. Foram as 16ª maiores do mundo, posição que mantêm desde 2023. Sua melhor posição foi o 9º lugar, ocupado pela última vez em 1999.
Em 2025, as importações de bens e serviços da Espanha foram as 8ª maiores de 41 países da Europa. Em 2025, as exportações da Espanha superaram as importações em US$ 72,9 bilhões, um superávit comercial. O comércio da Espanha, exportações e importações somadas, equivaleu a 69,5% do seu PIB em 2025, o 106º lugar do mundo.
Importações de bens da Espanha por categoria, 2025
Importações de bens, 2025: US$ 502 bi
Em 2025, a maior categoria das importações de bens da Espanha foi máquinas, eletrônicos e veículos, com 32,8%, seguida de petróleo, gás, minérios e outras matérias-primas, com 15,3%.
Origens das importações de bens da Espanha: as 10 principais, 2025
| Posição | País | Importações de bens | Participação | |
|---|---|---|---|---|
| 1 |
 China |
US$ 55,7 bi | 11,1% | |
| 2 |
 Alemanha |
US$ 55,3 bi | 11% | vs Alemanha |
| 3 |
 França |
US$ 41,5 bi | 8,27% | vs França |
| 4 |
 Itália |
US$ 34,8 bi | 6,92% | vs Itália |
| 5 |
 Estados Unidos |
US$ 33,5 bi | 6,67% | vs EUA |
| 6 |
 Países Baixos |
US$ 23,4 bi | 4,66% | vs Países Baixos |
| 7 |
 Portugal |
US$ 17,5 bi | 3,49% | vs Portugal |
| 8 |
 Bélgica |
US$ 12,3 bi | 2,45% | vs Bélgica |
| 9 |
 Reino Unido |
US$ 12,0 bi | 2,4% | vs RU |
| 10 |
 Marrocos |
US$ 11,7 bi | 2,34% | vs Marrocos |
| Outros parceiros e não especificados | US$ 204 bi | 40,7% |
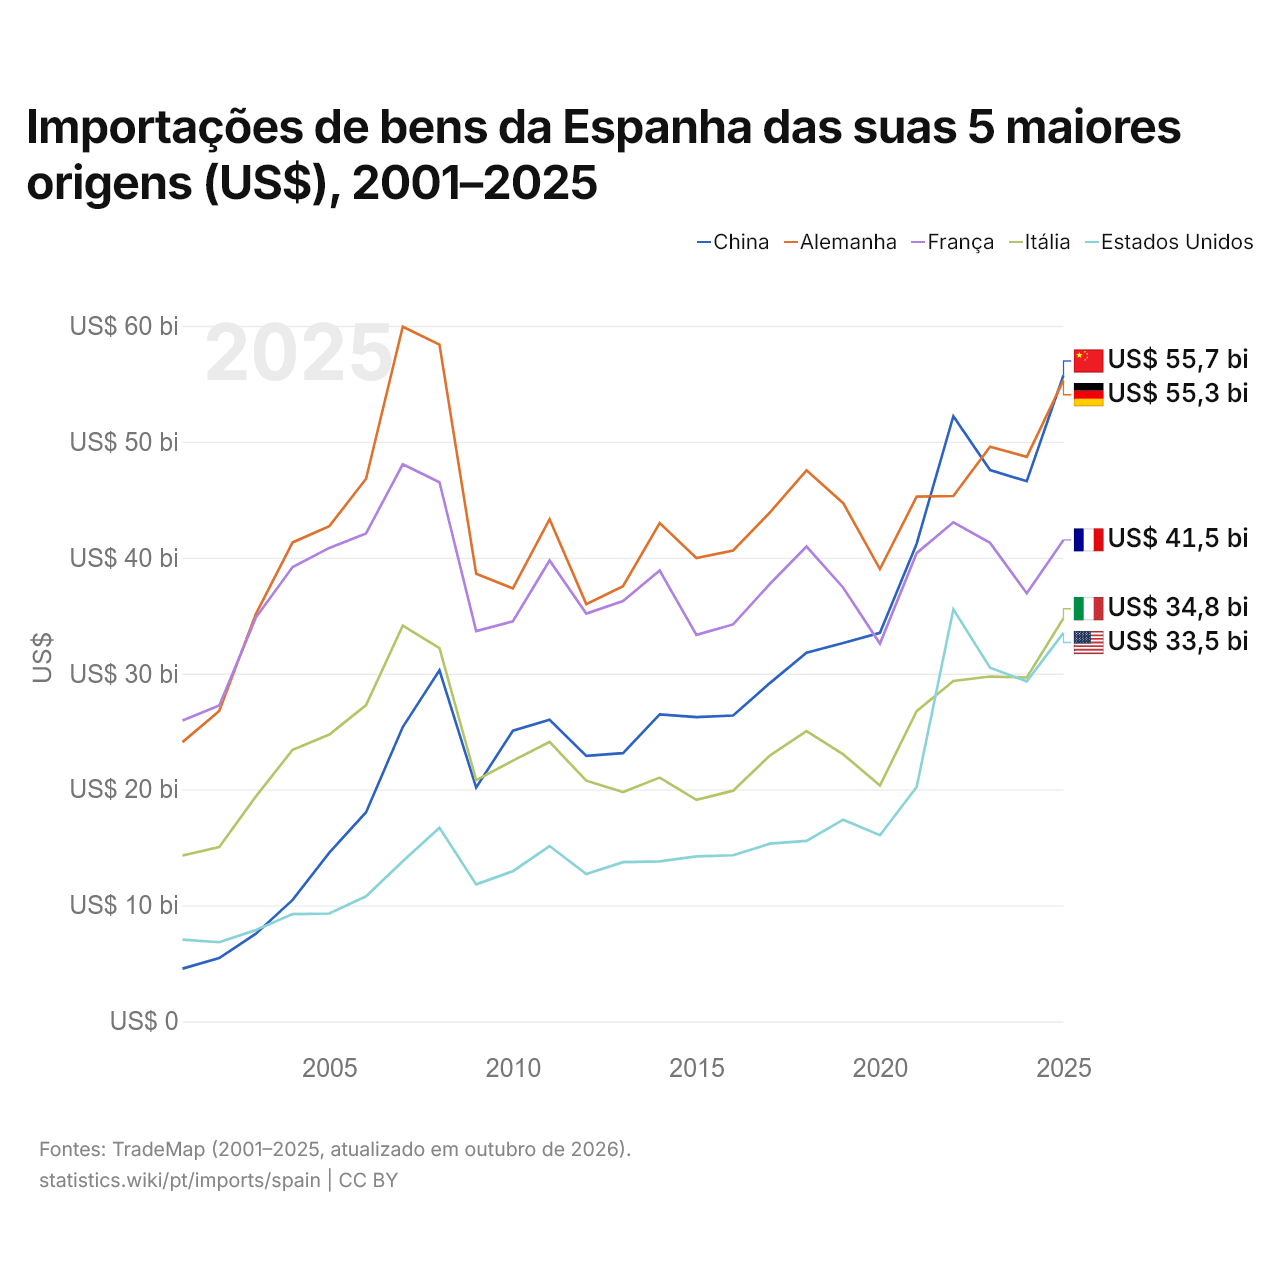
Importações de bens da Espanha das suas 5 maiores origens (US$), 2001–2025
| Ano | US$ | ||||
|---|---|---|---|---|---|
| China | Alemanha | França | Itália | Estados Unidos | |
| 2025 | US$ 55.731.210.000 | US$ 55.284.967.000 | US$ 41.528.874.000 | US$ 34.766.526.000 | US$ 33.506.882.000 |
| 2024 | US$ 46.595.993.000 | US$ 48.697.770.000 | US$ 36.920.238.000 | US$ 29.663.789.000 | US$ 29.326.970.000 |
| 2023 | US$ 47.555.396.000 | US$ 49.573.324.000 | US$ 41.271.451.000 | US$ 29.743.039.000 | US$ 30.500.025.000 |
| 2022 | US$ 52.200.709.000 | US$ 45.319.164.000 | US$ 43.049.829.000 | US$ 29.363.114.000 | US$ 35.543.993.000 |
| 2021 | US$ 41.200.348.000 | US$ 45.267.772.000 | US$ 40.391.225.000 | US$ 26.763.621.000 | US$ 20.212.989.000 |
| 2020 | US$ 33.510.178.000 | US$ 39.010.101.000 | US$ 32.583.825.000 | US$ 20.344.913.000 | US$ 16.052.697.000 |
| 2019 | US$ 32.637.726.000 | US$ 44.699.915.000 | US$ 37.405.858.000 | US$ 23.030.184.000 | US$ 17.395.948.000 |
| 2018 | US$ 31.797.407.000 | US$ 47.537.565.000 | US$ 40.958.309.000 | US$ 25.037.977.000 | US$ 15.565.485.000 |
| 2017 | US$ 29.179.069.000 | US$ 43.888.223.000 | US$ 37.726.731.000 | US$ 22.929.854.000 | US$ 15.324.826.000 |
| 2016 | US$ 26.378.797.000 | US$ 40.618.308.000 | US$ 34.239.347.000 | US$ 19.898.631.000 | US$ 14.328.022.000 |
| 2015 | US$ 26.242.883.000 | US$ 39.973.431.000 | US$ 33.340.966.000 | US$ 19.101.615.000 | US$ 14.225.073.000 |
| 2014 | US$ 26.485.813.000 | US$ 42.978.065.000 | US$ 38.888.744.000 | US$ 21.025.448.000 | US$ 13.794.429.000 |
| 2013 | US$ 23.133.389.000 | US$ 37.544.061.000 | US$ 36.264.476.000 | US$ 19.778.760.000 | US$ 13.733.834.000 |
| 2012 | US$ 22.898.486.000 | US$ 35.990.214.000 | US$ 35.170.243.000 | US$ 20.760.251.000 | US$ 12.701.791.000 |
| 2011 | US$ 26.020.564.000 | US$ 43.314.359.000 | US$ 39.759.285.000 | US$ 24.102.726.000 | US$ 15.120.958.000 |
| 2010 | US$ 25.071.365.000 | US$ 37.342.200.000 | US$ 34.509.760.000 | US$ 22.490.783.000 | US$ 12.951.744.000 |
| 2009 | US$ 20.164.542.000 | US$ 38.605.660.000 | US$ 33.663.705.000 | US$ 20.811.784.000 | US$ 11.814.141.000 |
| 2008 | US$ 30.277.927.000 | US$ 58.374.723.000 | US$ 46.500.144.000 | US$ 32.202.158.000 | US$ 16.708.480.000 |
| 2007 | US$ 25.387.194.000 | US$ 59.916.821.000 | US$ 48.050.273.000 | US$ 34.136.743.000 | US$ 13.805.288.000 |
| 2006 | US$ 18.042.441.000 | US$ 46.808.023.000 | US$ 42.087.327.000 | US$ 27.283.520.000 | US$ 10.784.263.000 |
| 2005 | US$ 14.557.162.000 | US$ 42.711.616.000 | US$ 40.840.968.000 | US$ 24.746.080.000 | US$ 9.301.619.000 |
| 2004 | US$ 10.477.378.000 | US$ 41.314.509.000 | US$ 39.192.651.000 | US$ 23.425.982.000 | US$ 9.252.167.000 |
| 2003 | US$ 7.562.881.000 | US$ 35.151.974.000 | US$ 34.835.470.000 | US$ 19.402.401.000 | US$ 7.877.136.000 |
| 2002 | US$ 5.462.833.000 | US$ 26.777.060.000 | US$ 27.251.192.000 | US$ 15.024.477.000 | US$ 6.819.790.000 |
| 2001 | US$ 4.545.039.000 | US$ 24.084.520.000 | US$ 25.956.856.000 | US$ 14.311.340.000 | US$ 7.044.178.000 |
Em 2025, as importações de bens foram de US$ 55,7 bilhões da China, US$ 55,3 bilhões da Alemanha, US$ 41,5 bilhões da França, US$ 34,8 bilhões da Itália e US$ 33,5 bilhões dos Estados Unidos.
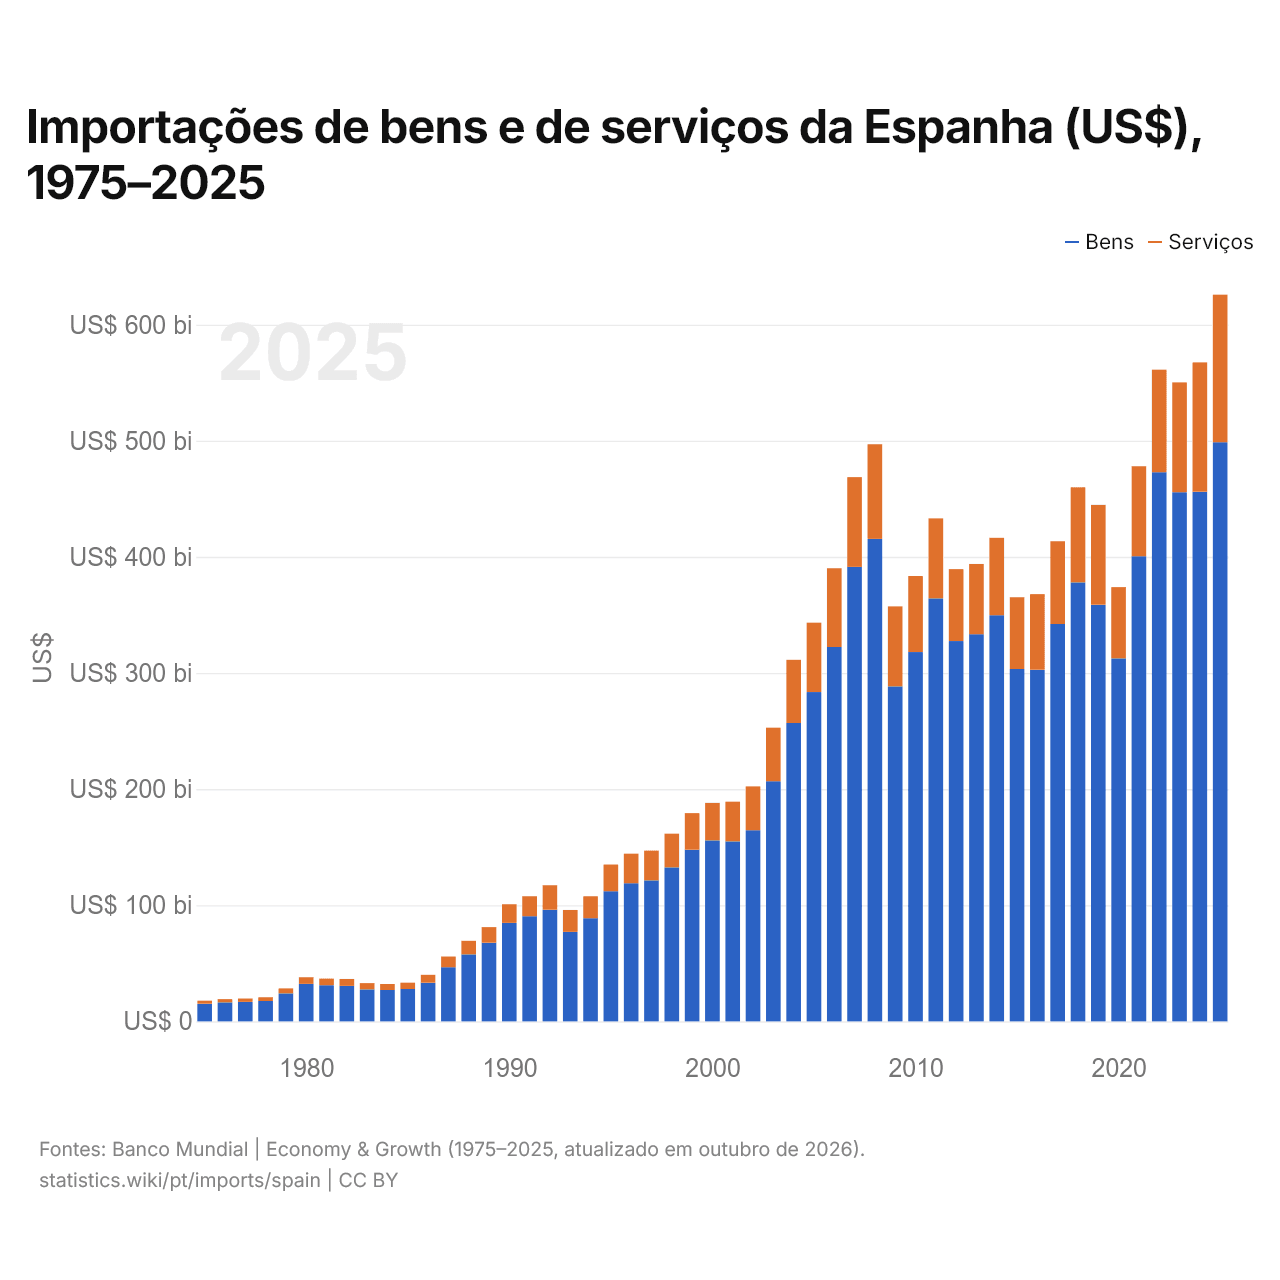
Importações de bens e de serviços da Espanha (US$), 1975–2025
| Ano | US$ | |
|---|---|---|
| Bens | Serviços | |
| 2025 | US$ 498.723.626.452 | US$ 127.089.152.999 |
| 2024 | US$ 456.093.528.217 | US$ 111.348.287.451 |
| 2023 | US$ 455.710.096.190 | US$ 94.571.096.402 |
| 2022 | US$ 472.923.950.975 | US$ 88.304.601.204 |
| 2021 | US$ 400.515.407.814 | US$ 77.517.344.278 |
| 2020 | US$ 312.525.360.936 | US$ 61.426.945.841 |
| 2019 | US$ 358.871.553.212 | US$ 85.903.222.114 |
| 2018 | US$ 377.961.589.924 | US$ 81.927.543.532 |
| 2017 | US$ 342.213.372.290 | US$ 71.249.444.868 |
| 2016 | US$ 302.850.013.843 | US$ 65.042.474.740 |
| 2015 | US$ 303.444.140.285 | US$ 61.765.728.055 |
| 2014 | US$ 349.750.725.802 | US$ 66.694.902.068 |
| 2013 | US$ 333.351.955.854 | US$ 60.549.275.686 |
| 2012 | US$ 327.487.379.936 | US$ 61.948.011.784 |
| 2011 | US$ 364.129.710.377 | US$ 68.999.845.284 |
| 2010 | US$ 318.032.841.576 | US$ 65.463.888.581 |
| 2009 | US$ 288.498.971.675 | US$ 68.897.772.077 |
| 2008 | US$ 415.495.708.346 | US$ 81.513.053.467 |
| 2007 | US$ 391.342.785.006 | US$ 77.305.814.260 |
| 2006 | US$ 322.368.649.408 | US$ 67.854.760.674 |
| 2005 | US$ 283.552.164.507 | US$ 59.789.285.629 |
| 2004 | US$ 256.922.088.563 | US$ 54.412.727.857 |
| 2003 | US$ 206.721.241.988 | US$ 46.138.290.964 |
| 2002 | US$ 164.587.227.390 | US$ 37.753.395.512 |
| 2001 | US$ 154.885.224.379 | US$ 34.254.169.624 |
| 2000 | US$ 155.779.893.073 | US$ 32.354.408.268 |
| 1999 | US$ 147.837.855.914 | US$ 31.500.040.112 |
| 1998 | US$ 132.569.218.831 | US$ 29.022.195.163 |
| 1997 | US$ 121.414.427.793 | US$ 25.621.472.284 |
| 1996 | US$ 118.908.580.404 | US$ 25.526.117.556 |
| 1995 | US$ 112.107.163.155 | US$ 22.893.228.012 |
| 1994 | US$ 88.817.177.645 | US$ 18.864.944.505 |
| 1993 | US$ 77.019.979.529 | US$ 18.902.208.344 |
| 1992 | US$ 96.246.708.830 | US$ 20.903.180.488 |
| 1991 | US$ 90.501.341.104 | US$ 17.262.512.989 |
| 1990 | US$ 84.815.312.308 | US$ 16.054.481.639 |
| 1989 | US$ 67.796.832.318 | US$ 13.375.720.603 |
| 1988 | US$ 57.650.272.270 | US$ 11.730.692.209 |
| 1987 | US$ 46.547.497.094 | US$ 9.310.683.793 |
| 1986 | US$ 33.278.097.847 | US$ 6.778.072.943 |
| 1985 | US$ 27.835.784.646 | US$ 5.434.605.914 |
| 1984 | US$ 26.984.813.184 | US$ 5.138.878.540 |
| 1983 | US$ 27.559.824.231 | US$ 5.386.547.710 |
| 1982 | US$ 30.542.100.857 | US$ 5.952.980.317 |
| 1981 | US$ 31.086.385.275 | US$ 5.714.393.176 |
| 1980 | US$ 32.271.932.918 | US$ 5.732.459.333 |
| 1979 | US$ 24.040.607.223 | US$ 4.284.122.057 |
| 1978 | US$ 17.555.418.767 | US$ 3.183.679.569 |
| 1977 | US$ 16.736.326.573 | US$ 2.895.385.455 |
| 1976 | US$ 16.299.386.812 | US$ 2.807.259.932 |
| 1975 | US$ 15.206.882.216 | US$ 2.538.906.092 |
Em 2025, as importações de bens da Espanha foram de US$ 499 bilhões e as de serviços, de US$ 127 bilhões; os serviços representaram 20,3% do total, ante 14,3% em 1975.
A Espanha na classificação mundial de importações, 2025
| Posição | País | Importações | Participação mundial | |
|---|---|---|---|---|
| 13 |
 México |
US$ 738 bi | 2,19% | vs México |
| 14 |
 Suíça |
US$ 721 bi | 2,14% | vs Suíça |
| 15 |
 Irlanda |
US$ 721 bi | 2,14% | vs Irlanda |
| 16 |
 Espanha |
US$ 626 bi | 1,85% | |
| 17 |
Bélgica
|
US$ 562 bi | 1,67% | vs Bélgica |
| 18 |
 Taiwan |
US$ 503 bi | 1,49% | |
| 19 |
 Polônia |
US$ 488 bi | 1,45% | vs Polônia |
Importações de bens e serviços da Espanha, % do PIB, 1970–2025
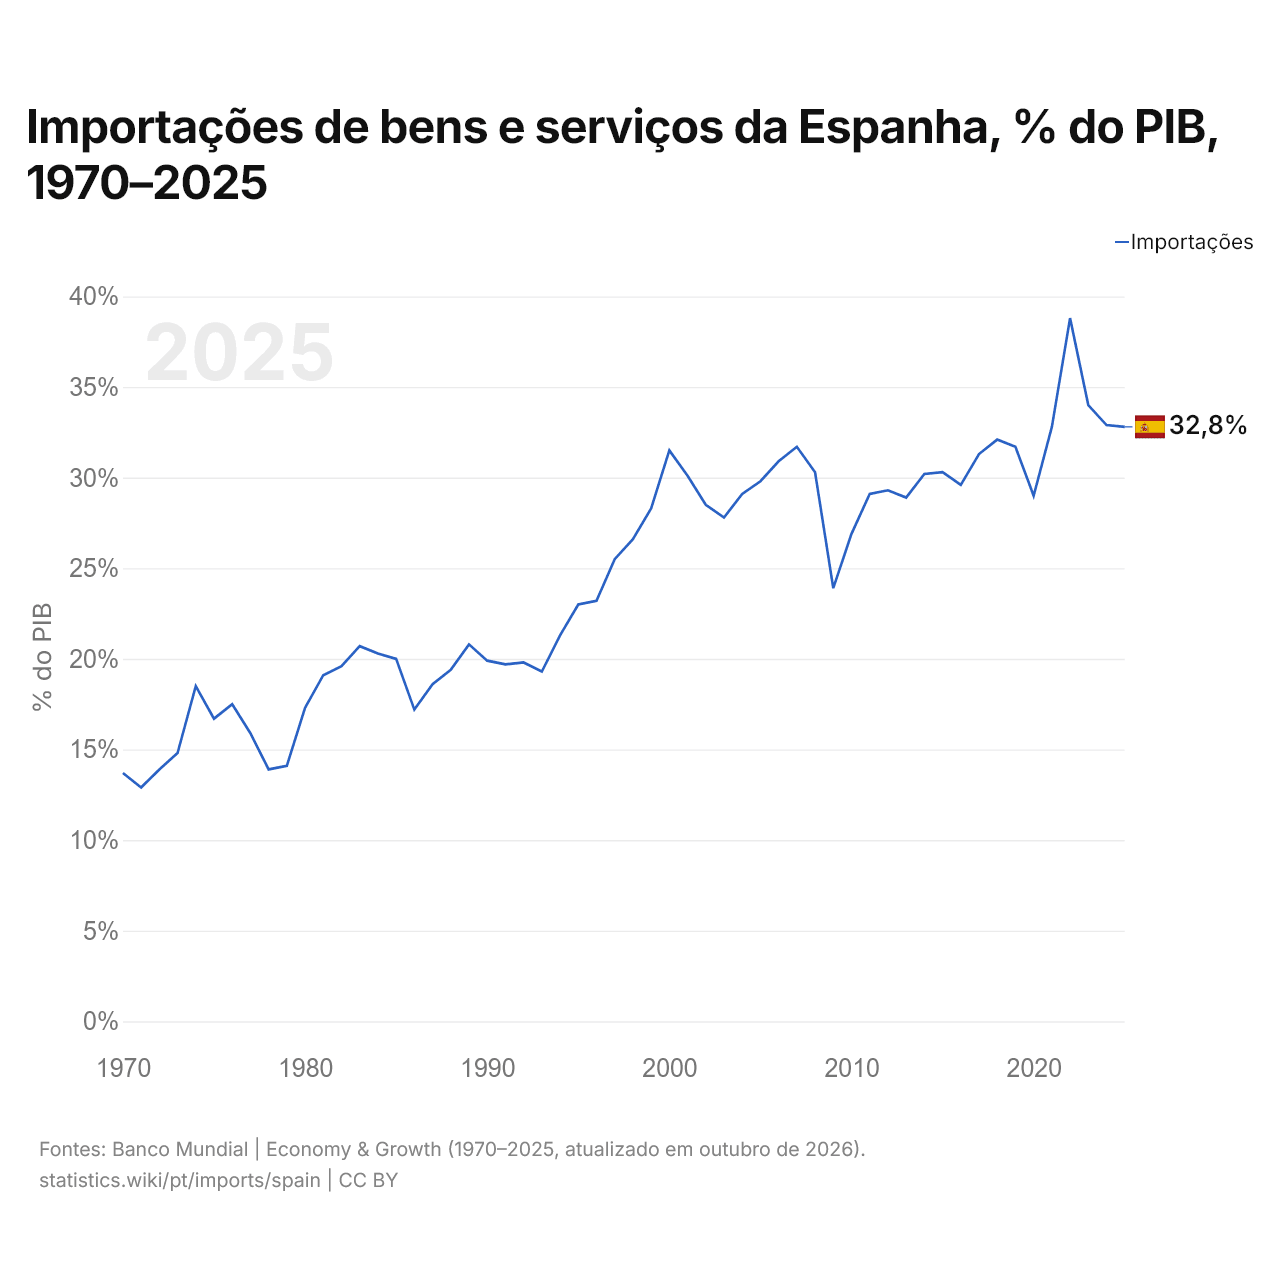
Em 2025, as importações de bens e serviços da Espanha equivaleram a 32,8% do seu PIB, ante 13,7% em 1970. A maior participação foi de 38,8%, em 2022.
Comparar as importações da Espanha com as de outros países
Fontes:
- TradeMap (2001–2025, atualizado em outubro de 2026)
- Banco Mundial | Economy & Growth (1970–2025, atualizado em outubro de 2026)
Creative Commons Atribuição (CC BY): você pode copiar, compartilhar, adaptar e reutilizar este conteúdo, inclusive para fins comerciais, desde que cite o statistics.wiki e indique as alterações que fizer. As fontes listadas acima podem ter suas próprias condições de licença.