
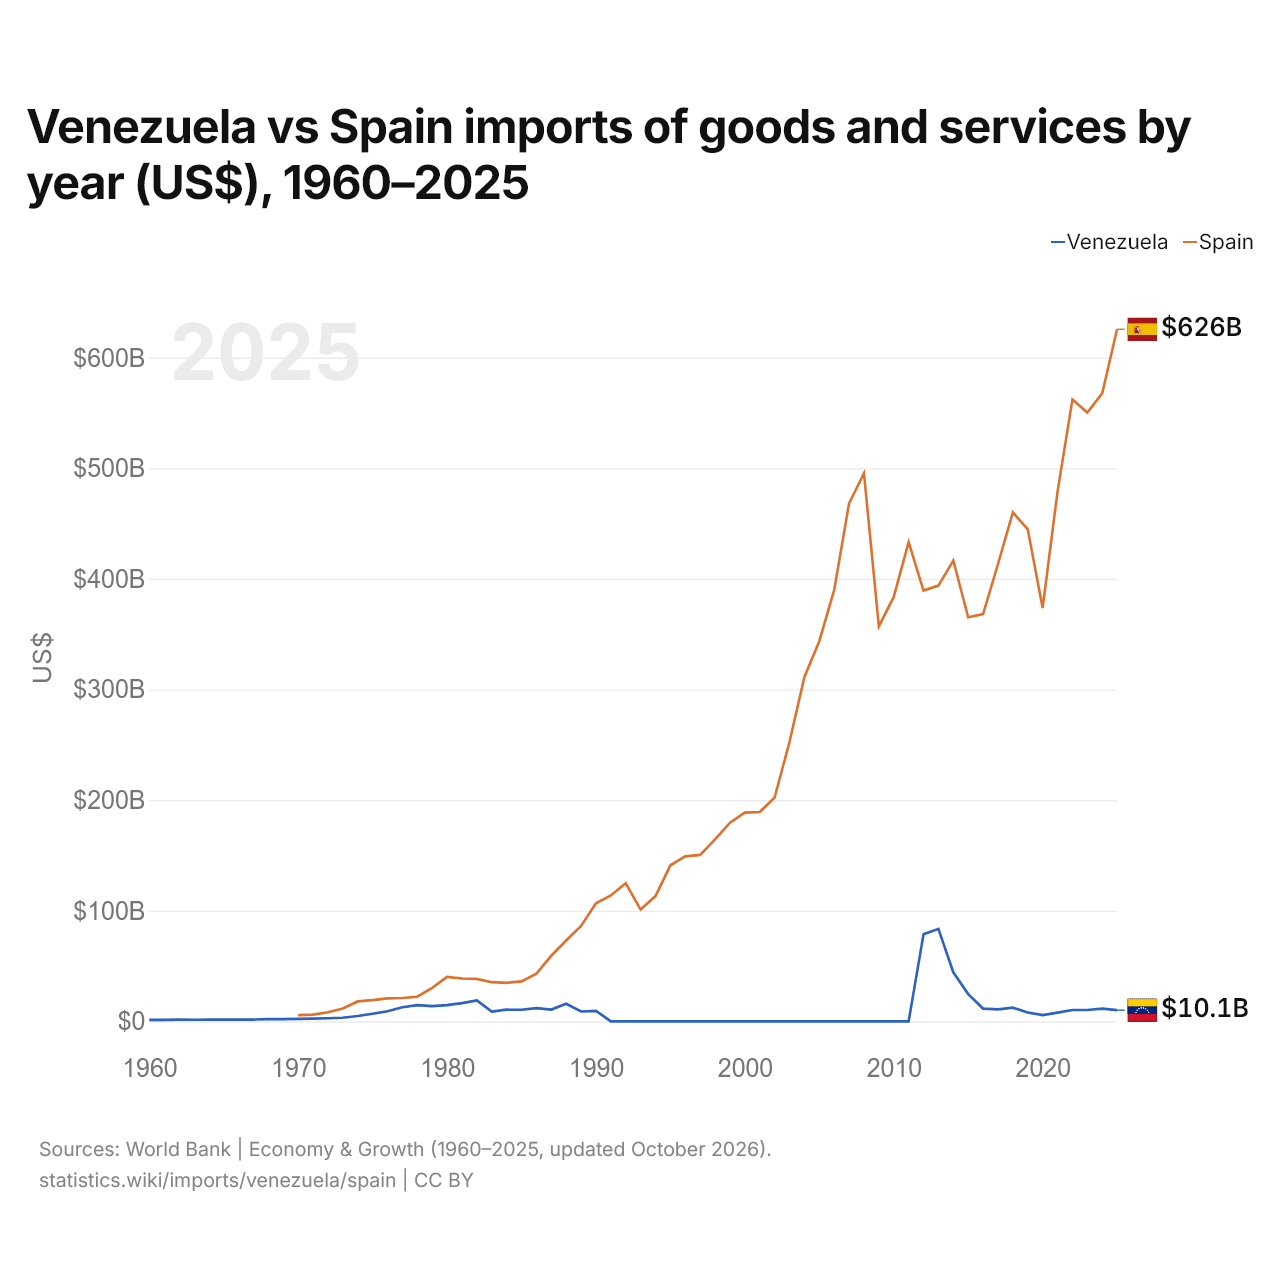
Venezuela vs Espanha: importações de bens e serviços por ano (US$), 1960–2025
1x
| Ano | US$ | |
|---|---|---|
 Venezuela |
 Espanha |
|
| 2025 | US$ 10.074.121.350 | US$ 625.571.094.599 |
| 2024 | US$ 11.456.619.839 | US$ 567.649.024.934 |
| 2023 | US$ 10.266.483.009 | US$ 550.315.993.016 |
| 2022 | US$ 10.280.104.687 | US$ 562.067.869.749 |
| 2021 | US$ 7.856.090.324 | US$ 478.813.490.690 |
| 2020 | US$ 5.605.400.729 | US$ 373.587.218.923 |
| 2019 | US$ 7.982.721.069 | US$ 444.777.298.016 |
| 2018 | US$ 12.326.332.795 | US$ 460.052.638.839 |
| 2017 | US$ 10.756.686.685 | US$ 413.273.524.151 |
| 2016 | US$ 11.515.036.488 | US$ 368.077.385.210 |
| 2015 | US$ 24.577.347.081 | US$ 365.267.176.774 |
| 2014 | US$ 44.352.366.681 | US$ 416.556.734.925 |
| 2013 | US$ 83.592.737.983 | US$ 393.853.404.529 |
| 2012 | US$ 78.668.126.778 | US$ 389.373.194.053 |
| 2011 | US$ 0 | US$ 433.230.760.963 |
| 2010 | US$ 0 | US$ 383.637.214.717 |
| 2009 | US$ 0 | US$ 356.955.506.971 |
| 2008 | US$ 0 | US$ 495.421.038.137 |
| 2007 | US$ 0 | US$ 468.185.448.713 |
| 2006 | US$ 0 | US$ 389.916.169.856 |
| 2005 | US$ 0 | US$ 343.612.756.868 |
| 2004 | US$ 0 | US$ 311.226.847.419 |
| 2003 | US$ 0 | US$ 252.597.164.852 |
| 2002 | US$ 0 | US$ 202.315.899.880 |
| 2001 | US$ 0 | US$ 189.199.946.438 |
| 2000 | US$ 0 | US$ 188.597.988.060 |
| 1999 | US$ 0 | US$ 179.579.068.361 |
| 1998 | US$ 0 | US$ 164.461.521.328 |
| 1997 | US$ 0 | US$ 150.448.863.636 |
| 1996 | US$ 0 | US$ 149.160.646.263 |
| 1995 | US$ 0 | US$ 141.040.832.666 |
| 1994 | US$ 0 | US$ 113.185.677.556 |
| 1993 | US$ 0 | US$ 101.028.880.899 |
| 1992 | US$ 0 | US$ 124.858.948.480 |
| 1991 | US$ 0 | US$ 113.803.519.616 |
| 1990 | US$ 9.493.861.738 | US$ 106.698.684.296 |
| 1989 | US$ 8.884.312.275 | US$ 86.193.191.848 |
| 1988 | US$ 15.910.262.069 | US$ 73.014.657.906 |
| 1987 | US$ 10.598.117.241 | US$ 59.270.990.433 |
| 1986 | US$ 11.927.109.278 | US$ 43.101.197.576 |
| 1985 | US$ 10.466.520.000 | US$ 36.161.758.317 |
| 1984 | US$ 10.508.123.515 | US$ 34.830.495.757 |
| 1983 | US$ 8.799.209.302 | US$ 35.374.945.476 |
| 1982 | US$ 18.971.186.047 | US$ 38.319.582.008 |
| 1981 | US$ 16.518.209.302 | US$ 38.729.324.203 |
| 1980 | US$ 14.627.837.209 | US$ 40.198.018.102 |
| 1979 | US$ 13.727.674.419 | US$ 30.326.926.128 |
| 1978 | US$ 14.650.348.837 | US$ 22.235.898.438 |
| 1977 | US$ 12.692.465.116 | US$ 21.074.790.800 |
| 1976 | US$ 9.069.255.814 | US$ 20.751.158.916 |
| 1975 | US$ 6.863.837.209 | US$ 19.179.240.580 |
| 1974 | US$ 4.838.441.860 | US$ 18.006.071.532 |
| 1973 | US$ 3.263.139.535 | US$ 11.627.215.877 |
| 1972 | US$ 2.793.090.909 | US$ 8.184.827.854 |
| 1971 | US$ 2.463.204.545 | US$ 6.004.950.898 |
| 1970 | US$ 2.171.911.111 | US$ 5.612.265.272 |
| 1969 | US$ 2.042.888.889 | - |
| 1968 | US$ 1.956.888.889 | - |
| 1967 | US$ 1.612.822.222 | - |
| 1966 | US$ 1.505.288.889 | - |
| 1965 | US$ 1.612.822.222 | - |
| 1964 | US$ 1.473.655.172 | - |
| 1963 | US$ 1.458.861.579 | - |
| 1962 | US$ 1.489.969.152 | - |
| 1961 | US$ 1.366.605.304 | - |
| 1960 | US$ 1.390.889.415 | - |
Em 2025, as importações de bens e serviços da Venezuela foram de US$ 10,1 bilhões e as da Espanha, de US$ 626 bilhões: as da Espanha foram 62 vezes maiores. Em 1970, as importações da Espanha foram 2,6 vezes maiores: US$ 2,17 bilhões da Venezuela e US$ 5,61 bilhões da Espanha.
Venezuela vs Espanha: dados de importações
|
Venezuela
|
Espanha
|
|
|---|---|---|
| Importações | US$ 10,1 bi (2025) | US$ 626 bi (2025) |
| Posição mundial | 118/174 | 16/174 |
| Participação mundial | 0,03% | 1,85% |
| % do PIB | 10,1% | 32,8% |
| Maior categoria de bens | n/d | Máquinas, eletrônicos e veículos (32,8%, 2025) |
| Principal origem dos bens | n/d | China (11,1%, 2025) |
Comparar as importações de 2 países quaisquer
Fontes:
- Banco Mundial | Economy & Growth (1960–2025, atualizado em outubro de 2026)
- TradeMap (2001–2025, atualizado em outubro de 2026)
Creative Commons Atribuição (CC BY): você pode copiar, compartilhar, adaptar e reutilizar este conteúdo, inclusive para fins comerciais, desde que cite o statistics.wiki e indique as alterações que fizer. As fontes listadas acima podem ter suas próprias condições de licença.