
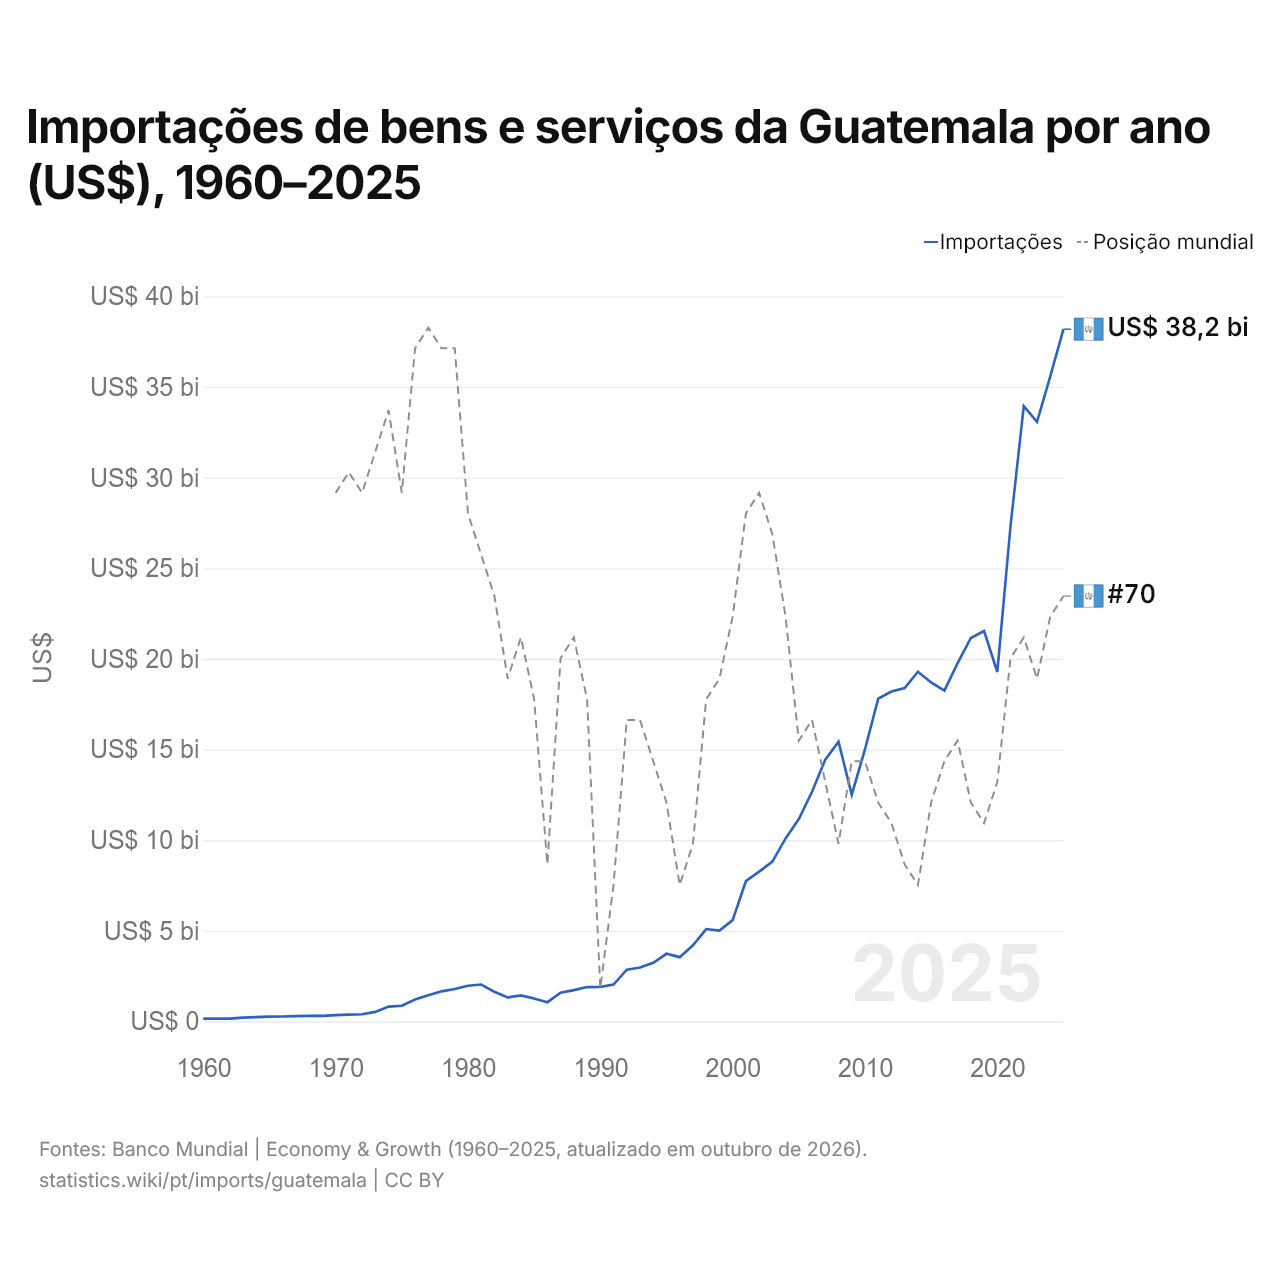
Importações de bens e serviços da Guatemala por ano (US$), 1960–2025
| Ano | US$ | Posição mundial |
|---|---|---|
| Importações | Posição mundial | |
| 2025 | US$ 38.185.944.239 | #70 |
| 2024 | US$ 35.574.411.055 | #71 |
| 2023 | US$ 33.075.327.753 | #74 |
| 2022 | US$ 33.938.882.281 | #72 |
| 2021 | US$ 27.347.172.006 | #73 |
| 2020 | US$ 19.272.211.250 | #79 |
| 2019 | US$ 21.534.755.034 | #81 |
| 2018 | US$ 21.149.628.050 | #80 |
| 2017 | US$ 19.758.074.339 | #77 |
| 2016 | US$ 18.243.717.810 | #78 |
| 2015 | US$ 18.695.335.942 | #80 |
| 2014 | US$ 19.287.280.919 | #84 |
| 2013 | US$ 18.382.911.954 | #83 |
| 2012 | US$ 18.197.166.630 | #81 |
| 2011 | US$ 17.803.200.265 | #80 |
| 2010 | US$ 15.009.546.896 | #78 |
| 2009 | US$ 12.501.436.111 | #78 |
| 2008 | US$ 15.422.428.184 | #82 |
| 2007 | US$ 14.441.173.646 | #79 |
| 2006 | US$ 12.662.747.620 | #76 |
| 2005 | US$ 11.154.959.730 | #77 |
| 2004 | US$ 10.090.013.800 | #71 |
| 2003 | US$ 8.807.734.237 | #67 |
| 2002 | US$ 8.255.070.816 | #65 |
| 2001 | US$ 7.731.202.010 | #66 |
| 2000 | US$ 5.584.251.720 | #71 |
| 1999 | US$ 5.011.108.418 | #74 |
| 1998 | US$ 5.091.730.420 | #75 |
| 1997 | US$ 4.197.706.681 | #82 |
| 1996 | US$ 3.539.822.367 | #84 |
| 1995 | US$ 3.726.925.963 | #80 |
| 1994 | US$ 3.226.456.526 | #78 |
| 1993 | US$ 2.972.656.775 | #76 |
| 1992 | US$ 2.849.942.850 | #76 |
| 1991 | US$ 2.028.682.331 | #84 |
| 1990 | US$ 1.900.459.187 | #89 |
| 1989 | US$ 1.890.234.375 | #75 |
| 1988 | US$ 1.720.152.710 | #72 |
| 1987 | US$ 1.579.400.000 | #73 |
| 1986 | US$ 1.055.296.758 | #83 |
| 1985 | US$ 1.262.260.870 | #75 |
| 1984 | US$ 1.434.800.000 | #72 |
| 1983 | US$ 1.316.999.900 | #74 |
| 1982 | US$ 1.628.999.900 | #70 |
| 1981 | US$ 2.031.500.000 | #68 |
| 1980 | US$ 1.963.300.000 | #66 |
| 1979 | US$ 1.784.400.000 | #58 |
| 1978 | US$ 1.655.000.100 | #58 |
| 1977 | US$ 1.439.000.100 | #57 |
| 1976 | US$ 1.204.100.000 | #58 |
| 1975 | US$ 858.000.000 | #65 |
| 1974 | US$ 811.400.000 | #61 |
| 1973 | US$ 519.100.000 | #63 |
| 1972 | US$ 389.500.000 | #65 |
| 1971 | US$ 371.100.000 | #64 |
| 1970 | US$ 338.500.000 | #65 |
| 1969 | US$ 299.000.000 | - |
| 1968 | US$ 296.600.000 | - |
| 1967 | US$ 283.600.000 | - |
| 1966 | US$ 266.100.000 | - |
| 1965 | US$ 261.100.000 | - |
| 1964 | US$ 235.000.000 | - |
| 1963 | US$ 201.200.000 | - |
| 1962 | US$ 153.500.000 | - |
| 1961 | US$ 145.300.000 | - |
| 1960 | US$ 151.700.000 | - |
Em 2025, as importações de bens e serviços da Guatemala foram de US$ 38,2 bilhões, ante US$ 152 milhões em 1960. O mínimo foi de US$ 145 milhões, em 1961. Foram as 70ª maiores do mundo; em 2024, eram as 71ª. Sua melhor posição foi o 57º lugar, ocupado pela última vez em 1977.
Em 2025, as importações de bens e serviços da Guatemala foram as 7ª maiores de 26 países da América Latina. Em 2025, as importações da Guatemala superaram as exportações em US$ 19 bilhões, um déficit comercial. O comércio da Guatemala, exportações e importações somadas, equivaleu a 46,5% do seu PIB em 2025, o 141º lugar do mundo.
Importações de bens da Guatemala por categoria, 2025
Importações de bens, 2025: US$ 34,6 bi
Em 2025, a maior categoria das importações de bens da Guatemala foi máquinas, eletrônicos e veículos, com 27,8%, seguida de petróleo, gás, minérios e outras matérias-primas, com 18,0%.
Origens das importações de bens da Guatemala: as 10 principais, 2025
| Posição | País | Importações de bens | Participação | |
|---|---|---|---|---|
| 1 |
 Estados Unidos |
US$ 10,9 bi | 31,5% | |
| 2 |
 China |
US$ 5,50 bi | 15,9% | |
| 3 |
 México |
US$ 3,43 bi | 9,91% | vs México |
| 4 |
 El Salvador |
US$ 1,62 bi | 4,69% | vs El Salvador |
| 5 |
 Panamá |
US$ 1,28 bi | 3,69% | vs Panamá |
| 6 |
 Costa Rica |
US$ 1,19 bi | 3,45% | vs Costa Rica |
| 7 |
 Honduras |
US$ 954 mi | 2,75% | vs Honduras |
| 8 |
 Índia |
US$ 766 mi | 2,21% | |
| 9 |
 Brasil |
US$ 685 mi | 1,98% | vs Brasil |
| 10 |
 Colômbia |
US$ 652 mi | 1,88% | vs Colômbia |
| Outros parceiros e não especificados | US$ 7,62 bi | 22% |
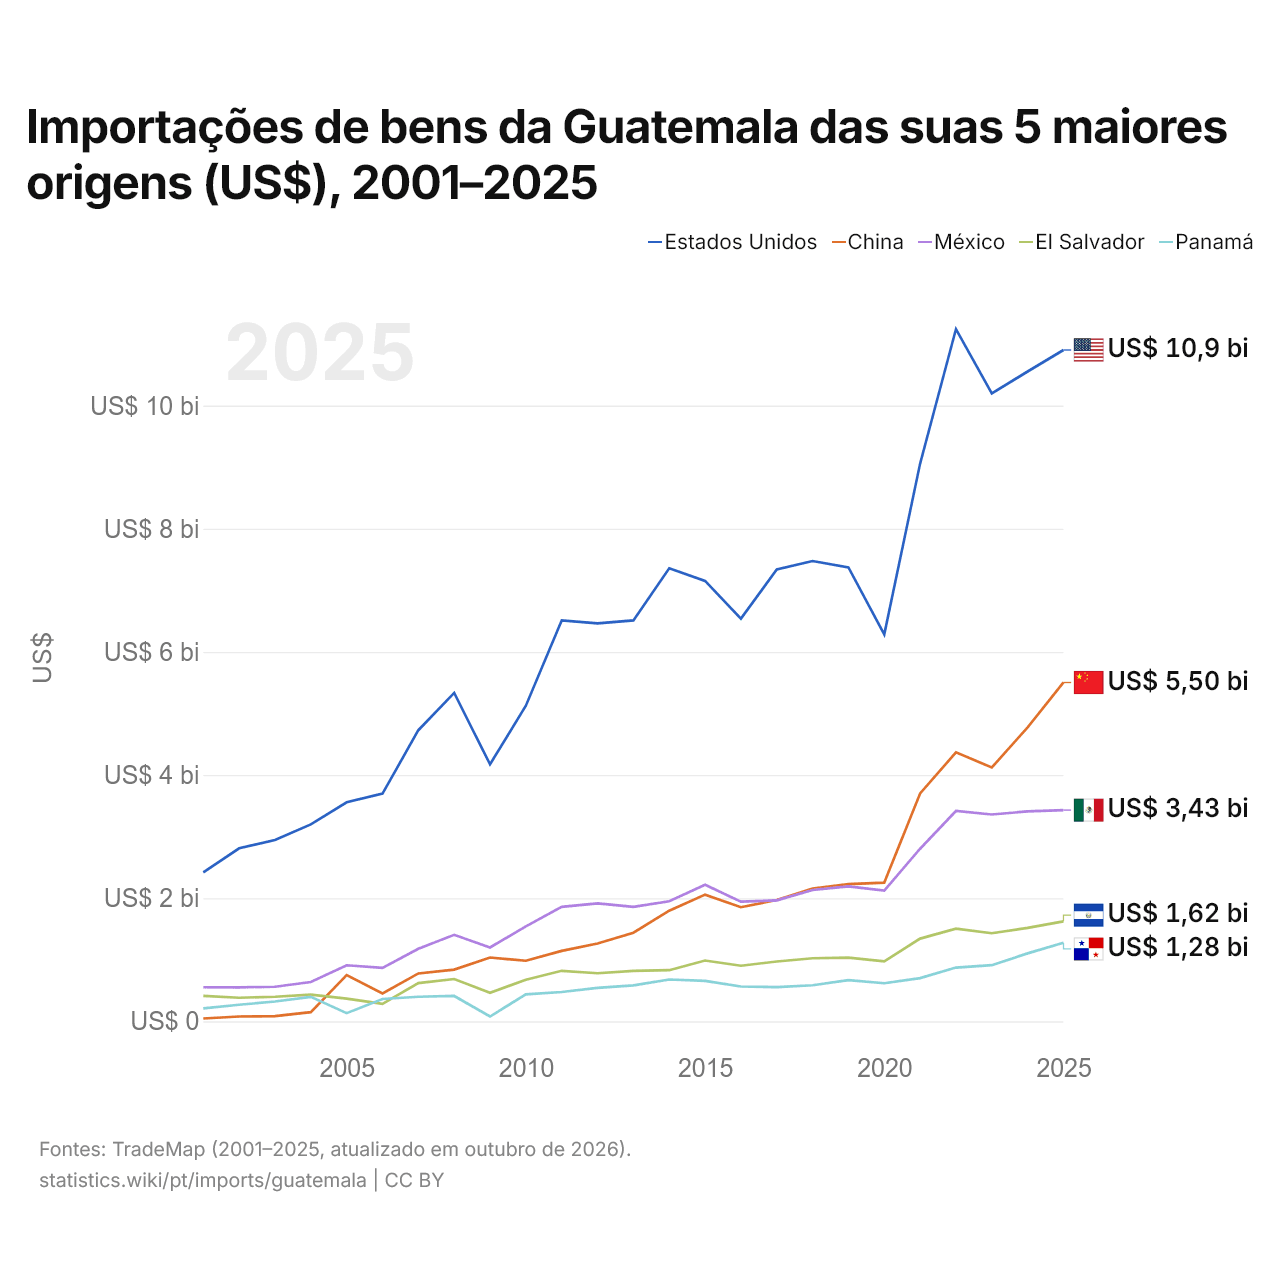
Importações de bens da Guatemala das suas 5 maiores origens (US$), 2001–2025
| Ano | US$ | ||||
|---|---|---|---|---|---|
| Estados Unidos | China | México | El Salvador | Panamá | |
| 2025 | US$ 10.903.058.000 | US$ 5.503.339.000 | US$ 3.430.258.000 | US$ 1.624.251.000 | US$ 1.276.066.000 |
| 2024 | US$ 10.553.835.000 | US$ 4.774.317.000 | US$ 3.408.806.000 | US$ 1.517.846.000 | US$ 1.103.921.000 |
| 2023 | US$ 10.198.565.000 | US$ 4.122.255.000 | US$ 3.359.753.000 | US$ 1.430.644.000 | US$ 912.162.000 |
| 2022 | US$ 11.241.619.000 | US$ 4.367.804.000 | US$ 3.415.971.000 | US$ 1.506.146.000 | US$ 873.492.000 |
| 2021 | US$ 9.058.147.000 | US$ 3.702.185.000 | US$ 2.803.262.000 | US$ 1.343.440.000 | US$ 701.555.000 |
| 2020 | US$ 6.283.903.000 | US$ 2.253.197.000 | US$ 2.124.390.000 | US$ 974.600.000 | US$ 619.211.000 |
| 2019 | US$ 7.370.988.000 | US$ 2.228.910.000 | US$ 2.192.483.000 | US$ 1.034.366.000 | US$ 669.288.000 |
| 2018 | US$ 7.476.078.000 | US$ 2.157.482.000 | US$ 2.133.570.000 | US$ 1.025.106.000 | US$ 586.555.000 |
| 2017 | US$ 7.337.755.000 | US$ 1.969.972.000 | US$ 1.964.468.000 | US$ 972.193.000 | US$ 556.639.000 |
| 2016 | US$ 6.540.021.000 | US$ 1.853.523.000 | US$ 1.942.944.000 | US$ 902.778.000 | US$ 565.671.000 |
| 2015 | US$ 7.153.154.000 | US$ 2.057.975.000 | US$ 2.217.626.000 | US$ 987.788.000 | US$ 657.537.000 |
| 2014 | US$ 7.357.977.000 | US$ 1.796.889.000 | US$ 1.950.049.000 | US$ 830.655.000 | US$ 679.748.000 |
| 2013 | US$ 6.510.815.000 | US$ 1.438.540.000 | US$ 1.860.241.000 | US$ 819.984.000 | US$ 584.875.000 |
| 2012 | US$ 6.461.996.000 | US$ 1.264.958.000 | US$ 1.915.632.000 | US$ 780.285.000 | US$ 543.402.000 |
| 2011 | US$ 6.510.430.000 | US$ 1.144.083.000 | US$ 1.859.015.000 | US$ 820.370.000 | US$ 476.969.000 |
| 2010 | US$ 5.125.632.000 | US$ 983.652.000 | US$ 1.542.538.000 | US$ 675.572.000 | US$ 438.373.000 |
| 2009 | US$ 4.174.415.000 | US$ 1.036.251.000 | US$ 1.198.655.000 | US$ 463.029.000 | US$ 78.096.000 |
| 2008 | US$ 5.334.624.000 | US$ 840.468.000 | US$ 1.405.431.000 | US$ 687.206.000 | US$ 412.007.000 |
| 2007 | US$ 4.728.229.000 | US$ 777.876.000 | US$ 1.179.594.000 | US$ 620.817.000 | US$ 399.562.000 |
| 2006 | US$ 3.698.169.000 | US$ 453.226.000 | US$ 868.972.000 | US$ 283.636.000 | US$ 363.331.000 |
| 2005 | US$ 3.558.261.000 | US$ 752.091.000 | US$ 910.163.000 | US$ 369.125.000 | US$ 132.945.000 |
| 2004 | US$ 3.198.855.000 | US$ 149.465.000 | US$ 637.570.000 | US$ 434.907.000 | US$ 398.075.000 |
| 2003 | US$ 2.944.267.000 | US$ 85.452.000 | US$ 561.900.000 | US$ 398.974.000 | US$ 322.260.000 |
| 2002 | US$ 2.810.525.000 | US$ 77.953.000 | US$ 552.573.000 | US$ 383.007.000 | US$ 268.599.000 |
| 2001 | US$ 2.418.891.000 | US$ 46.287.000 | US$ 553.161.000 | US$ 414.354.000 | US$ 211.239.000 |
Em 2025, as importações de bens foram de US$ 10,9 bilhões dos Estados Unidos, US$ 5,5 bilhões da China, US$ 3,43 bilhões do México, US$ 1,62 bilhão de El Salvador e US$ 1,28 bilhão do Panamá. O primeiro lugar dos cinco fornecedores da Guatemala ficou com os Estados Unidos em todos os anos desde 2001. A mudança mais recente nessa ordem foi em 2017, quando as importações da Guatemala vindas da China superaram as vindas do México.
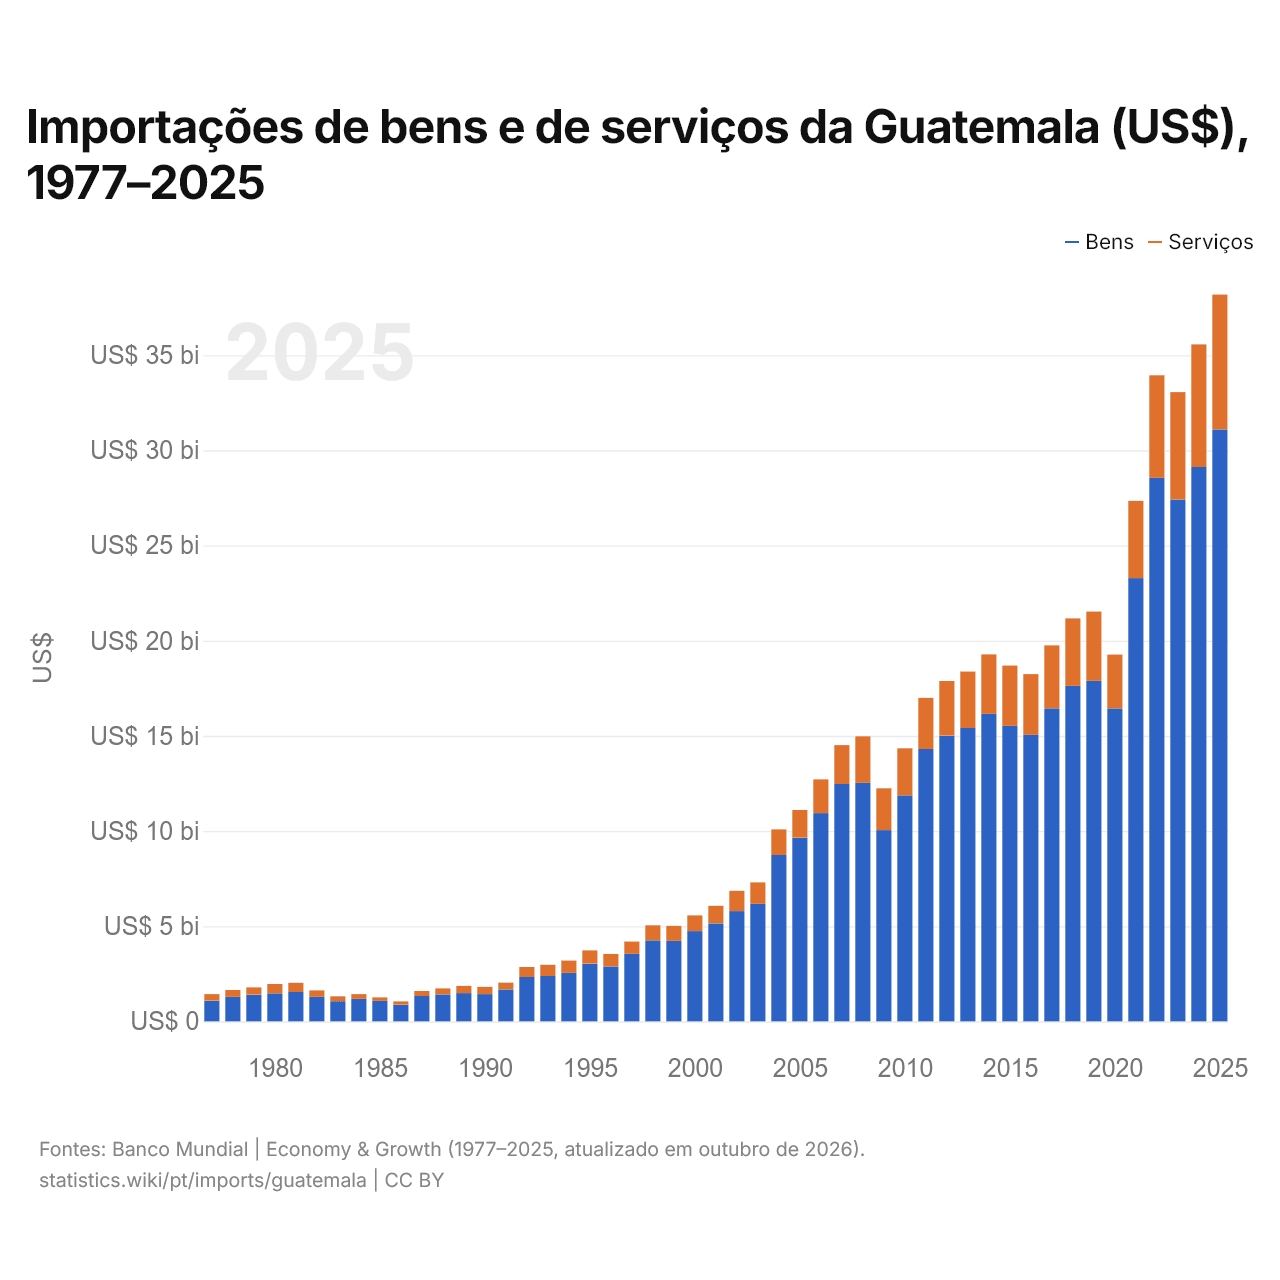
Importações de bens e de serviços da Guatemala (US$), 1977–2025
| Ano | US$ | |
|---|---|---|
| Bens | Serviços | |
| 2025 | US$ 31.097.074.460 | US$ 7.081.189.910 |
| 2024 | US$ 29.124.150.290 | US$ 6.438.725.530 |
| 2023 | US$ 27.415.202.240 | US$ 5.640.641.800 |
| 2022 | US$ 28.557.977.750 | US$ 5.385.409.950 |
| 2021 | US$ 23.289.054.410 | US$ 4.054.028.280 |
| 2020 | US$ 16.440.813.870 | US$ 2.826.135.000 |
| 2019 | US$ 17.885.429.550 | US$ 3.641.127.600 |
| 2018 | US$ 17.628.849.920 | US$ 3.541.272.390 |
| 2017 | US$ 16.442.003.190 | US$ 3.308.646.950 |
| 2016 | US$ 15.049.605.910 | US$ 3.191.883.080 |
| 2015 | US$ 15.524.036.340 | US$ 3.161.877.300 |
| 2014 | US$ 16.157.399.240 | US$ 3.122.476.250 |
| 2013 | US$ 15.412.134.810 | US$ 2.962.972.200 |
| 2012 | US$ 15.007.840.310 | US$ 2.872.040.580 |
| 2011 | US$ 14.308.649.910 | US$ 2.685.169.550 |
| 2010 | US$ 11.878.178.960 | US$ 2.468.775.680 |
| 2009 | US$ 10.046.702.870 | US$ 2.197.705.210 |
| 2008 | US$ 12.529.109.120 | US$ 2.444.638.890 |
| 2007 | US$ 12.470.200.000 | US$ 2.041.200.000 |
| 2006 | US$ 10.934.400.000 | US$ 1.778.400.000 |
| 2005 | US$ 9.650.100.000 | US$ 1.449.600.000 |
| 2004 | US$ 8.737.000.000 | US$ 1.344.300.000 |
| 2003 | US$ 6.175.727.984 | US$ 1.126.115.940 |
| 2002 | US$ 5.791.006.299 | US$ 1.066.054.146 |
| 2001 | US$ 5.142.005.048 | US$ 926.211.081 |
| 2000 | US$ 4.742.000.000 | US$ 824.600.000 |
| 1999 | US$ 4.225.700.000 | US$ 790.700.000 |
| 1998 | US$ 4.255.700.000 | US$ 791.800.000 |
| 1997 | US$ 3.542.700.000 | US$ 650.500.000 |
| 1996 | US$ 2.880.300.000 | US$ 659.800.000 |
| 1995 | US$ 3.032.600.000 | US$ 695.000.000 |
| 1994 | US$ 2.546.600.000 | US$ 644.900.000 |
| 1993 | US$ 2.384.000.000 | US$ 586.100.000 |
| 1992 | US$ 2.327.800.000 | US$ 525.300.000 |
| 1991 | US$ 1.673.000.000 | US$ 356.400.000 |
| 1990 | US$ 1.428.000.000 | US$ 383.700.000 |
| 1989 | US$ 1.484.400.000 | US$ 376.900.000 |
| 1988 | US$ 1.413.200.000 | US$ 317.900.000 |
| 1987 | US$ 1.333.200.000 | US$ 259.500.000 |
| 1986 | US$ 875.700.000 | US$ 170.100.000 |
| 1985 | US$ 1.076.700.000 | US$ 180.000.000 |
| 1984 | US$ 1.182.200.000 | US$ 245.500.000 |
| 1983 | US$ 1.056.000.000 | US$ 257.800.000 |
| 1982 | US$ 1.284.300.000 | US$ 341.900.000 |
| 1981 | US$ 1.540.000.000 | US$ 484.300.000 |
| 1980 | US$ 1.472.600.000 | US$ 487.400.000 |
| 1979 | US$ 1.401.700.000 | US$ 383.100.000 |
| 1978 | US$ 1.283.800.000 | US$ 361.000.000 |
| 1977 | US$ 1.087.000.000 | US$ 339.500.000 |
Em 2025, as importações de bens da Guatemala foram de US$ 31,1 bilhões e as de serviços, de US$ 7,08 bilhões; os serviços representaram 18,5% do total, ante 23,8% em 1977.
A Guatemala na classificação mundial de importações, 2025
| Posição | País | Importações | Participação mundial | |
|---|---|---|---|---|
| 67 |
 Omã |
US$ 53,2 bi | 0,16% | |
| 68 |
 Uzbequistão |
US$ 52,0 bi | 0,15% | |
| 69 |
 RDC |
US$ 40,0 bi | 0,12% | |
| 70 |
 Guatemala |
US$ 38,2 bi | 0,11% | |
| 71 |
 Chipre |
US$ 37,9 bi | 0,11% | |
| 72 |
 Estônia |
US$ 36,4 bi | 0,11% | |
| 73 |
 Equador |
US$ 36,4 bi | 0,11% | vs Equador |
Importações de bens e serviços da Guatemala, % do PIB, 1960–2025
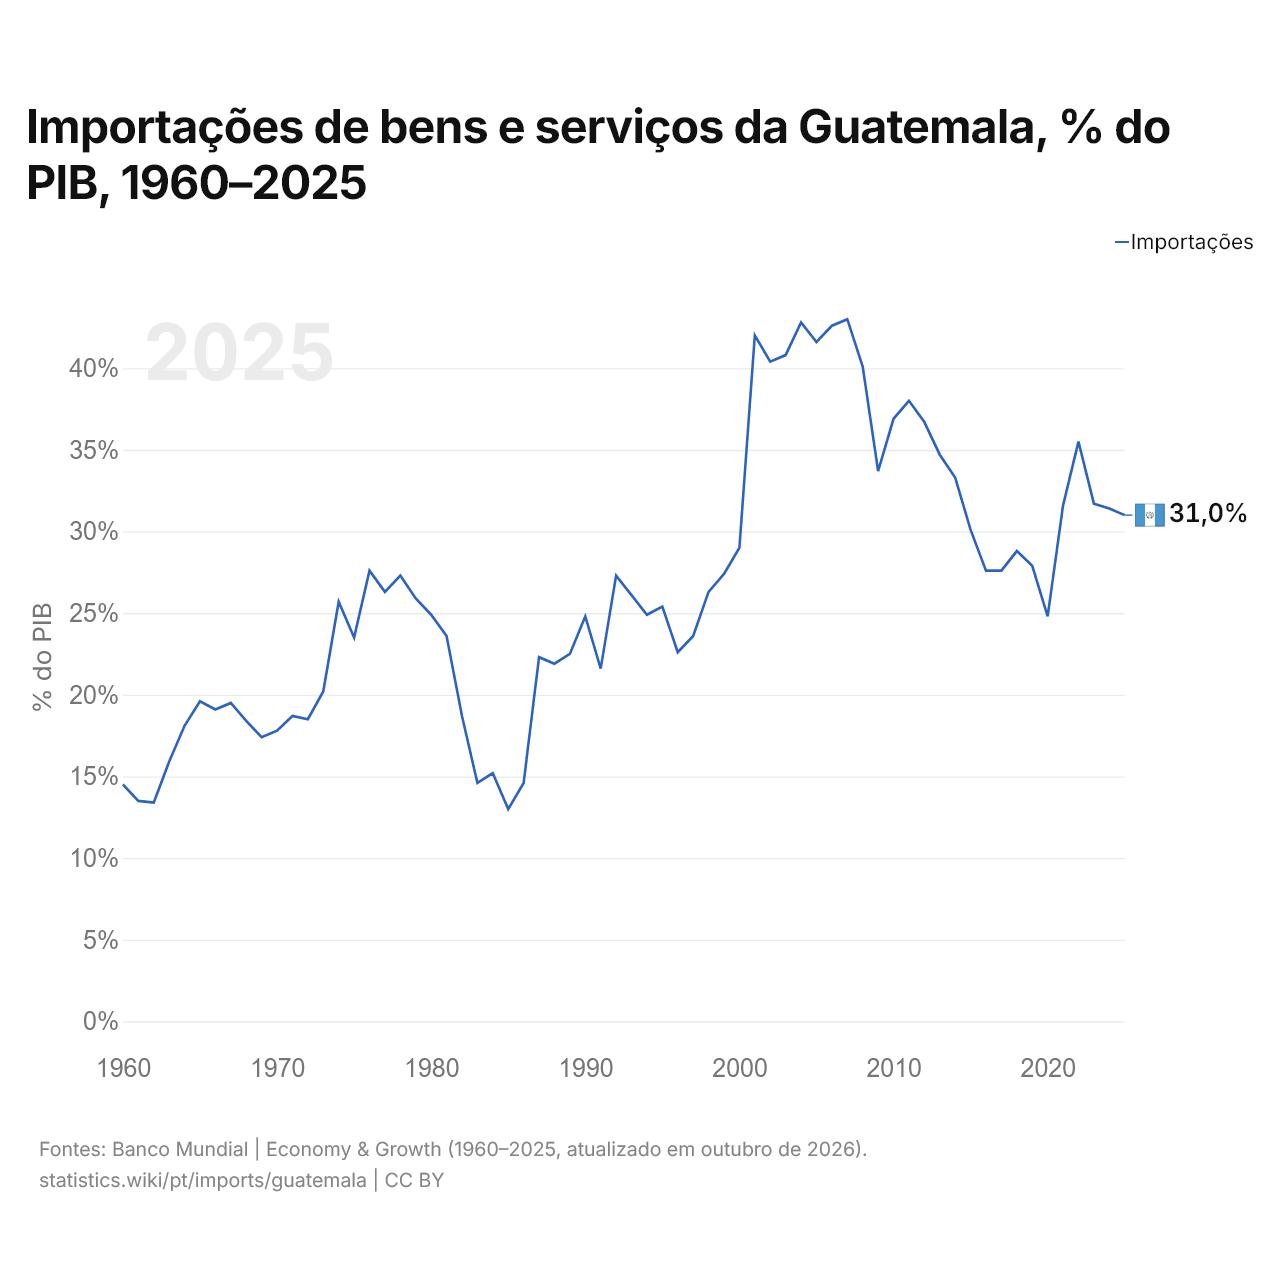
Em 2025, as importações de bens e serviços da Guatemala equivaleram a 31,0% do seu PIB, ante 14,5% em 1960. A maior participação foi de 43,0%, em 2007.
Comparar as importações da Guatemala com as de outros países
Fontes:
- Banco Mundial | Economy & Growth (1960–2025, atualizado em outubro de 2026)
- TradeMap (2001–2025, atualizado em outubro de 2026)
Creative Commons Atribuição (CC BY): você pode copiar, compartilhar, adaptar e reutilizar este conteúdo, inclusive para fins comerciais, desde que cite o statistics.wiki e indique as alterações que fizer. As fontes listadas acima podem ter suas próprias condições de licença.