
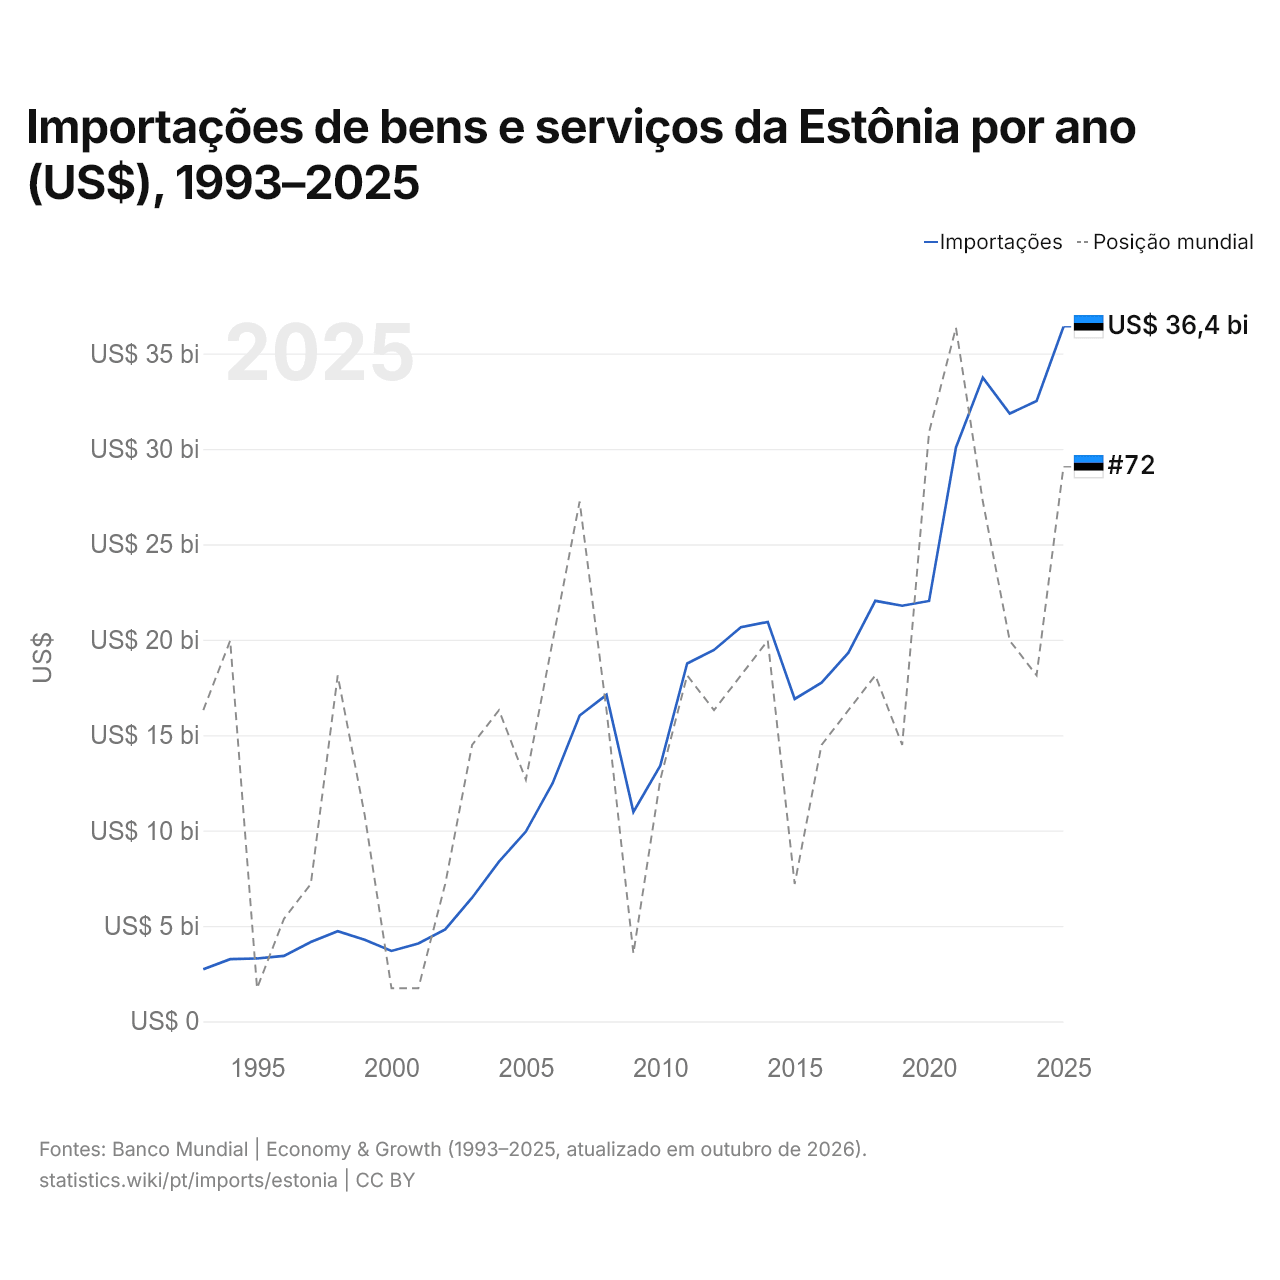
Importações de bens e serviços da Estônia por ano (US$), 1993–2025
| Ano | US$ | Posição mundial |
|---|---|---|
| Importações | Posição mundial | |
| 2025 | US$ 36.400.718.572 | #72 |
| 2024 | US$ 32.506.629.311 | #78 |
| 2023 | US$ 31.856.671.495 | #77 |
| 2022 | US$ 33.737.756.552 | #73 |
| 2021 | US$ 30.079.327.378 | #68 |
| 2020 | US$ 22.032.093.730 | #71 |
| 2019 | US$ 21.780.286.721 | #80 |
| 2018 | US$ 22.038.410.928 | #78 |
| 2017 | US$ 19.319.297.994 | #79 |
| 2016 | US$ 17.750.100.182 | #80 |
| 2015 | US$ 16.894.724.760 | #84 |
| 2014 | US$ 20.931.419.952 | #77 |
| 2013 | US$ 20.652.882.303 | #78 |
| 2012 | US$ 19.463.181.364 | #79 |
| 2011 | US$ 18.754.165.287 | #78 |
| 2010 | US$ 13.398.749.271 | #81 |
| 2009 | US$ 10.974.937.483 | #86 |
| 2008 | US$ 17.111.419.364 | #79 |
| 2007 | US$ 16.026.215.439 | #73 |
| 2006 | US$ 12.490.779.074 | #77 |
| 2005 | US$ 9.945.822.659 | #81 |
| 2004 | US$ 8.368.396.273 | #79 |
| 2003 | US$ 6.478.792.909 | #80 |
| 2002 | US$ 4.815.881.134 | #84 |
| 2001 | US$ 4.078.345.717 | #87 |
| 2000 | US$ 3.688.783.746 | #87 |
| 1999 | US$ 4.274.527.257 | #82 |
| 1998 | US$ 4.721.055.735 | #78 |
| 1997 | US$ 4.158.018.485 | #84 |
| 1996 | US$ 3.431.489.140 | #85 |
| 1995 | US$ 3.295.549.961 | #87 |
| 1994 | US$ 3.259.065.901 | #77 |
| 1993 | US$ 2.728.885.949 | #79 |
Em 2025, as importações de bens e serviços da Estônia foram de US$ 36,4 bilhões, ante US$ 2,73 bilhões em 1993. Foram as 72ª maiores do mundo; em 2024, eram as 78ª. Sua melhor posição foi o 68º lugar, ocupado pela última vez em 2021.
Em 2025, as importações de bens e serviços da Estônia foram as 32ª maiores de 41 países da Europa. Em 2025, as exportações da Estônia superaram as importações em US$ 454 milhões, um superávit comercial. O comércio da Estônia, exportações e importações somadas, equivaleu a 155,8% do seu PIB em 2025, o 16º lugar do mundo.
Importações de bens da Estônia por categoria, 2025
Importações de bens, 2025: US$ 25,7 bi
Em 2025, a maior categoria das importações de bens da Estônia foi máquinas, eletrônicos e veículos, com 36,4%, seguida de petróleo, gás, minérios e outras matérias-primas, com 12,9%.
Origens das importações de bens da Estônia: as 10 principais, 2025
| Posição | País | Importações de bens | Participação | |
|---|---|---|---|---|
| 1 |
 China |
US$ 2,81 bi | 10,9% | |
| 2 |
 Alemanha |
US$ 2,52 bi | 9,83% | |
| 3 |
 Finlândia |
US$ 1,84 bi | 7,18% | vs Finlândia |
| 4 |
 Letônia |
US$ 1,57 bi | 6,11% | vs Letônia |
| 5 |
 Lituânia |
US$ 1,45 bi | 5,64% | vs Lituânia |
| 6 |
 Polônia |
US$ 1,36 bi | 5,3% | |
| 7 |
 Países Baixos |
US$ 1,13 bi | 4,41% | |
| 8 |
 Suécia |
US$ 1,07 bi | 4,16% | |
| 9 |
 Itália |
US$ 871 mi | 3,39% | |
| 10 |
 Estados Unidos |
US$ 862 mi | 3,36% | |
| Outros parceiros e não especificados | US$ 10,2 bi | 39,7% |
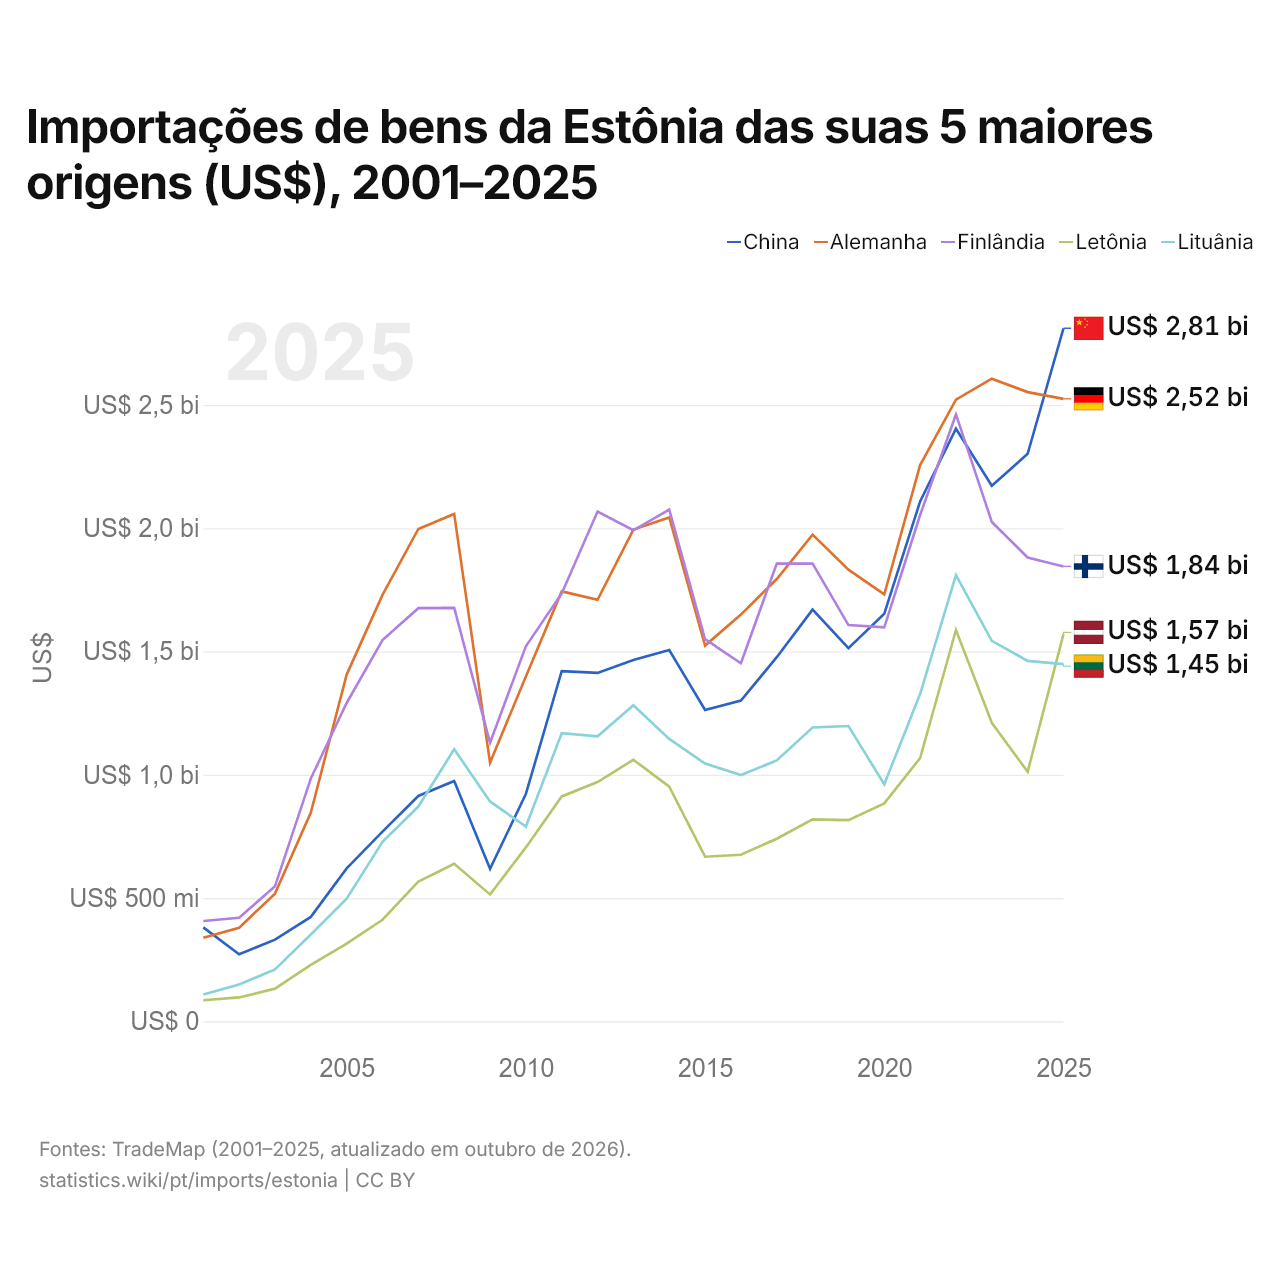
Importações de bens da Estônia das suas 5 maiores origens (US$), 2001–2025
| Ano | US$ | ||||
|---|---|---|---|---|---|
| China | Alemanha | Finlândia | Letônia | Lituânia | |
| 2025 | US$ 2.810.684.000 | US$ 2.524.542.000 | US$ 1.844.799.000 | US$ 1.569.898.000 | US$ 1.448.404.000 |
| 2024 | US$ 2.301.589.000 | US$ 2.551.847.000 | US$ 1.881.263.000 | US$ 1.012.227.000 | US$ 1.461.759.000 |
| 2023 | US$ 2.172.171.000 | US$ 2.606.469.000 | US$ 2.024.959.000 | US$ 1.210.447.000 | US$ 1.543.047.000 |
| 2022 | US$ 2.403.381.000 | US$ 2.521.266.000 | US$ 2.461.254.000 | US$ 1.587.141.000 | US$ 1.809.415.000 |
| 2021 | US$ 2.108.423.000 | US$ 2.255.873.000 | US$ 2.053.515.000 | US$ 1.067.917.000 | US$ 1.327.031.000 |
| 2020 | US$ 1.653.245.000 | US$ 1.731.912.000 | US$ 1.597.633.000 | US$ 883.568.000 | US$ 961.398.000 |
| 2019 | US$ 1.513.061.000 | US$ 1.831.759.000 | US$ 1.607.013.000 | US$ 816.056.000 | US$ 1.197.736.000 |
| 2018 | US$ 1.669.652.000 | US$ 1.973.829.000 | US$ 1.856.304.000 | US$ 818.806.000 | US$ 1.191.693.000 |
| 2017 | US$ 1.476.718.000 | US$ 1.793.649.000 | US$ 1.856.199.000 | US$ 740.741.000 | US$ 1.058.052.000 |
| 2016 | US$ 1.300.507.000 | US$ 1.649.460.000 | US$ 1.452.116.000 | US$ 675.343.000 | US$ 998.857.000 |
| 2015 | US$ 1.262.876.000 | US$ 1.523.647.000 | US$ 1.549.678.000 | US$ 667.547.000 | US$ 1.045.467.000 |
| 2014 | US$ 1.506.153.000 | US$ 2.043.328.000 | US$ 2.075.362.000 | US$ 951.936.000 | US$ 1.145.425.000 |
| 2013 | US$ 1.465.547.000 | US$ 1.994.487.000 | US$ 1.991.358.000 | US$ 1.060.731.000 | US$ 1.281.948.000 |
| 2012 | US$ 1.412.969.000 | US$ 1.709.687.000 | US$ 2.067.345.000 | US$ 970.446.000 | US$ 1.155.742.000 |
| 2011 | US$ 1.419.981.000 | US$ 1.743.711.000 | US$ 1.735.334.000 | US$ 912.141.000 | US$ 1.168.293.000 |
| 2010 | US$ 921.924.000 | US$ 1.398.339.000 | US$ 1.520.953.000 | US$ 705.298.000 | US$ 789.924.000 |
| 2009 | US$ 618.587.000 | US$ 1.048.702.000 | US$ 1.130.077.000 | US$ 514.454.000 | US$ 891.781.000 |
| 2008 | US$ 974.800.000 | US$ 2.057.558.000 | US$ 1.676.745.000 | US$ 638.829.000 | US$ 1.103.635.000 |
| 2007 | US$ 914.124.000 | US$ 1.996.758.000 | US$ 1.675.516.000 | US$ 566.900.000 | US$ 871.100.000 |
| 2006 | US$ 769.490.000 | US$ 1.729.165.000 | US$ 1.546.439.000 | US$ 411.865.000 | US$ 728.210.000 |
| 2005 | US$ 620.477.000 | US$ 1.406.250.000 | US$ 1.291.083.000 | US$ 314.868.000 | US$ 497.254.000 |
| 2004 | US$ 423.618.000 | US$ 846.722.000 | US$ 984.686.000 | US$ 228.945.000 | US$ 352.345.000 |
| 2003 | US$ 331.265.000 | US$ 517.940.000 | US$ 547.535.000 | US$ 132.585.000 | US$ 210.518.000 |
| 2002 | US$ 271.752.000 | US$ 379.781.000 | US$ 419.900.000 | US$ 96.952.000 | US$ 149.622.000 |
| 2001 | US$ 380.775.000 | US$ 339.079.000 | US$ 406.896.000 | US$ 85.490.000 | US$ 108.491.000 |
Em 2025, as importações de bens foram de US$ 2,81 bilhões da China, US$ 2,52 bilhões da Alemanha, US$ 1,84 bilhão da Finlândia, US$ 1,57 bilhão da Letônia e US$ 1,45 bilhão da Lituânia. A mudança mais recente nessa ordem foi em 2025, quando as importações da Estônia vindas da China superaram as vindas da Alemanha.
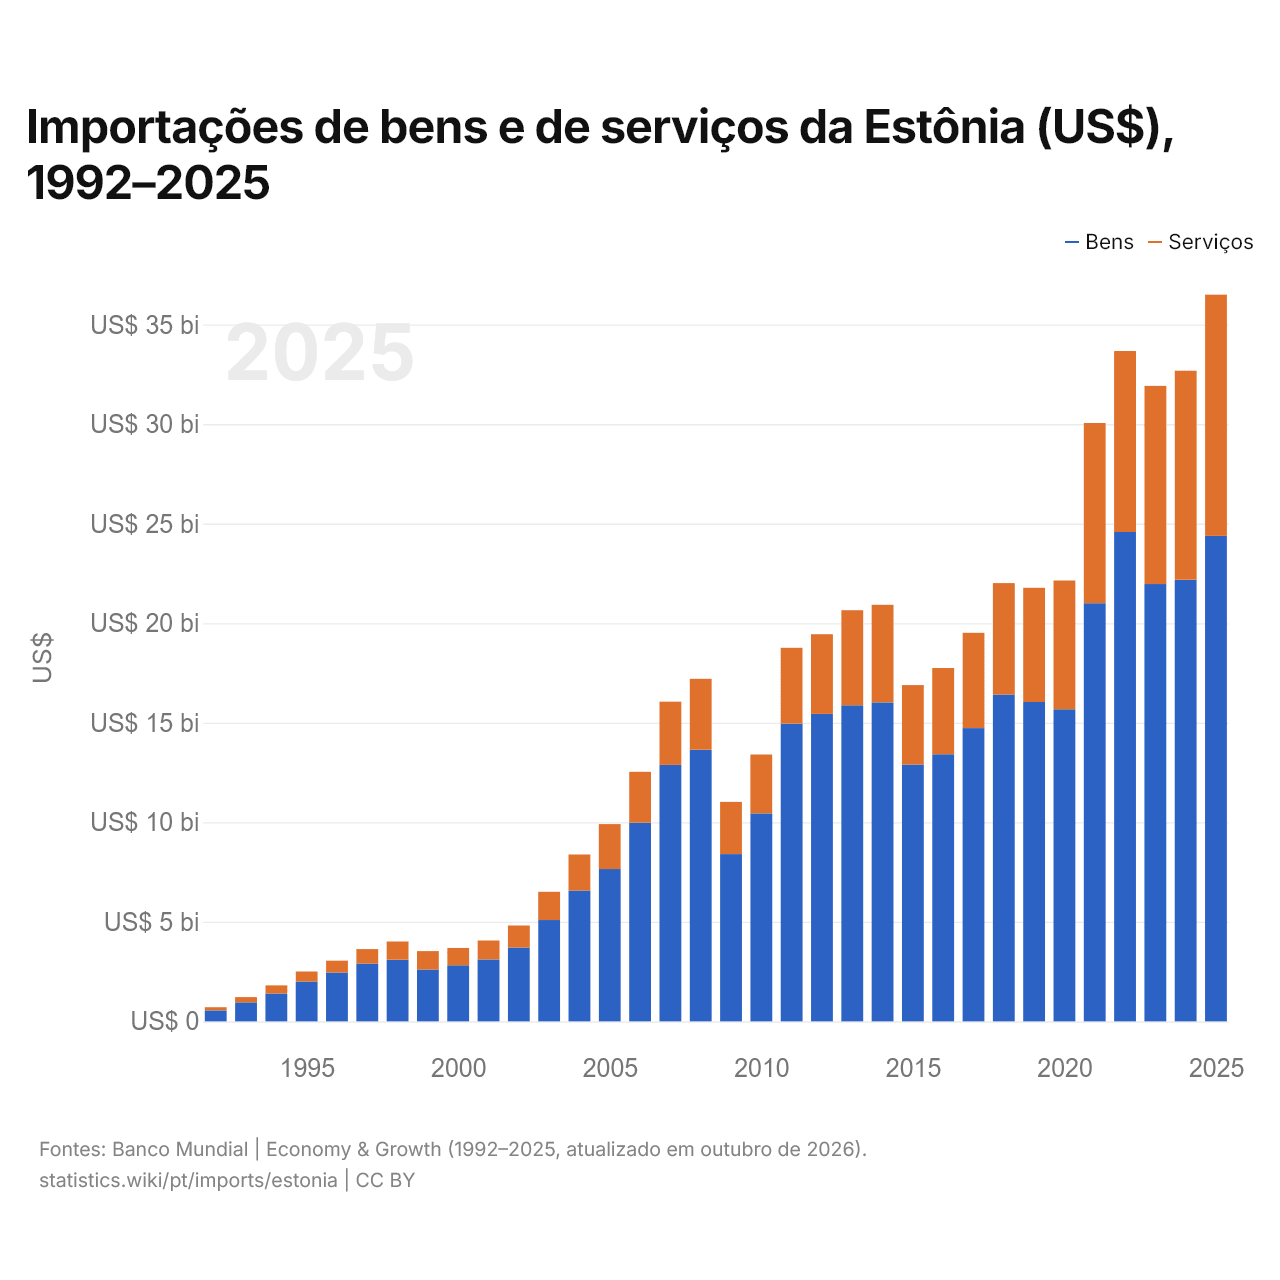
Importações de bens e de serviços da Estônia (US$), 1992–2025
| Ano | US$ | |
|---|---|---|
| Bens | Serviços | |
| 2025 | US$ 24.385.793.792 | US$ 12.114.822.304 |
| 2024 | US$ 22.184.015.010 | US$ 10.495.512.009 |
| 2023 | US$ 21.966.207.613 | US$ 9.951.598.736 |
| 2022 | US$ 24.578.611.334 | US$ 9.091.264.861 |
| 2021 | US$ 21.003.585.180 | US$ 9.050.592.392 |
| 2020 | US$ 15.675.031.132 | US$ 6.465.298.463 |
| 2019 | US$ 16.042.696.347 | US$ 5.733.100.913 |
| 2018 | US$ 16.418.566.675 | US$ 5.596.107.315 |
| 2017 | US$ 14.728.799.345 | US$ 4.788.211.393 |
| 2016 | US$ 13.417.751.703 | US$ 4.328.535.396 |
| 2015 | US$ 12.899.630.441 | US$ 3.991.576.149 |
| 2014 | US$ 16.020.981.564 | US$ 4.902.720.343 |
| 2013 | US$ 15.878.075.638 | US$ 4.771.669.057 |
| 2012 | US$ 15.440.881.362 | US$ 4.005.323.578 |
| 2011 | US$ 14.952.616.112 | US$ 3.810.154.939 |
| 2010 | US$ 10.445.382.754 | US$ 2.955.409.277 |
| 2009 | US$ 8.399.233.175 | US$ 2.624.157.940 |
| 2008 | US$ 13.638.751.918 | US$ 3.564.533.860 |
| 2007 | US$ 12.879.297.768 | US$ 3.180.703.193 |
| 2006 | US$ 9.979.557.772 | US$ 2.554.563.544 |
| 2005 | US$ 7.650.476.883 | US$ 2.255.808.464 |
| 2004 | US$ 6.569.623.887 | US$ 1.810.809.618 |
| 2003 | US$ 5.087.993.011 | US$ 1.418.261.842 |
| 2002 | US$ 3.705.254.239 | US$ 1.108.885.338 |
| 2001 | US$ 3.109.762.438 | US$ 952.661.582 |
| 2000 | US$ 2.815.986.132 | US$ 869.299.635 |
| 1999 | US$ 2.605.215.741 | US$ 923.345.217 |
| 1998 | US$ 3.093.474.607 | US$ 917.117.951 |
| 1997 | US$ 2.901.131.957 | US$ 729.002.881 |
| 1996 | US$ 2.452.598.681 | US$ 594.813.211 |
| 1995 | US$ 1.995.828.518 | US$ 504.430.252 |
| 1994 | US$ 1.391.660.498 | US$ 415.348.072 |
| 1993 | US$ 954.689.512 | US$ 261.266.204 |
| 1992 | US$ 551.088.717 | US$ 160.384.977 |
Em 2025, as importações de bens da Estônia foram de US$ 24,4 bilhões e as de serviços, de US$ 12,1 bilhões; os serviços representaram 33,2% do total, ante 22,5% em 1992.
A Estônia na classificação mundial de importações, 2025







Importações de bens e serviços da Estônia, % do PIB, 1993–2025
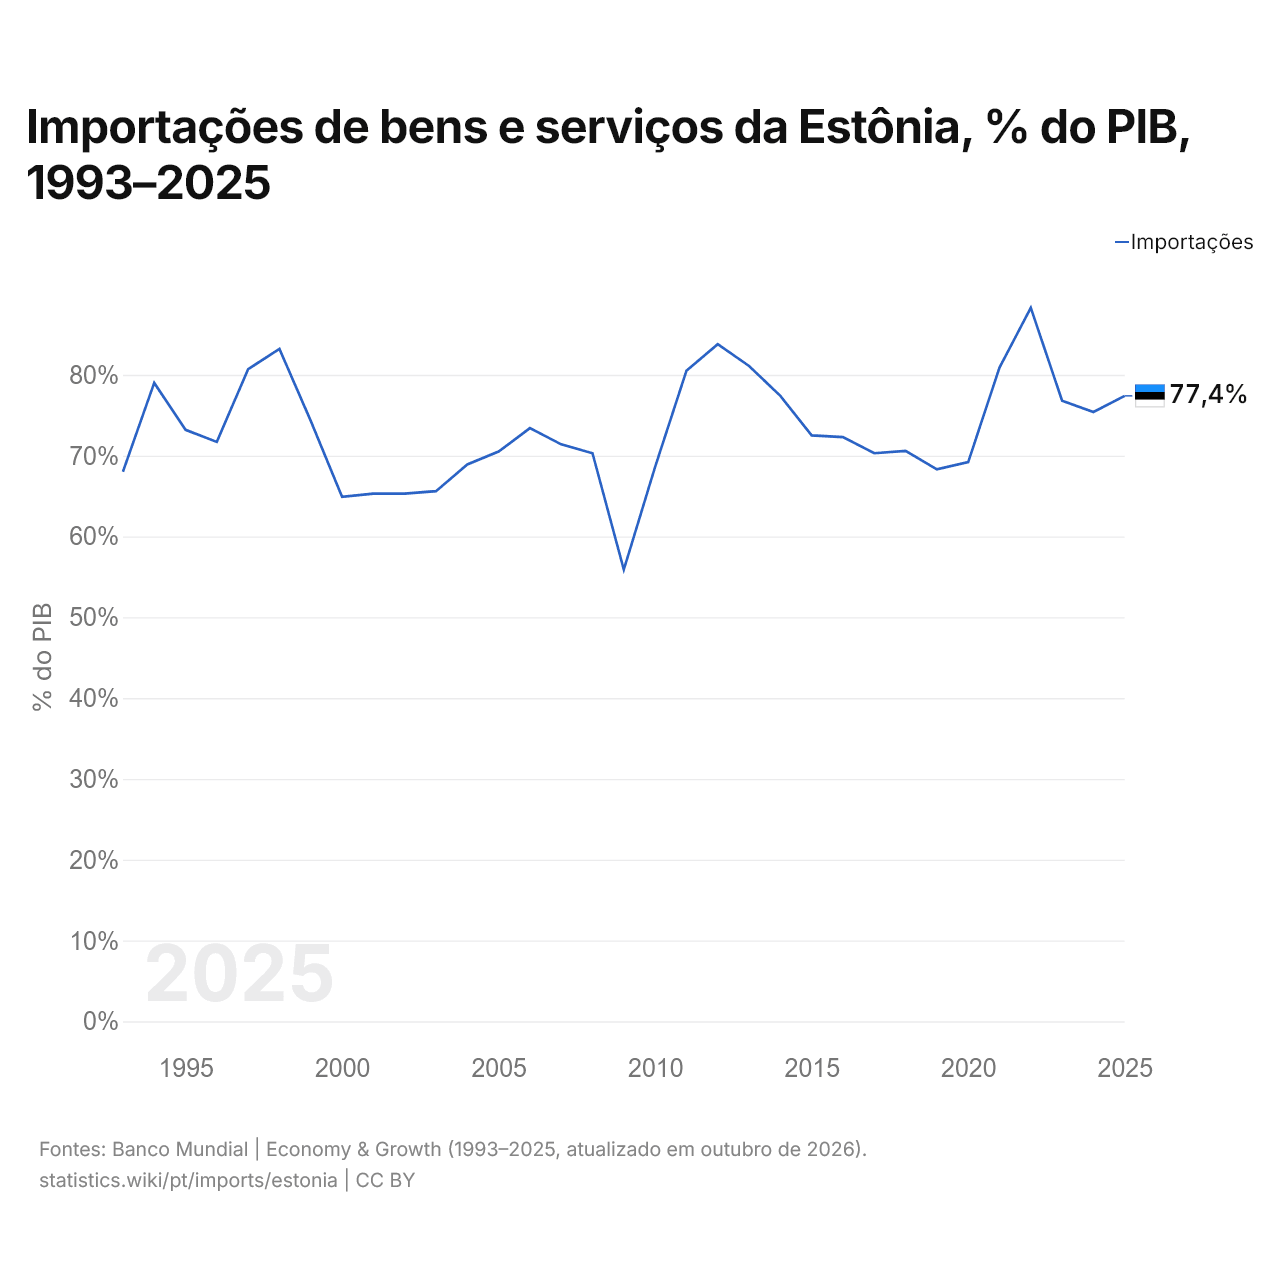
Em 2025, as importações de bens e serviços da Estônia equivaleram a 77,4% do seu PIB, ante 68,0% em 1993. A maior participação foi de 88,3%, em 2022.
Comparar as importações da Estônia com as de outros países
Fontes:
- TradeMap (2001–2025, atualizado em outubro de 2026)
- Banco Mundial | Economy & Growth (1992–2025, atualizado em outubro de 2026)
Creative Commons Atribuição (CC BY): você pode copiar, compartilhar, adaptar e reutilizar este conteúdo, inclusive para fins comerciais, desde que cite o statistics.wiki e indique as alterações que fizer. As fontes listadas acima podem ter suas próprias condições de licença.