
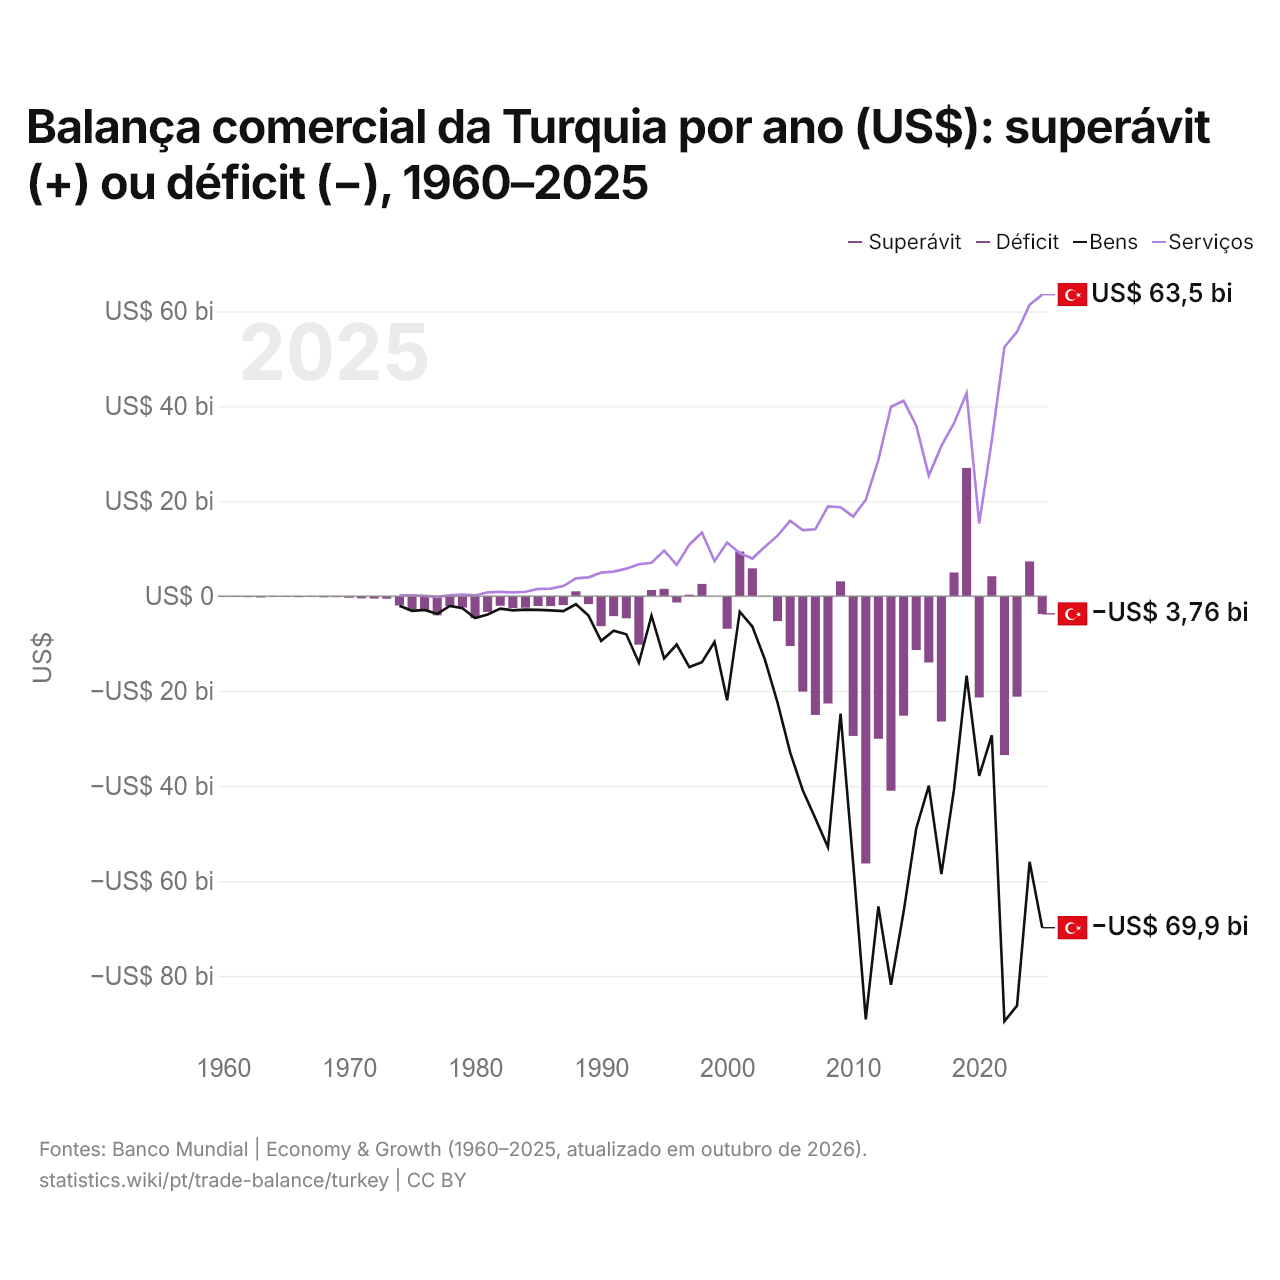
Balança comercial da Turquia por ano (US$): superávit (+) ou déficit (−), 1960–2025
| Ano | US$ | ||
|---|---|---|---|
| Bens e serviços | Bens | Serviços | |
| 2025 | US$ −3.755.785.561 | US$ −69.858.000.000 | US$ 63.503.000.000 |
| 2024 | US$ 7.307.197.101 | US$ −55.987.000.000 | US$ 61.369.000.000 |
| 2023 | US$ −21.181.731.331 | US$ −86.279.000.000 | US$ 55.674.000.000 |
| 2022 | US$ −33.486.302.440 | US$ −89.585.000.000 | US$ 52.488.000.000 |
| 2021 | US$ 4.185.993.617 | US$ −29.319.000.000 | US$ 32.838.000.000 |
| 2020 | US$ −21.347.440.639 | US$ −37.876.000.000 | US$ 15.297.000.000 |
| 2019 | US$ 27.009.801.864 | US$ −16.782.000.000 | US$ 42.767.000.000 |
| 2018 | US$ 4.971.181.455 | US$ −40.731.000.000 | US$ 36.416.000.000 |
| 2017 | US$ −26.405.711.552 | US$ −58.575.000.000 | US$ 31.631.000.000 |
| 2016 | US$ −13.983.412.331 | US$ −39.923.000.000 | US$ 25.380.000.000 |
| 2015 | US$ −11.366.572.353 | US$ −49.007.000.000 | US$ 35.941.000.000 |
| 2014 | US$ −25.180.591.325 | US$ −66.574.000.000 | US$ 41.147.000.000 |
| 2013 | US$ −41.005.981.821 | US$ −81.885.000.000 | US$ 39.899.000.000 |
| 2012 | US$ −30.066.833.315 | US$ −65.367.000.000 | US$ 28.708.000.000 |
| 2011 | US$ −56.314.976.402 | US$ −89.160.000.000 | US$ 20.288.000.000 |
| 2010 | US$ −29.450.676.482 | US$ −56.325.000.000 | US$ 16.745.000.000 |
| 2009 | US$ 3.116.333.325 | US$ −24.762.000.000 | US$ 18.726.000.000 |
| 2008 | US$ −22.630.468.482 | US$ −52.917.000.000 | US$ 18.908.000.000 |
| 2007 | US$ −25.026.651.296 | US$ −46.831.000.000 | US$ 14.092.000.000 |
| 2006 | US$ −20.116.184.782 | US$ −40.894.000.000 | US$ 13.904.000.000 |
| 2005 | US$ −10.528.378.745 | US$ −32.936.000.000 | US$ 15.872.000.000 |
| 2004 | US$ −5.268.792.743 | US$ −22.438.000.000 | US$ 12.732.000.000 |
| 2003 | US$ 66.756.414 | US$ −13.411.000.000 | US$ 10.394.000.000 |
| 2002 | US$ 5.845.228.386 | US$ −6.404.000.000 | US$ 7.899.000.000 |
| 2001 | US$ 9.400.731.322 | US$ −3.282.000.000 | US$ 9.055.000.000 |
| 2000 | US$ −6.890.257.814 | US$ −21.959.000.000 | US$ 11.277.000.000 |
| 1999 | US$ −12.805.916 | US$ −9.667.000.000 | US$ 7.398.000.000 |
| 1998 | US$ 2.572.582.501 | US$ −13.927.000.000 | US$ 13.407.000.000 |
| 1997 | US$ 308.677.444 | US$ −14.963.000.000 | US$ 10.827.000.000 |
| 1996 | US$ −1.330.688.533 | US$ −10.189.000.000 | US$ 6.582.000.000 |
| 1995 | US$ 1.537.801.287 | US$ −13.114.000.000 | US$ 9.582.000.000 |
| 1994 | US$ 1.278.297.139 | US$ −4.134.000.000 | US$ 7.019.000.000 |
| 1993 | US$ −10.228.639.053 | US$ −14.044.000.000 | US$ 6.704.000.000 |
| 1992 | US$ −4.698.195.576 | US$ −8.051.000.000 | US$ 5.782.000.000 |
| 1991 | US$ −4.219.534.995 | US$ −7.280.000.000 | US$ 5.154.000.000 |
| 1990 | US$ −6.346.799.540 | US$ −9.427.000.000 | US$ 4.945.000.000 |
| 1989 | US$ −1.690.292.177 | US$ −4.111.000.000 | US$ 3.949.000.000 |
| 1988 | US$ 1.000.632.911 | US$ −1.707.000.000 | US$ 3.727.000.000 |
| 1987 | US$ −1.897.782.964 | US$ −3.162.000.000 | US$ 2.118.000.000 |
| 1986 | US$ −2.110.962.963 | US$ −2.997.000.000 | US$ 1.569.000.000 |
| 1985 | US$ −2.087.931.034 | US$ −2.907.000.000 | US$ 1.531.000.000 |
| 1984 | US$ −2.437.602.180 | US$ −2.848.000.000 | US$ 924.000.000 |
| 1983 | US$ −2.524.444.444 | US$ −2.990.000.000 | US$ 773.000.000 |
| 1982 | US$ −2.029.447.853 | US$ −2.628.000.000 | US$ 887.000.000 |
| 1981 | US$ −3.322.522.523 | US$ −3.864.000.000 | US$ 796.000.000 |
| 1980 | US$ −4.656.578.947 | US$ −4.603.000.000 | US$ 142.000.000 |
| 1979 | US$ −2.387.096.774 | US$ −2.554.000.000 | US$ 307.000.000 |
| 1978 | US$ −2.070.833.333 | US$ −2.081.000.000 | US$ 157.000.000 |
| 1977 | US$ −4.044.444.444 | US$ −3.753.000.000 | US$ −153.000.000 |
| 1976 | US$ −2.987.500.000 | US$ −2.912.000.000 | US$ 63.000.000 |
| 1975 | US$ −3.135.714.286 | US$ −3.101.000.000 | US$ 180.000.000 |
| 1974 | US$ −1.964.285.714 | US$ −2.057.000.000 | US$ 183.000.000 |
| 1973 | US$ −535.714.286 | - | - |
| 1972 | US$ −521.428.571 | - | - |
| 1971 | US$ −473.333.333 | - | - |
| 1970 | US$ −345.454.545 | - | - |
| 1969 | US$ −222.222.222 | - | - |
| 1968 | US$ −244.444.444 | - | - |
| 1967 | US$ −133.333.333 | - | - |
| 1966 | US$ −222.222.222 | - | - |
| 1965 | US$ −100.000.000 | - | - |
| 1964 | US$ −111.111.111 | - | - |
| 1963 | US$ −288.888.889 | - | - |
| 1962 | US$ −211.111.111 | - | - |
| 1961 | US$ −133.333.333 | - | - |
| 1960 | US$ −122.222.222 | - | - |
Em 2025, a balança comercial da Turquia teve um déficit de US$ 3,76 bilhões, ante um déficit de US$ 122 milhões em 1960. O maior déficit foi de US$ 56,3 bilhões, em 2011, e o maior superávit, de US$ 27 bilhões, em 2019.
Em 2025, o saldo comercial da Turquia foi o 28º mais alto de 44 países da Ásia, onde os saldos iam de um déficit de US$ 68,9 bilhões na Índia a um superávit de US$ 816 bilhões na China. De 2016 a 2025, os saldos comerciais da Turquia somaram um déficit de US$ 76,7 bilhões, ante um déficit de US$ 258 bilhões de 2006 a 2015. Em 2025, a conta corrente da Turquia teve um déficit de 1,9% do PIB.
Comércio de bens da Turquia com os seus 10 maiores parceiros comerciais, segundo a Turquia, 2025
| País | Exportações para | Importações de | Saldo | |
|---|---|---|---|---|
 China |
US$ 3,28 bi | US$ 49,6 bi | -US$ 46,3 bi | vs China |
 Alemanha |
US$ 22,2 bi | US$ 30,1 bi | -US$ 7,94 bi | vs Alemanha |
 Rússia |
US$ 6,72 bi | US$ 42,4 bi | -US$ 35,7 bi | vs Rússia |
 Estados Unidos |
US$ 16,3 bi | US$ 18,1 bi | -US$ 1,75 bi | vs EUA |
 Itália |
US$ 13,2 bi | US$ 15,7 bi | -US$ 2,52 bi | vs Itália |
 França |
US$ 11,2 bi | US$ 12,9 bi | -US$ 1,66 bi | vs França |
 Reino Unido |
US$ 16,8 bi | US$ 7,26 bi | +US$ 9,52 bi | vs RU |
 Espanha |
US$ 10,4 bi | US$ 10,2 bi | +US$ 241 mi | vs Espanha |
 EAU |
US$ 9,28 bi | US$ 9,67 bi | -US$ 393 mi | |
 Suíça |
US$ 2,24 bi | US$ 15,8 bi | -US$ 13,5 bi |
Balança comercial da Turquia: superávit (+) ou déficit (−)
Comparar a balança comercial da Turquia com a de outros países
Fontes:
- TradeMap (2025, atualizado em outubro de 2026)
- Banco Mundial | Economy & Growth (1960–2025, atualizado em outubro de 2026)
Creative Commons Atribuição (CC BY): você pode copiar, compartilhar, adaptar e reutilizar este conteúdo, inclusive para fins comerciais, desde que cite o statistics.wiki e indique as alterações que fizer. As fontes listadas acima podem ter suas próprias condições de licença.