
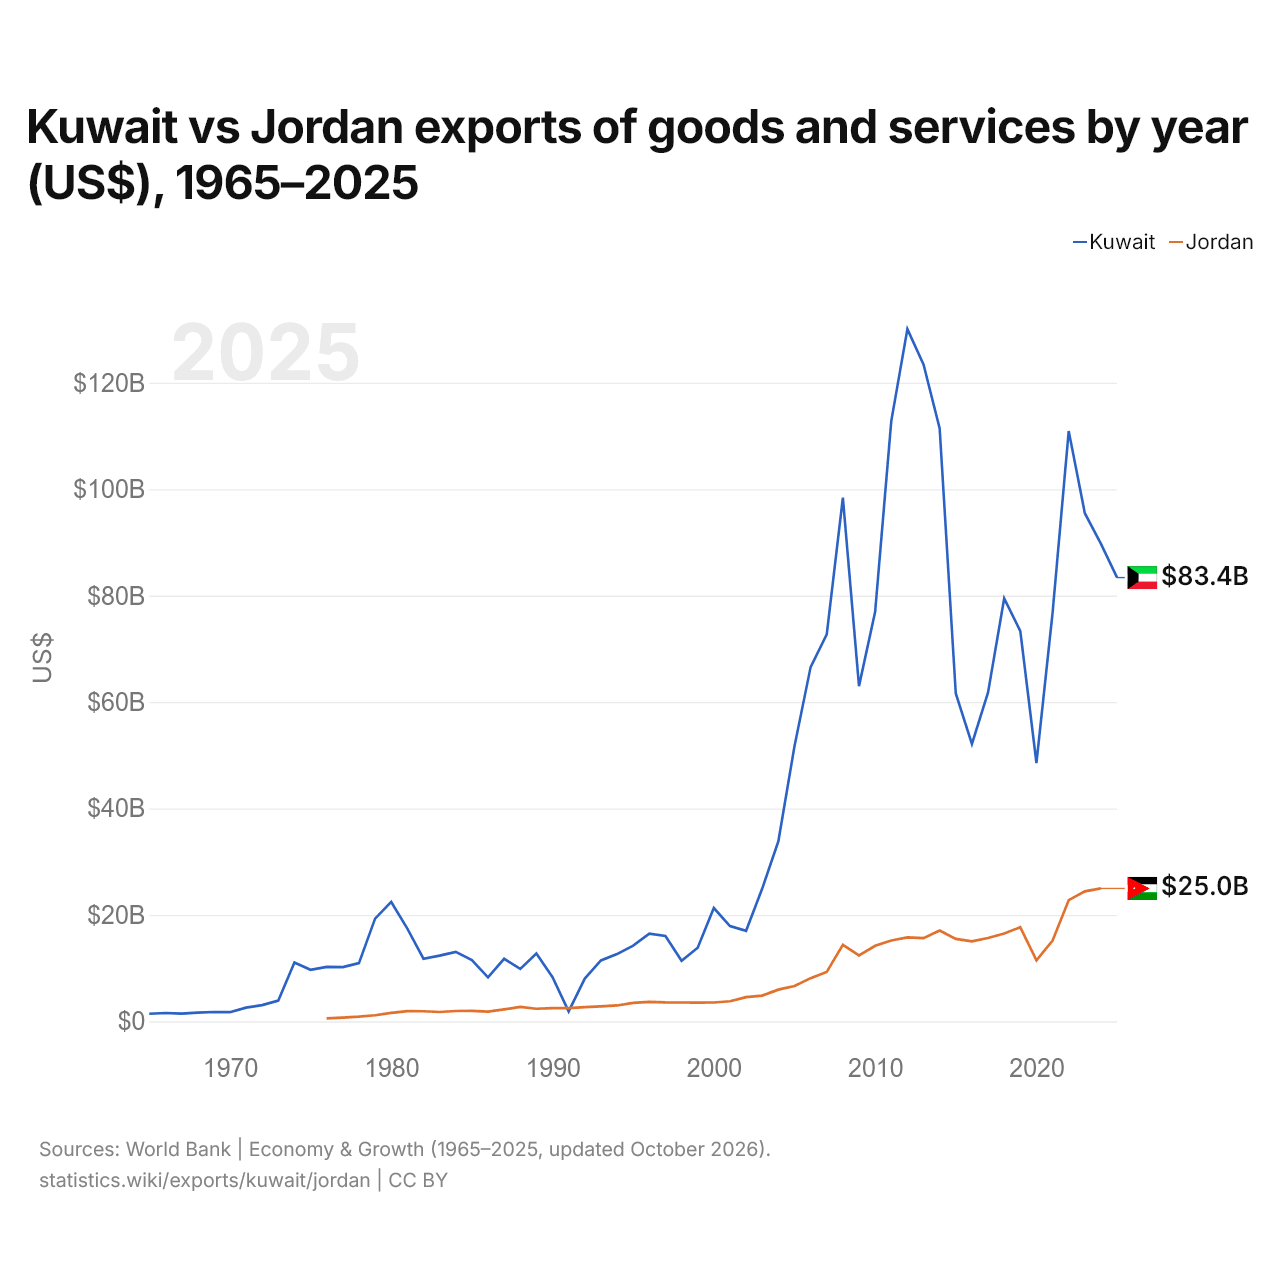
Kuwait vs Jordânia: exportações de bens e serviços por ano (US$), 1965–2025
| Ano | US$ | |
|---|---|---|
 Kuwait |
 Jordânia |
|
| 2025 | US$ 83.383.478.240 | - |
| 2024 | US$ 89.713.098.852 | US$ 24.978.496.636 |
| 2023 | US$ 95.475.365.008 | US$ 24.423.185.916 |
| 2022 | US$ 110.924.408.163 | US$ 22.764.746.582 |
| 2021 | US$ 76.735.412.391 | US$ 15.189.797.101 |
| 2020 | US$ 48.541.470.057 | US$ 11.455.665.446 |
| 2019 | US$ 73.327.382.736 | US$ 17.673.414.514 |
| 2018 | US$ 79.460.231.954 | US$ 16.507.256.537 |
| 2017 | US$ 61.787.573.760 | US$ 15.649.848.031 |
| 2016 | US$ 52.112.899.115 | US$ 15.026.750.914 |
| 2015 | US$ 61.607.350.790 | US$ 15.492.666.646 |
| 2014 | US$ 111.424.545.362 | US$ 17.079.021.029 |
| 2013 | US$ 123.417.300.389 | US$ 15.640.033.827 |
| 2012 | US$ 130.069.015.775 | US$ 15.763.073.043 |
| 2011 | US$ 112.783.943.706 | US$ 15.194.244.256 |
| 2010 | US$ 76.952.063.278 | US$ 14.194.440.554 |
| 2009 | US$ 62.981.044.877 | US$ 12.378.849.705 |
| 2008 | US$ 98.390.048.656 | US$ 14.377.860.853 |
| 2007 | US$ 72.695.222.614 | US$ 9.279.830.748 |
| 2006 | US$ 66.566.497.574 | US$ 8.111.847.673 |
| 2005 | US$ 51.691.780.822 | US$ 6.634.978.843 |
| 2004 | US$ 33.831.014.591 | US$ 5.955.712.271 |
| 2003 | US$ 24.938.593.077 | US$ 4.829.901.269 |
| 2002 | US$ 17.014.681.785 | US$ 4.544.146.685 |
| 2001 | US$ 17.901.278.849 | US$ 3.781.896.040 |
| 2000 | US$ 21.300.594.617 | US$ 3.538.928.068 |
| 1999 | US$ 13.836.374.686 | US$ 3.529.798.449 |
| 1998 | US$ 11.379.595.480 | US$ 3.544.310.014 |
| 1997 | US$ 16.040.929.754 | US$ 3.568.401.834 |
| 1996 | US$ 16.465.770.902 | US$ 3.663.187.588 |
| 1995 | US$ 14.233.635.340 | US$ 3.479.594.749 |
| 1994 | US$ 12.636.363.300 | US$ 2.984.831.258 |
| 1993 | US$ 11.437.086.424 | US$ 2.821.988.710 |
| 1992 | US$ 8.036.810.157 | US$ 2.667.772.992 |
| 1991 | US$ 1.860.913.431 | US$ 2.493.295.303 |
| 1990 | US$ 8.281.249.653 | US$ 2.489.182.055 |
| 1989 | US$ 12.740.870.178 | US$ 2.366.092.562 |
| 1988 | US$ 9.841.270.621 | US$ 2.727.282.443 |
| 1987 | US$ 11.752.547.342 | US$ 2.234.244.030 |
| 1986 | US$ 8.269.241.040 | US$ 1.811.890.298 |
| 1985 | US$ 11.511.107.454 | US$ 1.980.361.102 |
| 1984 | US$ 13.044.565.328 | US$ 1.941.138.985 |
| 1983 | US$ 12.340.939.422 | US$ 1.761.600.093 |
| 1982 | US$ 11.760.578.443 | US$ 1.901.319.746 |
| 1981 | US$ 17.414.854.099 | US$ 1.913.247.164 |
| 1980 | US$ 22.438.280.484 | US$ 1.579.256.524 |
| 1979 | US$ 19.296.875.158 | US$ 1.136.072.293 |
| 1978 | US$ 10.936.074.138 | US$ 870.674.847 |
| 1977 | US$ 10.182.645.883 | US$ 694.573.097 |
| 1976 | US$ 10.234.380.804 | US$ 553.341.587 |
| 1975 | US$ 9.674.794.850 | - |
| 1974 | US$ 11.050.618.964 | - |
| 1973 | US$ 3.890.792.118 | - |
| 1972 | US$ 3.053.056.857 | - |
| 1971 | US$ 2.574.572.168 | - |
| 1970 | US$ 1.718.919.312 | - |
| 1969 | US$ 1.758.399.297 | - |
| 1968 | US$ 1.643.599.343 | - |
| 1967 | US$ 1.453.199.419 | - |
| 1966 | US$ 1.570.799.372 | - |
| 1965 | US$ 1.419.599.432 | - |
As exportações de bens e serviços do Kuwait foram de US$ 89,7 bilhões (2024) e as da Jordânia, de US$ 25 bilhões (2024): as do Kuwait foram 3,6 vezes maiores. Em 1976, as exportações do Kuwait foram 18 vezes maiores: US$ 10,2 bilhões do Kuwait e US$ 553 milhões da Jordânia.
As exportações de bens e serviços do Kuwait têm sido maiores que as da Jordânia todos os anos desde 1992.
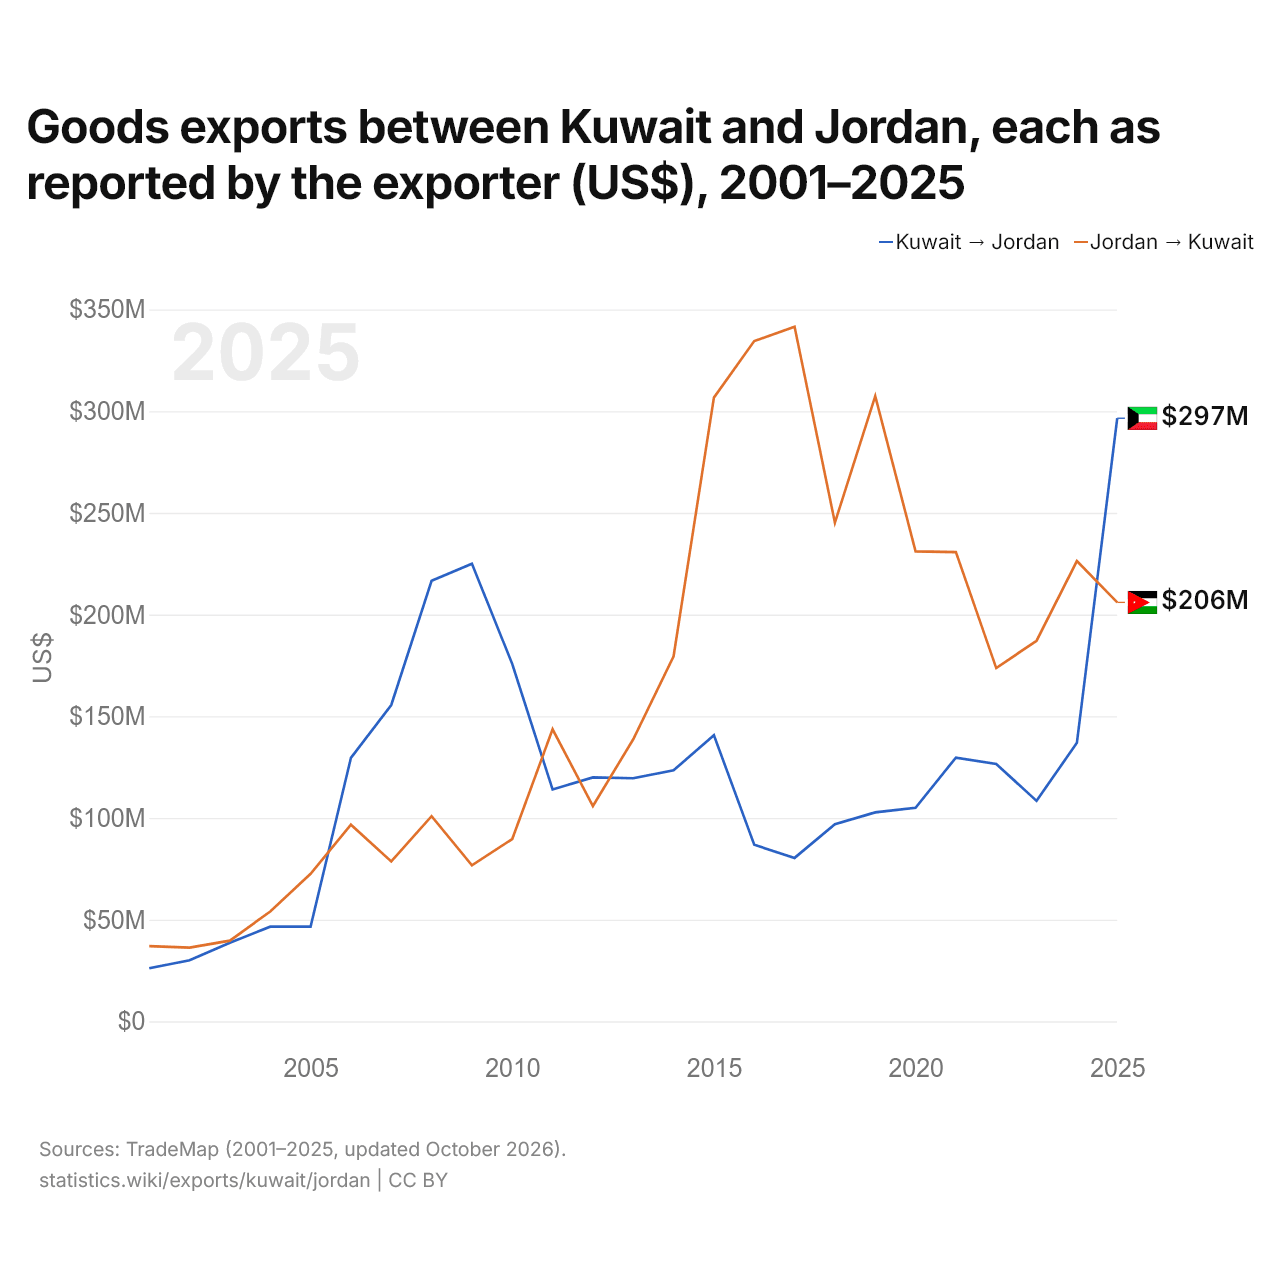
Exportações de bens entre o Kuwait e a Jordânia, segundo o exportador (US$), 2001–2025
| Ano | US$ | |
|---|---|---|
| Kuwait → Jordânia | Jordânia → Kuwait | |
| 2025 | US$ 296.508.000 | US$ 205.977.000 |
| 2024 | US$ 136.951.000 | US$ 226.291.000 |
| 2023 | US$ 108.381.000 | US$ 187.119.000 |
| 2022 | US$ 126.532.000 | US$ 173.675.000 |
| 2021 | US$ 129.687.000 | US$ 230.718.000 |
| 2020 | US$ 104.991.000 | US$ 231.075.000 |
| 2019 | US$ 102.746.000 | US$ 307.378.000 |
| 2018 | US$ 96.913.000 | US$ 245.160.000 |
| 2017 | US$ 80.352.000 | US$ 341.501.000 |
| 2016 | US$ 86.816.000 | US$ 334.467.000 |
| 2015 | US$ 140.676.000 | US$ 306.669.000 |
| 2014 | US$ 123.417.000 | US$ 179.502.000 |
| 2013 | US$ 119.522.000 | US$ 138.679.000 |
| 2012 | US$ 119.937.000 | US$ 105.852.000 |
| 2011 | US$ 113.997.000 | US$ 143.605.000 |
| 2010 | US$ 175.695.000 | US$ 89.614.000 |
| 2009 | US$ 224.993.000 | US$ 76.687.000 |
| 2008 | US$ 216.611.000 | US$ 100.885.000 |
| 2007 | US$ 155.529.000 | US$ 78.579.000 |
| 2006 | US$ 129.511.000 | US$ 96.684.000 |
| 2005 | US$ 46.538.000 | US$ 72.517.000 |
| 2004 | US$ 46.538.000 | US$ 54.011.000 |
| 2003 | US$ 38.657.000 | US$ 39.687.000 |
| 2002 | US$ 30.029.000 | US$ 36.249.000 |
| 2001 | US$ 26.091.000 | US$ 36.945.000 |
Em 2025, as exportações de bens do Kuwait para a Jordânia, segundo o Kuwait, foram de US$ 297 milhões, e as da Jordânia para o Kuwait, segundo a Jordânia, de US$ 206 milhões: 44% mais do Kuwait. Em 2001, foram de US$ 26,1 milhões do Kuwait e de US$ 36,9 milhões da Jordânia.
Kuwait vs Jordânia: dados de exportações
|
Kuwait
|
Jordânia
|
|
|---|---|---|
| Exportações | US$ 83,4 bi (2025) | US$ 25,0 bi (2024) |
| Posição mundial | 52/176 | 86/176 |
| Participação mundial | 0,24% | 0,08% |
| % do PIB | 53,0% | 42,6% |
| Maior categoria de bens | Petróleo, gás, minérios e outras matérias-primas (87,9%, 2025) | Petróleo, gás, minérios e outras matérias-primas (23,4%, 2025) |
| Principal destino dos bens | Emirados Árabes Unidos (2,73%, 2025) | Estados Unidos (18,5%, 2025) |
Comparar as exportações de 2 países quaisquer
Fontes:
- Banco Mundial | Economy & Growth (1965–2025, atualizado em outubro de 2026)
- TradeMap (2001–2025, atualizado em outubro de 2026)
Creative Commons Atribuição (CC BY): você pode copiar, compartilhar, adaptar e reutilizar este conteúdo, inclusive para fins comerciais, desde que cite o statistics.wiki e indique as alterações que fizer. As fontes listadas acima podem ter suas próprias condições de licença.