
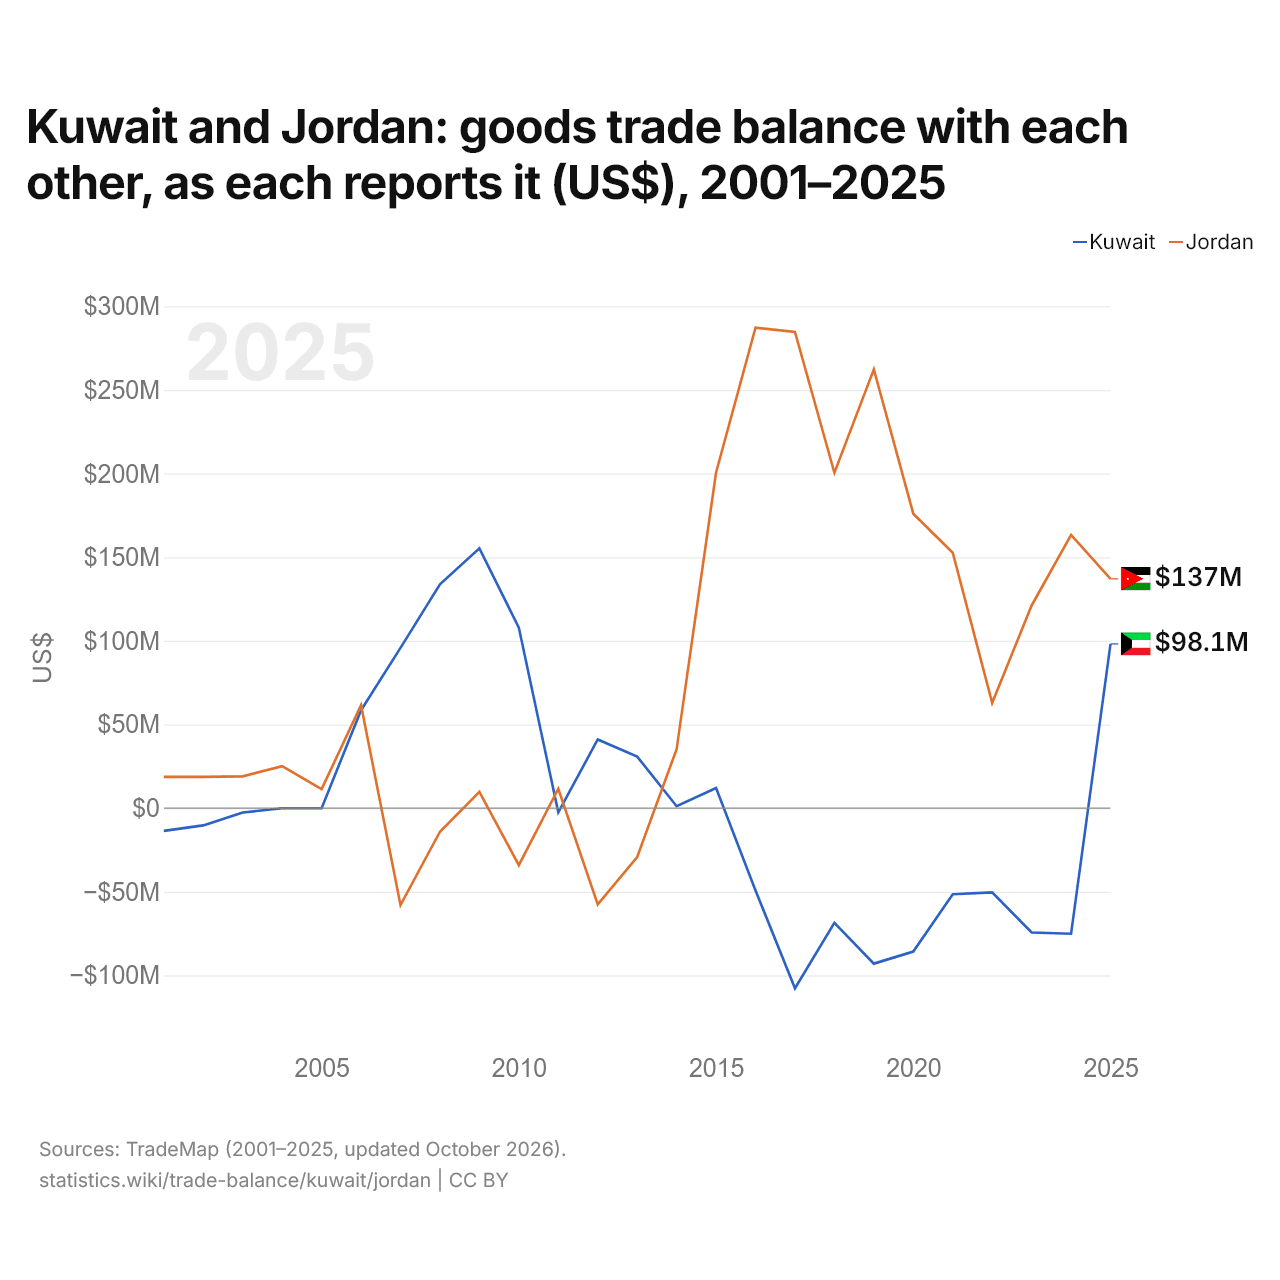
O Kuwait e a Jordânia: saldo do comércio de bens entre os dois, segundo cada um (US$), 2001–2025
| Ano | US$ | |
|---|---|---|
| Kuwait | Jordânia | |
| 2025 | US$ 98.136.000 | US$ 137.050.000 |
| 2024 | US$ −75.124.000 | US$ 163.285.000 |
| 2023 | US$ −74.410.000 | US$ 121.113.000 |
| 2022 | US$ −50.419.000 | US$ 62.892.000 |
| 2021 | US$ −51.506.000 | US$ 152.671.000 |
| 2020 | US$ −85.830.000 | US$ 175.990.000 |
| 2019 | US$ −93.018.000 | US$ 262.319.000 |
| 2018 | US$ −68.651.000 | US$ 200.453.000 |
| 2017 | US$ −107.757.000 | US$ 284.625.000 |
| 2016 | US$ −49.277.000 | US$ 287.177.000 |
| 2015 | US$ 11.985.000 | US$ 200.629.000 |
| 2014 | US$ 1.085.000 | US$ 35.235.000 |
| 2013 | US$ 30.799.000 | US$ −29.278.000 |
| 2012 | US$ 41.005.000 | US$ −57.624.000 |
| 2011 | US$ −2.592.000 | US$ 11.560.000 |
| 2010 | US$ 107.816.000 | US$ −34.162.000 |
| 2009 | US$ 155.275.000 | US$ 9.694.000 |
| 2008 | US$ 133.767.000 | US$ −14.144.000 |
| 2007 | US$ 95.768.000 | US$ −58.009.000 |
| 2006 | US$ 58.526.000 | US$ 61.493.000 |
| 2005 | US$ −113.000 | US$ 11.321.000 |
| 2004 | US$ −113.000 | US$ 25.064.000 |
| 2003 | US$ −2.639.000 | US$ 18.939.000 |
| 2002 | US$ −10.393.000 | US$ 18.605.000 |
| 2001 | US$ −13.608.000 | US$ 18.606.000 |
Em 2025, segundo o Kuwait, o seu comércio de bens com a Jordânia teve um superávit de US$ 98,1 milhões; segundo a Jordânia, o seu comércio de bens com o Kuwait teve um superávit de US$ 137 milhões. Em 2001, os valores foram um déficit de US$ 13,6 milhões do Kuwait e um superávit de US$ 18,6 milhões da Jordânia.
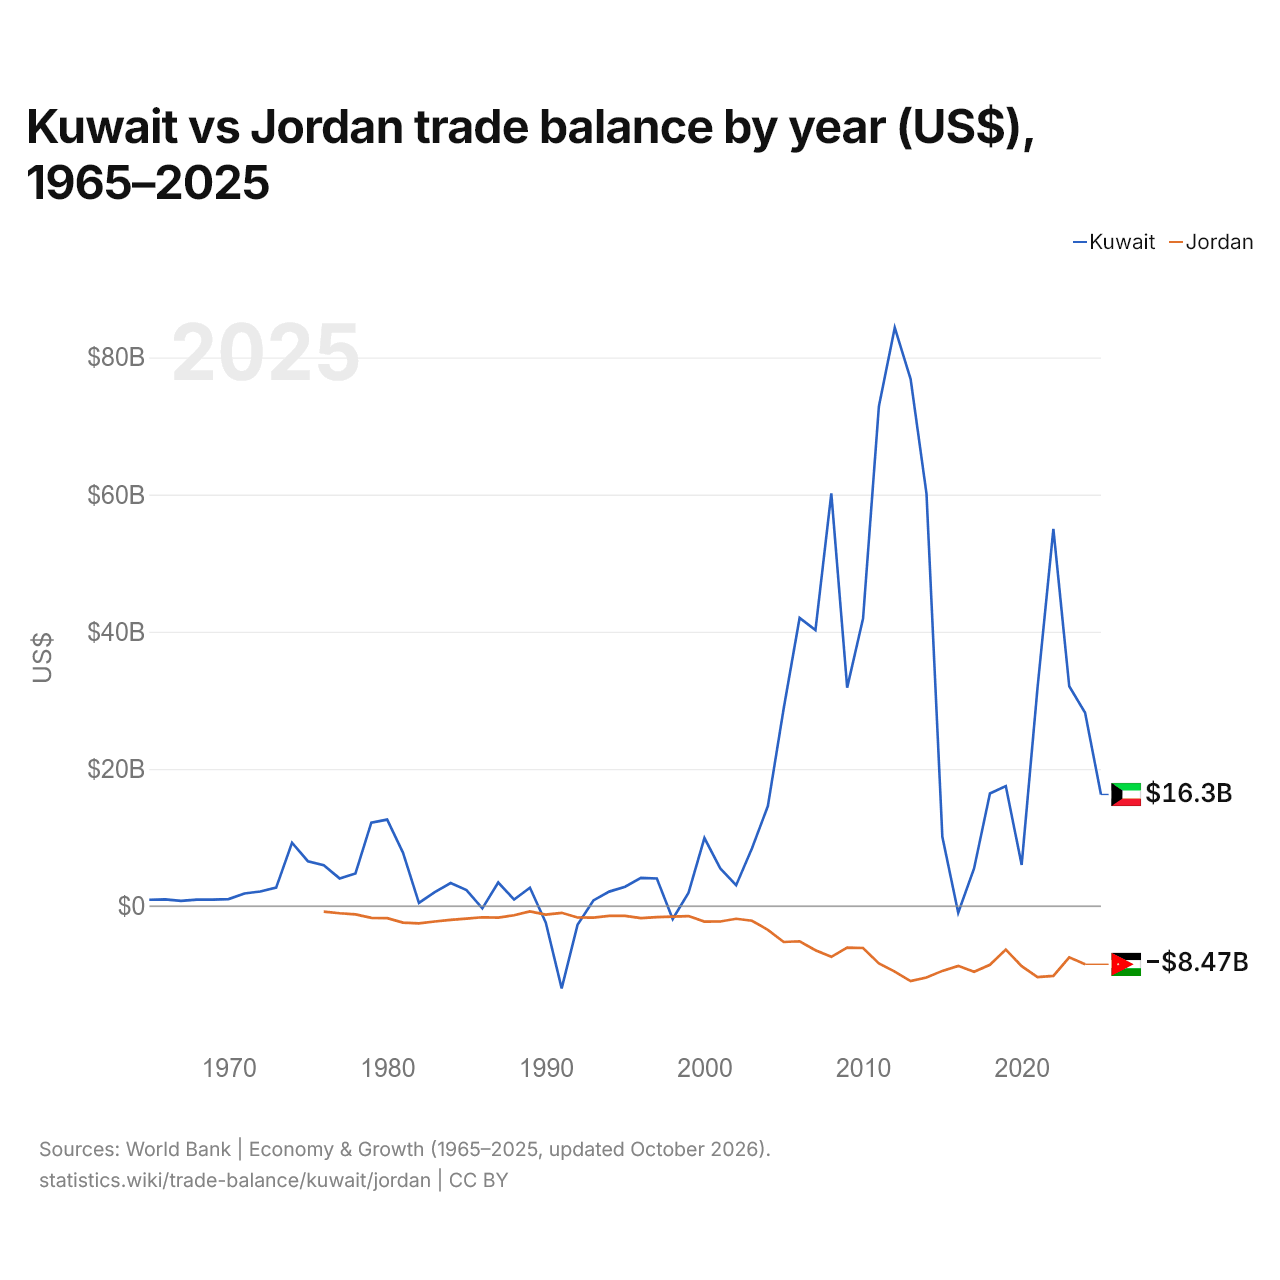
Kuwait vs Jordânia: balança comercial por ano (US$), 1965–2025
| Ano | US$ | |
|---|---|---|
 Kuwait |
 Jordânia |
|
| 2025 | US$ 16.276.674.173 | - |
| 2024 | US$ 28.191.893.469 | US$ −8.473.484.746 |
| 2023 | US$ 32.049.742.012 | US$ −7.472.336.302 |
| 2022 | US$ 55.010.938.776 | US$ −10.179.201.144 |
| 2021 | US$ 31.822.717.583 | US$ −10.351.533.439 |
| 2020 | US$ 6.011.762.286 | US$ −8.752.372.484 |
| 2019 | US$ 17.509.576.399 | US$ −6.331.967.800 |
| 2018 | US$ 16.411.973.268 | US$ −8.556.328.572 |
| 2017 | US$ 5.494.402.505 | US$ −9.560.139.509 |
| 2016 | US$ −977.113.032 | US$ −8.707.247.886 |
| 2015 | US$ 10.118.771.356 | US$ −9.440.747.024 |
| 2014 | US$ 60.138.150.594 | US$ −10.405.761.157 |
| 2013 | US$ 76.836.954.889 | US$ −10.930.374.066 |
| 2012 | US$ 84.329.989.712 | US$ −9.551.261.526 |
| 2011 | US$ 72.889.603.919 | US$ −8.355.432.945 |
| 2010 | US$ 41.918.027.124 | US$ −6.109.535.546 |
| 2009 | US$ 31.850.165.922 | US$ −6.042.038.828 |
| 2008 | US$ 60.183.463.032 | US$ −7.390.727.763 |
| 2007 | US$ 40.233.767.513 | US$ −6.420.592.384 |
| 2006 | US$ 42.022.772.386 | US$ −5.119.181.946 |
| 2005 | US$ 28.852.739.726 | US$ −5.224.400.564 |
| 2004 | US$ 14.584.323.040 | US$ −3.451.198.872 |
| 2003 | US$ 8.439.257.480 | US$ −2.137.235.543 |
| 2002 | US$ 3.053.495.397 | US$ −1.839.492.243 |
| 2001 | US$ 5.500.811.916 | US$ −2.245.469.920 |
| 2000 | US$ 9.929.845.608 | US$ −2.256.840.621 |
| 1999 | US$ 1.957.853.588 | US$ −1.454.664.880 |
| 1998 | US$ −1.876.911.365 | US$ −1.539.901.410 |
| 1997 | US$ 4.025.066.837 | US$ −1.611.613.399 |
| 1996 | US$ 4.124.792.508 | US$ −1.752.750.212 |
| 1995 | US$ 2.824.612.663 | US$ −1.422.231.735 |
| 1994 | US$ 2.117.844.781 | US$ −1.410.131.673 |
| 1993 | US$ 834.437.748 | US$ −1.671.546.985 |
| 1992 | US$ −2.730.061.350 | US$ −1.655.884.369 |
| 1991 | US$ −11.979.850.423 | US$ −976.697.324 |
| 1990 | US$ −2.420.138.889 | US$ −1.238.790.319 |
| 1989 | US$ 2.682.288.387 | US$ −774.484.141 |
| 1988 | US$ 956.889.069 | US$ −1.332.916.546 |
| 1987 | US$ 3.448.610.687 | US$ −1.664.898.850 |
| 1986 | US$ −326.914.778 | US$ −1.615.585.514 |
| 1985 | US$ 2.344.116.933 | US$ −1.827.557.808 |
| 1984 | US$ 3.357.405.206 | US$ −2.010.065.936 |
| 1983 | US$ 2.040.607.321 | US$ −2.240.834.639 |
| 1982 | US$ 461.948.310 | US$ −2.512.113.750 |
| 1981 | US$ 7.773.015.406 | US$ −2.406.841.932 |
| 1980 | US$ 12.615.751.562 | US$ −1.756.146.681 |
| 1979 | US$ 12.165.027.898 | US$ −1.701.444.730 |
| 1978 | US$ 4.755.447.132 | US$ −1.206.707.566 |
| 1977 | US$ 4.040.954.265 | US$ −1.043.833.728 |
| 1976 | US$ 5.959.224.931 | US$ −809.680.014 |
| 1975 | US$ 6.547.553.718 | - |
| 1974 | US$ 9.250.181.647 | - |
| 1973 | US$ 2.691.757.819 | - |
| 1972 | US$ 2.133.461.418 | - |
| 1971 | US$ 1.850.333.335 | - |
| 1970 | US$ 1.025.919.590 | - |
| 1969 | US$ 957.599.617 | - |
| 1968 | US$ 949.199.620 | - |
| 1967 | US$ 758.799.696 | - |
| 1966 | US$ 988.399.605 | - |
| 1965 | US$ 935.199.626 | - |
A balança comercial do Kuwait teve um superávit de US$ 28,2 bilhões (2024) e a da Jordânia, um déficit de US$ 8,47 bilhões (2024). Em 1976, a balança comercial do Kuwait teve um superávit de US$ 5,96 bilhões e a da Jordânia, um déficit de US$ 810 milhões.
Desde 1976, a balança comercial do Kuwait tem tido superávit em 43 dos 49 anos, e a da Jordânia, em nenhum. As balanças comerciais do Kuwait e da Jordânia tiveram déficit ao mesmo tempo em 6 desses anos, o mais recente em 2016.
Kuwait vs Jordânia: dados da balança comercial
|
Kuwait
|
Jordânia
|
|
|---|---|---|
| Bens e serviços, US$ | +US$ 16,3 bi (2025) | -US$ 8,47 bi (2024) |
| % do PIB | +10,4% (2025) | −14,5% (2024) |
| Anos com superávit desde 2000 | 25 de 26 | 0 de 25 |
| Saldo de bens entre os dois, dados próprios | +US$ 98,1 mi (2025) | +US$ 137 mi (2025) |
| Maior superávit em bens com | Iraque (+US$ 737 mi, 2025) | Iraque (+US$ 2,42 bi, 2025) |
| Maior déficit em bens com | China (-US$ 7,99 bi, 2025) | China (-US$ 5,50 bi, 2025) |
Comparar a balança comercial de 2 países quaisquer
Fontes:
- Banco Mundial | Economy & Growth (1965–2025, atualizado em outubro de 2026)
- TradeMap (2001–2025, atualizado em outubro de 2026)
Creative Commons Atribuição (CC BY): você pode copiar, compartilhar, adaptar e reutilizar este conteúdo, inclusive para fins comerciais, desde que cite o statistics.wiki e indique as alterações que fizer. As fontes listadas acima podem ter suas próprias condições de licença.