
Portugal vs Maurício: exportações de bens e serviços por ano (US$), 1970–2025
| Ano | US$ | |
|---|---|---|
 Portugal |
 Maurício |
|
| 2025 | US$ 151.336.322.847 | US$ 10.508.453.742 |
| 2024 | US$ 143.716.598.546 | US$ 10.025.062.117 |
| 2023 | US$ 137.846.682.522 | US$ 9.715.616.542 |
| 2022 | US$ 127.117.787.017 | US$ 8.671.207.275 |
| 2021 | US$ 106.387.190.475 | US$ 7.062.411.511 |
| 2020 | US$ 85.546.804.978 | US$ 6.403.116.604 |
| 2019 | US$ 104.818.126.822 | US$ 8.837.804.270 |
| 2018 | US$ 105.740.319.070 | US$ 8.760.255.080 |
| 2017 | US$ 94.844.484.378 | US$ 8.385.997.463 |
| 2016 | US$ 83.254.740.237 | US$ 7.788.248.023 |
| 2015 | US$ 80.984.130.312 | US$ 7.852.564.560 |
| 2014 | US$ 92.457.300.369 | US$ 8.575.510.562 |
| 2013 | US$ 89.682.537.232 | US$ 7.987.464.268 |
| 2012 | US$ 81.685.225.652 | US$ 6.245.529.946 |
| 2011 | US$ 84.455.064.293 | US$ 6.011.123.130 |
| 2010 | US$ 71.598.934.533 | US$ 5.100.895.259 |
| 2009 | US$ 66.778.989.702 | US$ 4.325.246.090 |
| 2008 | US$ 82.346.807.429 | US$ 5.077.630.569 |
| 2007 | US$ 75.020.812.081 | US$ 4.534.954.334 |
| 2006 | US$ 63.373.039.604 | US$ 4.094.163.167 |
| 2005 | US$ 53.424.570.458 | US$ 3.829.946.692 |
| 2004 | US$ 52.396.449.477 | US$ 3.508.043.725 |
| 2003 | US$ 45.217.764.525 | US$ 3.257.695.158 |
| 2002 | US$ 36.493.691.735 | US$ 2.982.651.358 |
| 2001 | US$ 33.364.915.450 | US$ 3.136.674.473 |
| 2000 | US$ 33.452.144.656 | US$ 2.849.019.401 |
| 1999 | US$ 33.756.675.285 | US$ 2.771.402.053 |
| 1998 | US$ 33.876.548.308 | US$ 2.738.797.090 |
| 1997 | US$ 31.774.839.337 | US$ 2.573.649.428 |
| 1996 | US$ 32.556.406.291 | US$ 2.811.723.402 |
| 1995 | US$ 31.620.944.673 | US$ 2.369.967.141 |
| 1994 | US$ 25.055.310.386 | US$ 2.018.277.243 |
| 1993 | US$ 22.422.442.339 | US$ 1.900.665.939 |
| 1992 | US$ 26.315.596.971 | US$ 1.912.137.909 |
| 1991 | US$ 23.689.342.306 | US$ 1.779.993.085 |
| 1990 | US$ 22.960.185.628 | US$ 1.723.622.086 |
| 1989 | US$ 17.854.164.757 | US$ 1.400.873.863 |
| 1988 | US$ 15.572.504.178 | US$ 1.381.558.262 |
| 1987 | US$ 13.172.520.279 | US$ 1.214.376.183 |
| 1986 | US$ 10.071.952.821 | US$ 885.094.544 |
| 1985 | US$ 7.929.289.328 | US$ 576.008.405 |
| 1984 | US$ 7.358.490.824 | US$ 506.437.055 |
| 1983 | US$ 6.687.714.441 | US$ 508.533.939 |
| 1982 | US$ 6.314.253.280 | US$ 508.528.358 |
| 1981 | US$ 6.501.188.925 | US$ 510.935.885 |
| 1980 | US$ 7.058.033.640 | US$ 579.103.449 |
| 1979 | US$ 5.643.155.738 | US$ 516.795.210 |
| 1978 | US$ 3.702.002.737 | US$ 438.890.038 |
| 1977 | US$ 3.094.730.225 | US$ 401.979.142 |
| 1976 | US$ 2.777.320.955 | US$ 357.403.437 |
| 1975 | US$ 3.092.305.882 | - |
| 1974 | US$ 3.686.495.659 | - |
| 1973 | US$ 3.160.024.530 | - |
| 1972 | US$ 2.398.176.427 | - |
| 1971 | US$ 1.808.141.343 | - |
| 1970 | US$ 1.549.504.881 | - |
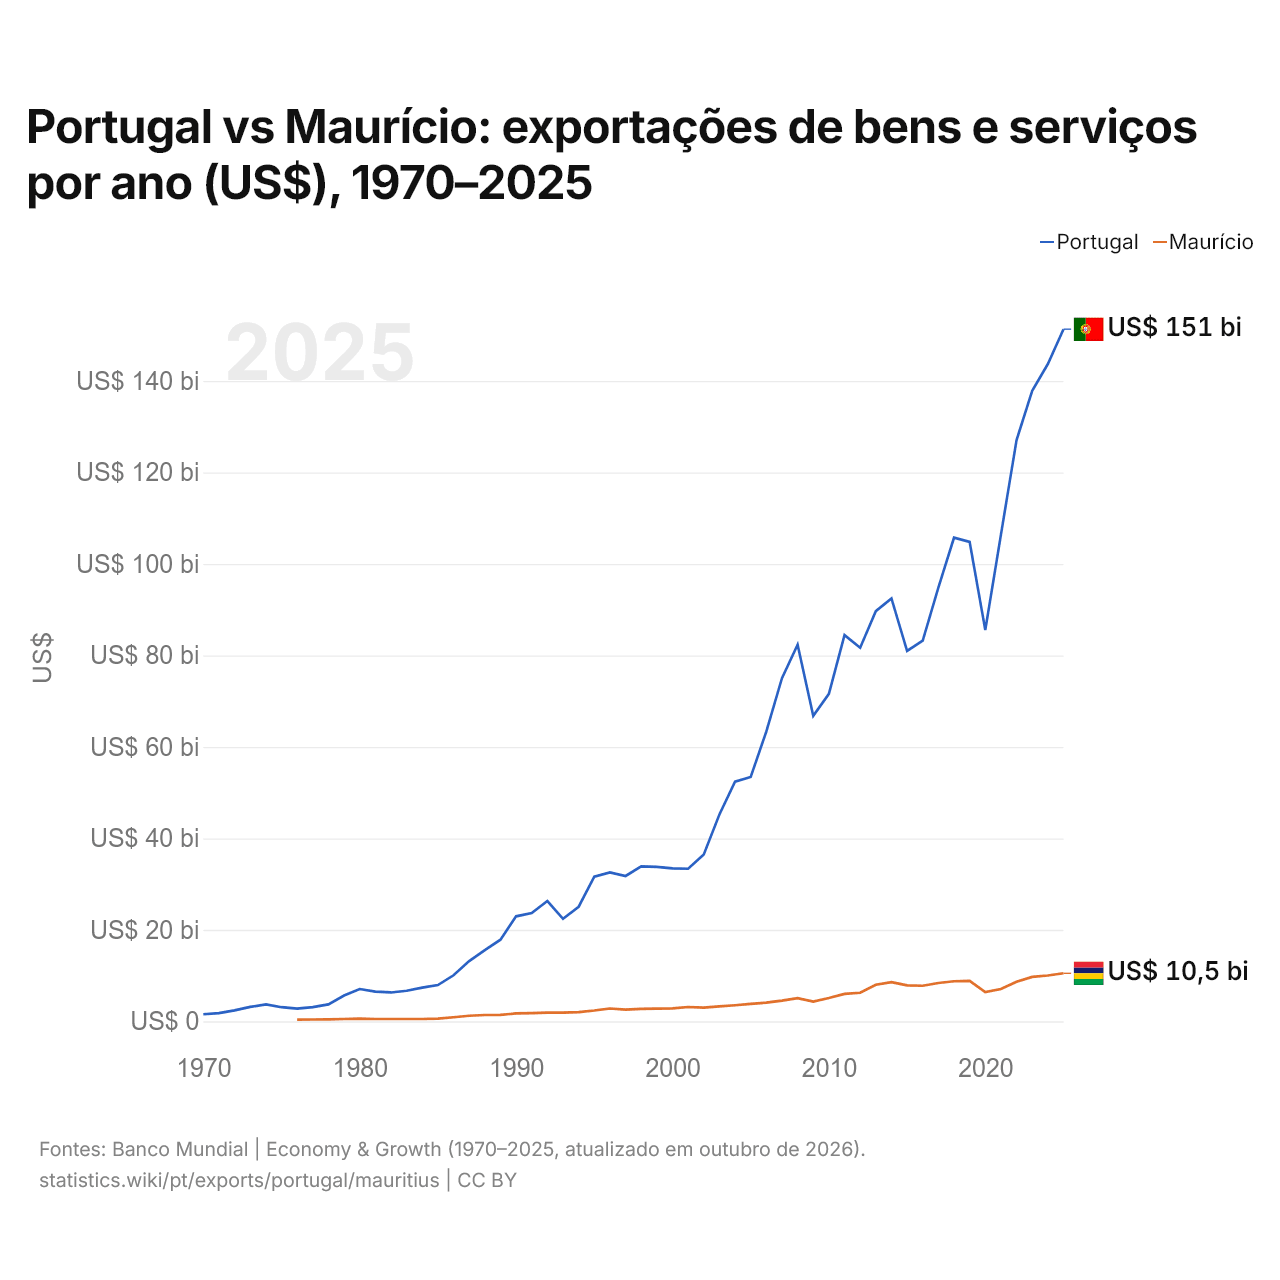
Em 2025, as exportações de bens e serviços de Portugal foram de US$ 151 bilhões e as de Maurício, de US$ 10,5 bilhões: as de Portugal foram 14 vezes maiores. Em 1976, as exportações de Portugal foram 7,8 vezes maiores: US$ 2,78 bilhões de Portugal e US$ 357 milhões de Maurício.
As exportações de bens e serviços de Portugal têm sido maiores que as de Maurício todos os anos desde 1976.
Exportações de bens entre Portugal e Maurício, segundo o exportador (US$), 2001–2025
| Ano | US$ | |
|---|---|---|
| Portugal → Maurício | Maurício → Portugal | |
| 2025 | US$ 16.048.000 | US$ 3.610.000 |
| 2024 | US$ 13.880.000 | US$ 9.241.000 |
| 2023 | US$ 17.449.000 | US$ 9.046.000 |
| 2022 | US$ 21.140.000 | US$ 15.676.000 |
| 2021 | US$ 17.147.000 | US$ 10.273.000 |
| 2020 | US$ 15.072.000 | US$ 7.931.000 |
| 2019 | US$ 10.268.000 | US$ 17.046.000 |
| 2018 | US$ 13.600.000 | US$ 11.005.000 |
| 2017 | US$ 5.914.000 | US$ 30.260.000 |
| 2016 | US$ 4.979.000 | US$ 22.077.000 |
| 2015 | US$ 4.443.000 | US$ 11.789.000 |
| 2014 | US$ 5.298.000 | US$ 9.575.000 |
| 2013 | US$ 3.569.000 | US$ 13.825.000 |
| 2012 | US$ 2.456.000 | US$ 8.468.000 |
| 2011 | US$ 3.305.000 | US$ 6.998.000 |
| 2010 | US$ 2.613.000 | US$ 10.160.000 |
| 2009 | US$ 3.022.000 | US$ 44.027.000 |
| 2008 | US$ 3.020.000 | US$ 25.305.000 |
| 2007 | US$ 2.492.000 | US$ 23.034.000 |
| 2006 | US$ 1.832.000 | US$ 5.877.000 |
| 2005 | US$ 2.257.000 | US$ 18.272.000 |
| 2004 | US$ 4.209.000 | US$ 26.152.000 |
| 2003 | US$ 4.531.000 | US$ 19.687.000 |
| 2002 | US$ 2.717.000 | US$ 18.376.000 |
| 2001 | US$ 2.535.000 | US$ 25.495.000 |
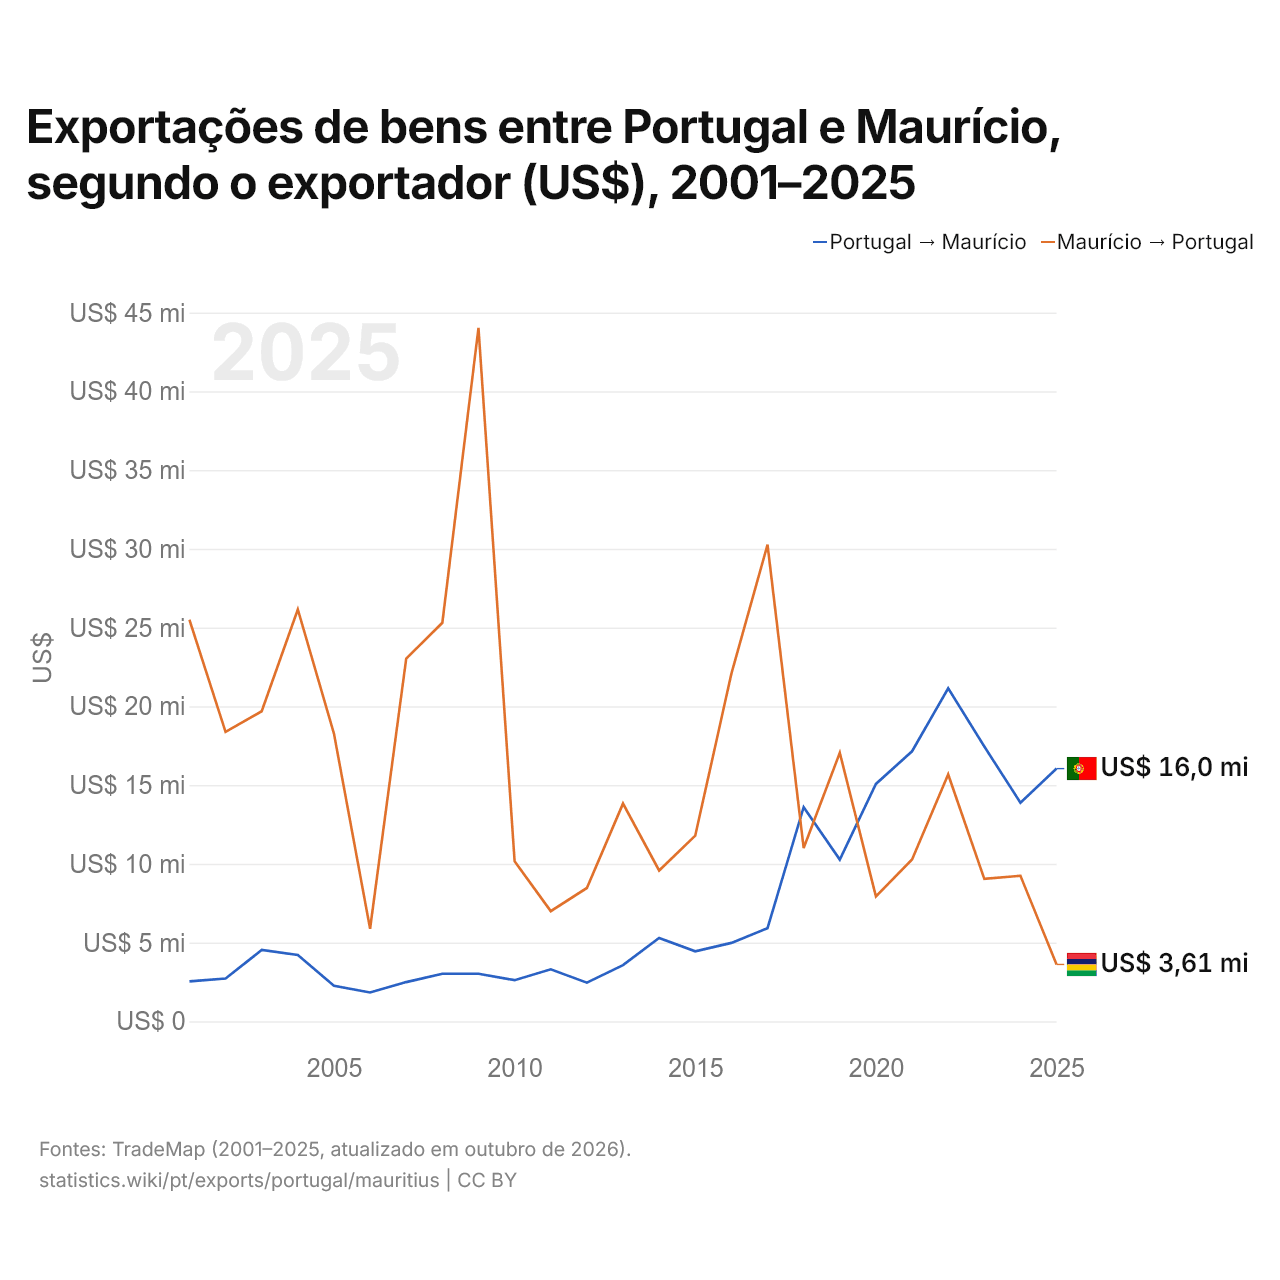
Em 2025, as exportações de bens de Portugal para Maurício, segundo Portugal, foram de US$ 16 milhões, e as de Maurício para Portugal, segundo Maurício, de US$ 3,61 milhões: 4,4 vezes mais de Portugal. Em 2001, foram de US$ 2,54 milhões de Portugal e de US$ 25,5 milhões de Maurício.
Portugal vs Maurício: dados de exportações
|
Portugal
|
Maurício
|
|
|---|---|---|
| Exportações | US$ 151 bi (2025) | US$ 10,5 bi (2025) |
| Posição mundial | 39/176 | 112/176 |
| Participação mundial | 0,43% | 0,03% |
| % do PIB | 43,7% | 65,0% |
| Maior categoria de bens | Máquinas, eletrônicos e veículos (31,6%, 2025) | Alimentos processados, óleos, rações, bebidas e tabaco (32%, 2025) |
| Principal destino dos bens | Espanha (26%, 2025) | França (13,3%, 2025) |
Comparar as exportações de 2 países quaisquer
Fontes:
- Banco Mundial | Economy & Growth (1970–2025, atualizado em outubro de 2026)
- TradeMap (2001–2025, atualizado em outubro de 2026)
Creative Commons Atribuição (CC BY): você pode copiar, compartilhar, adaptar e reutilizar este conteúdo, inclusive para fins comerciais, desde que cite o statistics.wiki e indique as alterações que fizer. As fontes listadas acima podem ter suas próprias condições de licença.