
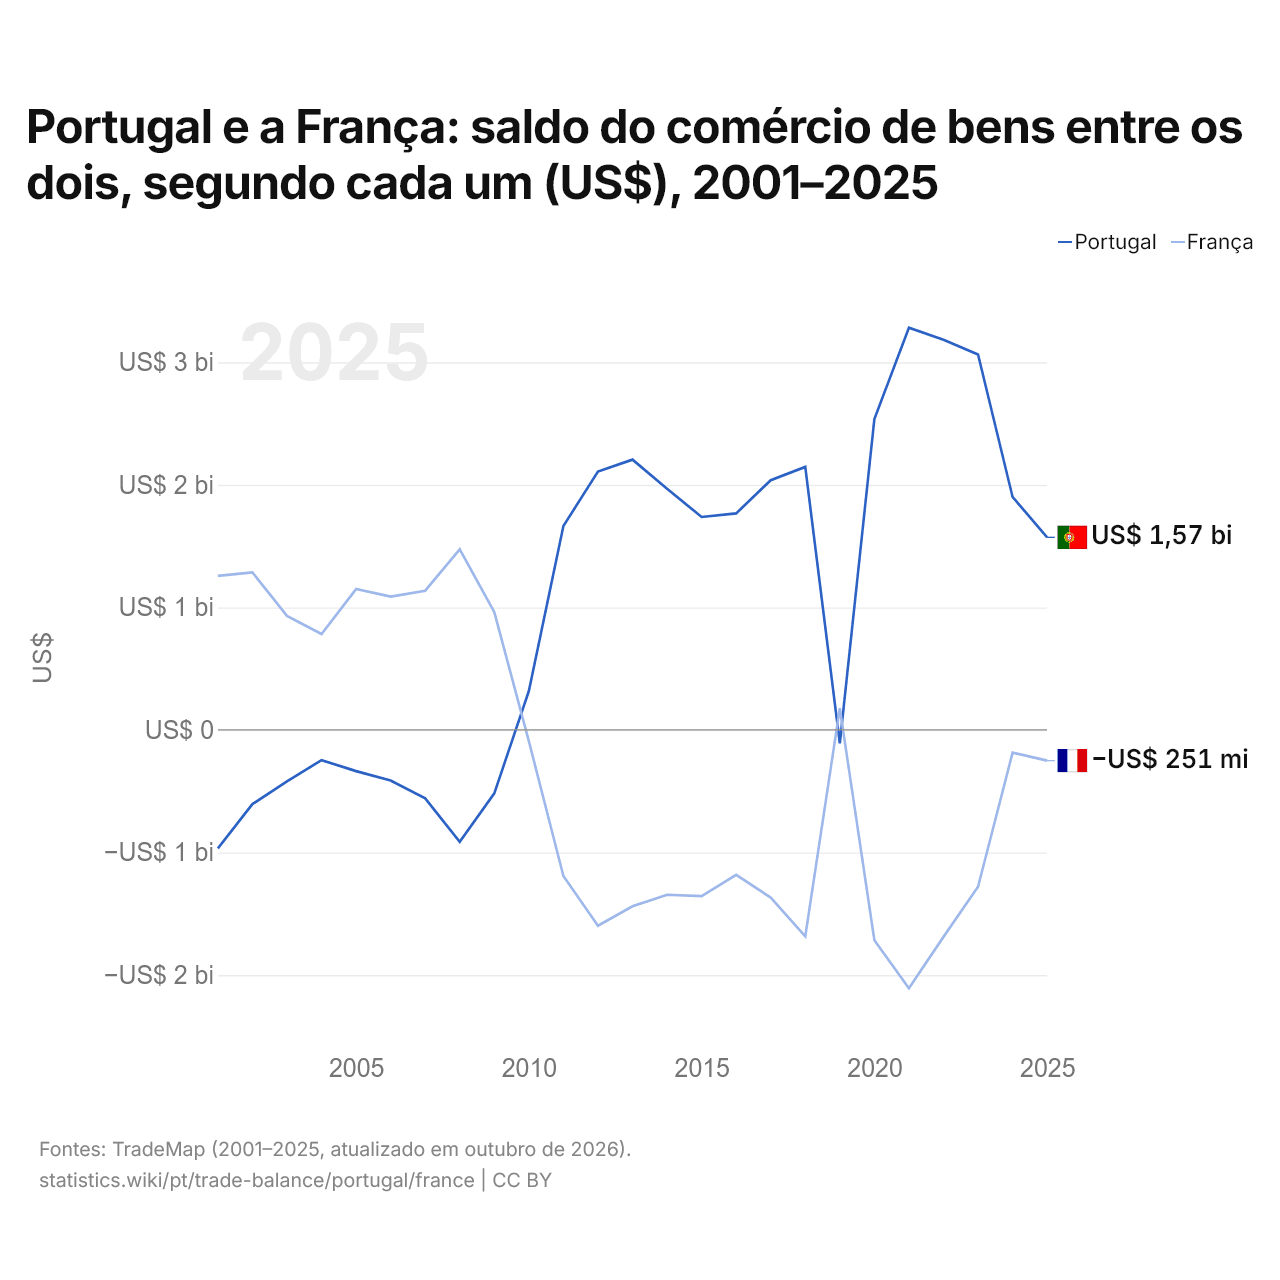
Portugal e a França: saldo do comércio de bens entre os dois, segundo cada um (US$), 2001–2025
| Ano | US$ | |
|---|---|---|
| Portugal | França | |
| 2025 | US$ 1.571.861.000 | US$ −250.644.000 |
| 2024 | US$ 1.901.170.000 | US$ −185.395.000 |
| 2023 | US$ 3.063.526.000 | US$ −1.279.721.000 |
| 2022 | US$ 3.183.614.000 | US$ −1.688.536.000 |
| 2021 | US$ 3.282.291.000 | US$ −2.108.138.000 |
| 2020 | US$ 2.536.328.000 | US$ −1.715.677.000 |
| 2019 | US$ −109.947.000 | US$ 177.123.000 |
| 2018 | US$ 2.146.616.000 | US$ −1.684.595.000 |
| 2017 | US$ 2.037.867.000 | US$ −1.367.597.000 |
| 2016 | US$ 1.766.928.000 | US$ −1.182.518.000 |
| 2015 | US$ 1.737.928.000 | US$ −1.355.532.000 |
| 2014 | US$ 1.967.688.000 | US$ −1.344.678.000 |
| 2013 | US$ 2.205.844.000 | US$ −1.438.449.000 |
| 2012 | US$ 2.108.191.000 | US$ −1.597.417.000 |
| 2011 | US$ 1.664.520.000 | US$ −1.191.635.000 |
| 2010 | US$ 317.371.000 | US$ −91.791.000 |
| 2009 | US$ −517.641.000 | US$ 961.372.000 |
| 2008 | US$ −912.294.000 | US$ 1.473.664.000 |
| 2007 | US$ −557.930.000 | US$ 1.136.213.000 |
| 2006 | US$ −412.157.000 | US$ 1.087.465.000 |
| 2005 | US$ −335.774.000 | US$ 1.149.536.000 |
| 2004 | US$ −246.206.000 | US$ 782.697.000 |
| 2003 | US$ −419.926.000 | US$ 930.122.000 |
| 2002 | US$ −605.145.000 | US$ 1.285.249.000 |
| 2001 | US$ −966.212.000 | US$ 1.257.171.000 |
Em 2025, segundo Portugal, o seu comércio de bens com a França teve um superávit de US$ 1,57 bilhão; segundo a França, o seu comércio de bens com Portugal teve um déficit de US$ 251 milhões. Em 2001, os valores foram um déficit de US$ 966 milhões de Portugal e um superávit de US$ 1,26 bilhão da França.
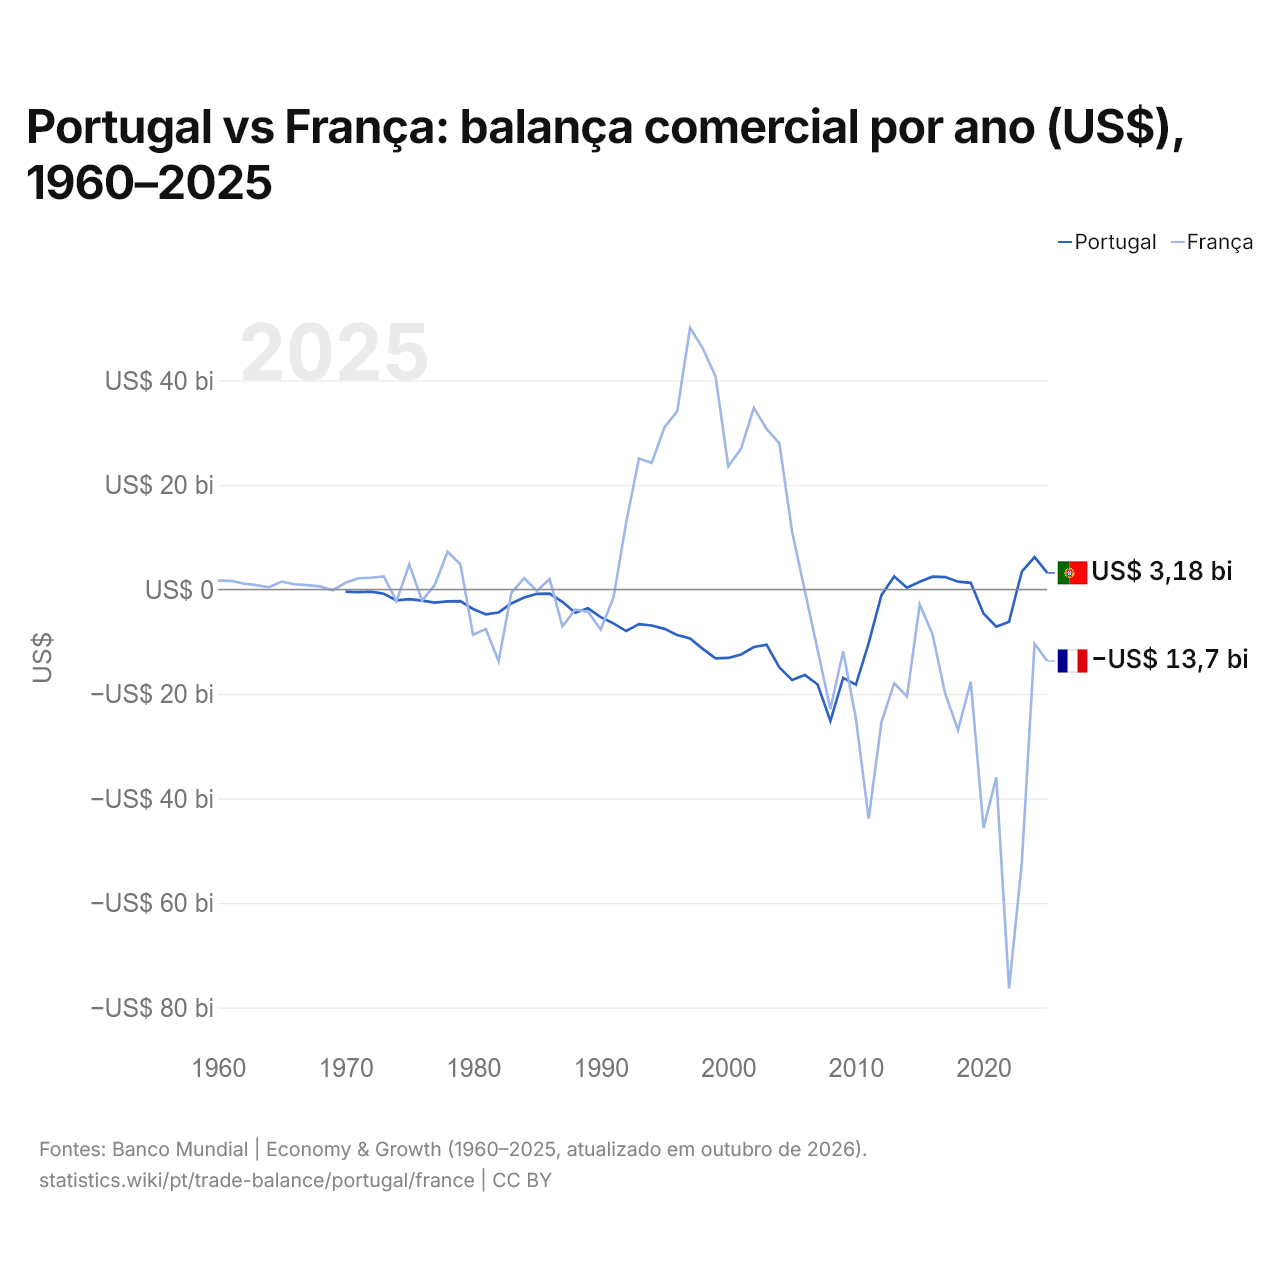
Portugal vs França: balança comercial por ano (US$), 1960–2025
| Ano | US$ | |
|---|---|---|
 Portugal |
 França |
|
| 2025 | US$ 3.179.729.609 | US$ −13.691.892.676 |
| 2024 | US$ 6.203.529.441 | US$ −10.387.713.597 |
| 2023 | US$ 3.435.097.440 | US$ −52.372.867.874 |
| 2022 | US$ −6.167.577.402 | US$ −76.323.175.109 |
| 2021 | US$ −7.109.880.156 | US$ −35.964.530.801 |
| 2020 | US$ −4.584.592.430 | US$ −45.662.030.726 |
| 2019 | US$ 1.285.251.893 | US$ −17.694.749.944 |
| 2018 | US$ 1.499.682.322 | US$ −26.878.288.452 |
| 2017 | US$ 2.379.942.262 | US$ −19.990.725.131 |
| 2016 | US$ 2.450.560.626 | US$ −8.555.918.301 |
| 2015 | US$ 1.474.193.135 | US$ −2.874.747.900 |
| 2014 | US$ 343.995.351 | US$ −20.476.182.589 |
| 2013 | US$ 2.487.546.494 | US$ −17.928.929.470 |
| 2012 | US$ −1.069.897.488 | US$ −25.424.169.112 |
| 2011 | US$ −10.270.004.539 | US$ −43.858.143.696 |
| 2010 | US$ −18.202.971.435 | US$ −24.731.111.845 |
| 2009 | US$ −16.894.818.154 | US$ −11.805.159.462 |
| 2008 | US$ −25.165.708.546 | US$ −22.878.042.543 |
| 2007 | US$ −18.176.093.820 | US$ −11.565.875.316 |
| 2006 | US$ −16.350.314.966 | US$ −314.778.625 |
| 2005 | US$ −17.311.334.503 | US$ 11.054.488.524 |
| 2004 | US$ −14.905.302.070 | US$ 27.985.189.929 |
| 2003 | US$ −10.582.015.649 | US$ 30.738.831.193 |
| 2002 | US$ −11.001.387.196 | US$ 34.756.831.657 |
| 2001 | US$ −12.424.660.029 | US$ 26.968.658.956 |
| 2000 | US$ −13.098.469.052 | US$ 23.545.285.267 |
| 1999 | US$ −13.193.669.762 | US$ 40.790.461.990 |
| 1998 | US$ −11.362.958.593 | US$ 46.166.110.740 |
| 1997 | US$ −9.357.416.810 | US$ 50.108.338.953 |
| 1996 | US$ −8.722.525.344 | US$ 34.112.706.757 |
| 1995 | US$ −7.530.287.913 | US$ 31.069.260.087 |
| 1994 | US$ −6.888.712.560 | US$ 24.247.400.756 |
| 1993 | US$ −6.626.869.468 | US$ 25.065.323.141 |
| 1992 | US$ −7.950.987.526 | US$ 12.888.475.836 |
| 1991 | US$ −6.488.605.522 | US$ −1.575.747.006 |
| 1990 | US$ −5.287.396.991 | US$ −7.657.631.611 |
| 1989 | US$ −3.598.389.356 | US$ −4.238.741.518 |
| 1988 | US$ −4.466.105.850 | US$ −3.842.638.476 |
| 1987 | US$ −2.360.348.655 | US$ −7.038.415.366 |
| 1986 | US$ −786.655.944 | US$ 2.015.437.068 |
| 1985 | US$ −822.089.658 | US$ −286.173.164 |
| 1984 | US$ −1.526.440.701 | US$ 2.161.975.531 |
| 1983 | US$ −2.676.254.072 | US$ −632.756.692 |
| 1982 | US$ −4.394.442.482 | US$ −13.723.325.681 |
| 1981 | US$ −4.769.358.306 | US$ −7.579.843.090 |
| 1980 | US$ −3.725.442.531 | US$ −8.643.123.254 |
| 1979 | US$ −2.220.319.672 | US$ 4.816.373.728 |
| 1978 | US$ −2.256.546.533 | US$ 7.241.133.721 |
| 1977 | US$ −2.499.565.217 | US$ 868.280.289 |
| 1976 | US$ −2.113.779.841 | US$ −2.147.364.108 |
| 1975 | US$ −1.851.043.137 | US$ 4.812.605.171 |
| 1974 | US$ −2.073.433.307 | US$ −2.215.630.115 |
| 1973 | US$ −808.299.264 | US$ 2.527.401.296 |
| 1972 | US$ −399.770.200 | US$ 2.245.383.615 |
| 1971 | US$ −494.459.364 | US$ 2.159.464.899 |
| 1970 | US$ −404.839.609 | US$ 1.297.980.394 |
| 1969 | - | US$ −146.618.606 |
| 1968 | - | US$ 612.901.162 |
| 1967 | - | US$ 840.231.291 |
| 1966 | - | US$ 1.011.891.447 |
| 1965 | - | US$ 1.521.823.088 |
| 1964 | - | US$ 442.835.372 |
| 1963 | - | US$ 841.559.930 |
| 1962 | - | US$ 1.154.587.274 |
| 1961 | - | US$ 1.666.644.737 |
| 1960 | - | US$ 1.710.489.823 |
Em 2025, a balança comercial de Portugal teve um superávit de US$ 3,18 bilhões e a da França, um déficit de US$ 13,7 bilhões. Em 1970, a balança comercial de Portugal teve um déficit de US$ 405 milhões e a da França, um superávit de US$ 1,3 bilhão.
De 1970 a 2025, a balança comercial de Portugal teve superávit em 10 dos 56 anos, e a da França, em 24. As balanças comerciais de Portugal e da França tiveram déficit ao mesmo tempo em 22 desses anos, o mais recente em 2022.
Portugal vs França: dados da balança comercial
|
Portugal
|
França
|
|
|---|---|---|
| Bens e serviços, US$ | +US$ 3,18 bi (2025) | -US$ 13,7 bi (2025) |
| % do PIB | +0,9% (2025) | −0,4% (2025) |
| Anos com superávit desde 2000 | 10 de 26 | 6 de 26 |
| Saldo de bens entre os dois, dados próprios | +US$ 1,57 bi (2025) | -US$ 251 mi (2025) |
| Maior superávit em bens com | Reino Unido (+US$ 2,72 bi, 2025) | Reino Unido (+US$ 15,2 bi, 2025) |
| Maior déficit em bens com | Espanha (-US$ 18,1 bi, 2025) | China (-US$ 56,4 bi, 2025) |
Comparar a balança comercial de 2 países quaisquer
Fontes:
- Banco Mundial | Economy & Growth (1960–2025, atualizado em outubro de 2026)
- TradeMap (2001–2025, atualizado em outubro de 2026)
Creative Commons Atribuição (CC BY): você pode copiar, compartilhar, adaptar e reutilizar este conteúdo, inclusive para fins comerciais, desde que cite o statistics.wiki e indique as alterações que fizer. As fontes listadas acima podem ter suas próprias condições de licença.