
Balança comercial do Chile por ano (US$): superávit (+) ou déficit (−), 1960–2025
| Ano | US$ | ||
|---|---|---|---|
| Bens e serviços | Bens | Serviços | |
| 2025 | US$ 14.804.975.228 | US$ 23.847.483.262 | US$ −8.936.436.623 |
| 2024 | US$ 11.545.176.279 | US$ 20.786.106.473 | US$ −9.222.607.002 |
| 2023 | US$ 2.933.166.506 | US$ 13.842.440.399 | US$ −10.674.073.677 |
| 2022 | US$ −12.014.002.658 | US$ 3.570.170.230 | US$ −15.459.973.251 |
| 2021 | US$ −2.812.122.188 | US$ 10.305.307.876 | US$ −12.493.781.215 |
| 2020 | US$ 11.375.796.052 | US$ 18.916.838.077 | US$ −7.472.497.958 |
| 2019 | US$ −5.182.833.879 | US$ 3.016.114.211 | US$ −8.085.039.909 |
| 2018 | US$ −3.310.530.298 | US$ 4.408.553.728 | US$ −7.341.459.723 |
| 2017 | US$ 1.757.984.593 | US$ 7.490.388.029 | US$ −5.610.538.074 |
| 2016 | US$ −527.476.210 | US$ 4.950.676.697 | US$ −5.478.624.067 |
| 2015 | US$ −2.344.379.586 | US$ 3.575.844.055 | US$ −5.570.964.042 |
| 2014 | US$ 968.625.055 | US$ 6.730.623.443 | US$ −5.656.386.892 |
| 2013 | US$ −2.686.187.876 | US$ 2.399.399.685 | US$ −4.964.712.505 |
| 2012 | US$ −1.241.559.881 | US$ 2.909.235.473 | US$ −4.156.421.239 |
| 2011 | US$ 7.284.859.134 | US$ 11.266.280.940 | US$ −3.925.623.938 |
| 2010 | US$ 13.219.086.595 | US$ 16.314.604.394 | US$ −2.967.625.900 |
| 2009 | US$ 12.961.051.576 | US$ 15.600.676.607 | US$ −2.384.528.438 |
| 2008 | US$ 2.965.553.776 | US$ 6.339.793.631 | US$ −2.001.270.083 |
| 2007 | US$ 22.911.435.530 | US$ 24.296.241.476 | US$ −1.440.673.507 |
| 2006 | US$ 21.568.421.478 | US$ 23.112.183.624 | US$ −1.492.137.882 |
| 2005 | US$ 10.136.483.837 | US$ 11.465.310.546 | US$ −1.224.687.592 |
| 2004 | US$ 9.394.522.805 | US$ 10.287.252.365 | US$ −828.175.740 |
| 2003 | US$ 3.387.497.528 | US$ 3.943.450.626 | US$ −466.770.446 |
| 2002 | US$ 1.426.773.699 | US$ 2.435.596.068 | US$ −751.495.185 |
| 2001 | US$ 1.109.305.458 | US$ 1.915.250.807 | US$ −915.964.256 |
| 2000 | US$ 1.202.974.079 | US$ 2.181.077.166 | US$ −781.022.488 |
| 1999 | US$ 1.453.087.040 | US$ 2.480.158.434 | US$ −790.185.006 |
| 1998 | US$ −2.909.838.412 | US$ −1.965.893.790 | US$ −526.183.533 |
| 1997 | US$ −2.009.169.758 | US$ −1.352.262.337 | US$ −211.118.472 |
| 1996 | US$ −1.587.287.186 | US$ −997.349.196 | US$ −75.275.937 |
| 1995 | US$ 1.678.472.004 | US$ 1.381.000.000 | US$ −324.100.000 |
| 1994 | US$ 975.504.071 | US$ 732.000.000 | US$ −151.000.000 |
| 1993 | US$ −910.684.560 | US$ −989.800.000 | US$ −225.900.000 |
| 1992 | US$ 767.144.020 | US$ 722.000.000 | US$ −176.000.000 |
| 1991 | US$ 1.706.007.584 | US$ 1.485.100.000 | US$ 33.600.000 |
| 1990 | US$ 1.074.813.125 | US$ 1.283.500.000 | US$ −228.210.000 |
| 1989 | US$ 1.325.335.767 | US$ 1.483.200.000 | US$ −460.660.000 |
| 1988 | US$ 1.690.789.705 | US$ 2.209.800.000 | US$ −690.500.000 |
| 1987 | US$ 555.122.127 | US$ 1.308.700.000 | US$ −453.800.000 |
| 1986 | US$ 488.799.123 | US$ 1.092.100.000 | US$ −464.340.000 |
| 1985 | US$ 339.874.219 | US$ 883.700.000 | US$ −387.980.000 |
| 1984 | US$ −326.526.915 | US$ 362.000.000 | US$ −543.000.000 |
| 1983 | US$ 412.516.962 | US$ 986.000.000 | US$ −439.000.000 |
| 1982 | US$ −515.371.499 | US$ 63.000.000 | US$ −474.000.000 |
| 1981 | US$ −3.683.471.885 | US$ −2.677.000.000 | US$ −608.000.000 |
| 1980 | US$ −1.387.218.822 | US$ −764.000.000 | US$ −320.000.000 |
| 1979 | US$ −745.793.488 | US$ −355.000.000 | US$ −263.000.000 |
| 1978 | US$ −613.837.751 | US$ −426.000.000 | US$ −270.000.000 |
| 1977 | US$ −320.362.052 | US$ 35.000.000 | US$ −317.000.000 |
| 1976 | US$ 375.782.332 | US$ 643.000.000 | US$ −218.000.000 |
| 1975 | US$ −187.399.628 | US$ 70.000.000 | US$ −287.000.000 |
| 1974 | US$ 37.116.935 | - | - |
| 1973 | US$ −351.014.126 | - | - |
| 1972 | US$ −426.238.589 | - | - |
| 1971 | US$ −131.010.402 | - | - |
| 1970 | US$ 35.341.639 | - | - |
| 1969 | US$ 168.513.808 | - | - |
| 1968 | US$ 43.189.791 | - | - |
| 1967 | US$ 80.542.423 | - | - |
| 1966 | US$ 67.017.398 | - | - |
| 1965 | US$ 38.087.742 | - | - |
| 1964 | US$ −58.309.926 | - | - |
| 1963 | US$ −138.188.656 | - | - |
| 1962 | US$ −81.469.754 | - | - |
| 1961 | US$ −198.972.381 | - | - |
| 1960 | US$ −114.140.000 | - | - |
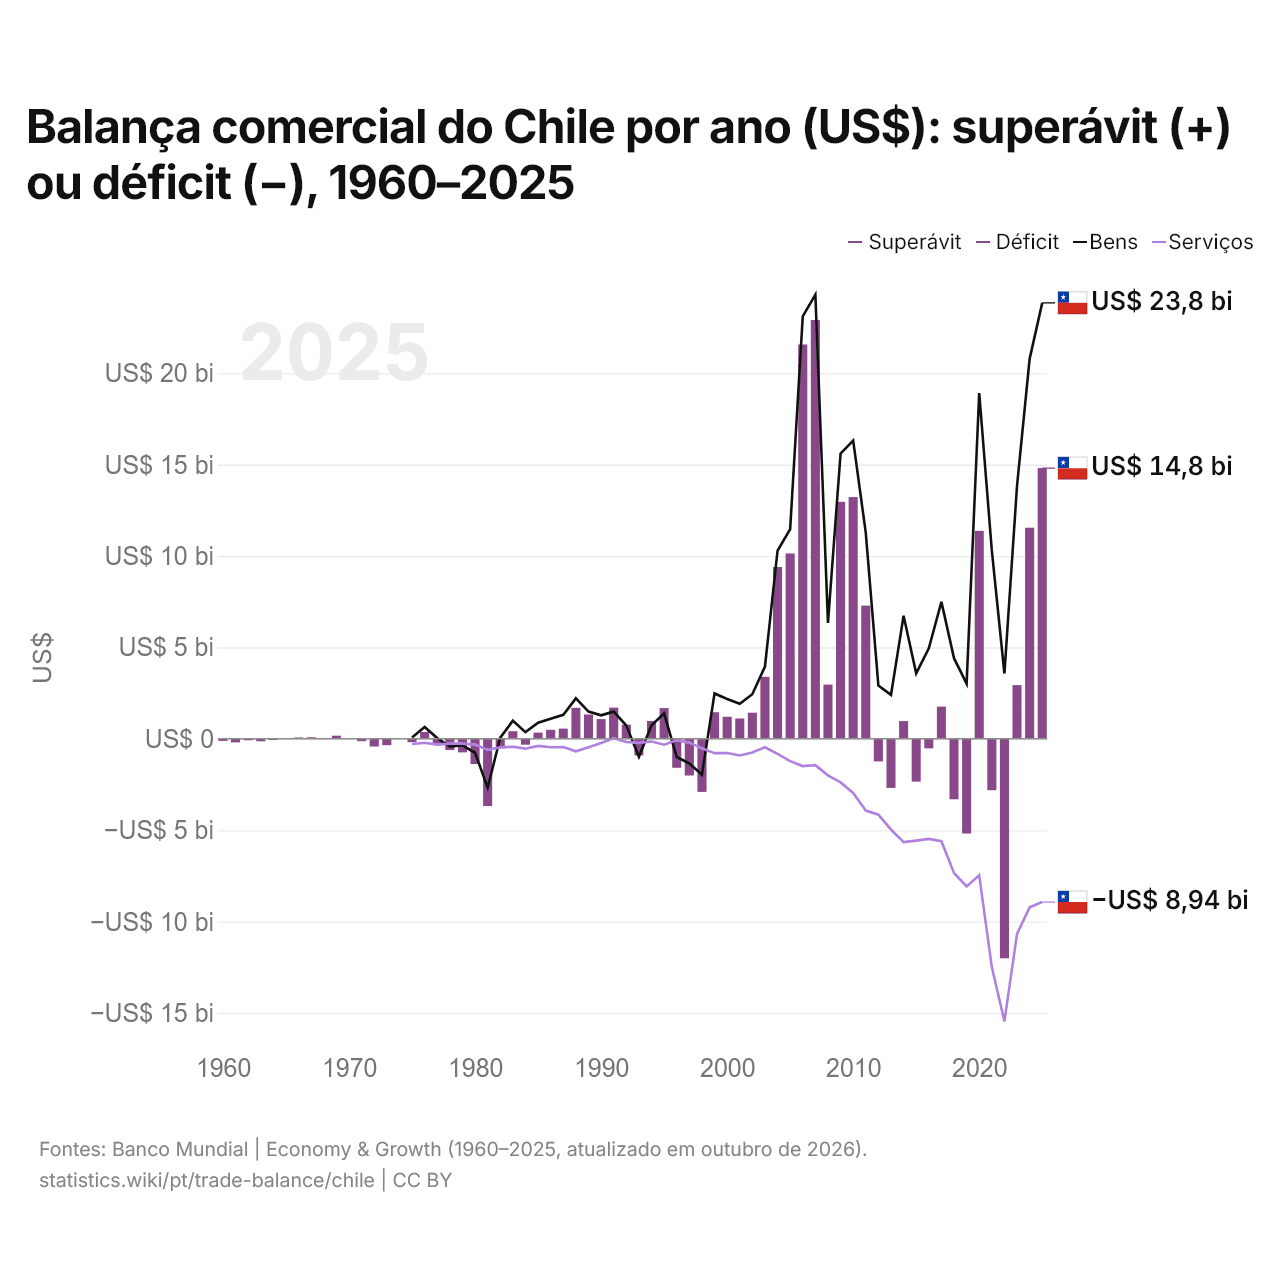
Em 2025, a balança comercial do Chile teve um superávit de US$ 14,8 bilhões, ante um déficit de US$ 114 milhões em 1960. O maior déficit foi de US$ 12 bilhões, em 2022, e o maior superávit, de US$ 22,9 bilhões, em 2007. A balança comercial do Chile teve superávit em todos os anos desde 2023. O comércio de bens teve um superávit de US$ 23,8 bilhões e o de serviços, um déficit de US$ 8,94 bilhões.
Em 2025, o saldo comercial do Chile foi o 2º mais alto de 26 países da América Latina, onde os saldos iam de um déficit de US$ 24,7 bilhões na Colômbia a um superávit de US$ 27,2 bilhões no Peru. De 2016 a 2025, os saldos comerciais do Chile somaram um superávit de US$ 18,6 bilhões, ante um superávit de US$ 75,6 bilhões de 2006 a 2015. Em 2025, a conta corrente do Chile teve um déficit de 1,2% do PIB.
Comércio de bens do Chile com os seus 10 maiores parceiros comerciais, segundo o Chile, 2025
| País | Exportações para | Importações de | Saldo | |
|---|---|---|---|---|
 China |
US$ 39,0 bi | US$ 23,8 bi | +US$ 15,1 bi | |
 Estados Unidos |
US$ 19,7 bi | US$ 15,9 bi | +US$ 3,82 bi | |
 Brasil |
US$ 5,20 bi | US$ 7,85 bi | -US$ 2,65 bi | vs Brasil |
 Japão |
US$ 8,40 bi | US$ 1,82 bi | +US$ 6,57 bi | vs Japão |
 Argentina |
US$ 1,30 bi | US$ 6,85 bi | -US$ 5,55 bi | vs Argentina |
 Coreia do Sul |
US$ 4,87 bi | US$ 1,63 bi | +US$ 3,24 bi | |
 Índia |
US$ 3,94 bi | US$ 1,42 bi | +US$ 2,52 bi | |
 Alemanha |
US$ 1,77 bi | US$ 3,08 bi | -US$ 1,31 bi | |
 Peru |
US$ 2,43 bi | US$ 2,13 bi | +US$ 301 mi | vs Peru |
 Espanha |
US$ 2,09 bi | US$ 2,13 bi | -US$ 44,1 mi | vs Espanha |
Balança comercial do Chile: superávit (+) ou déficit (−)
Comparar a balança comercial do Chile com a de outros países
Fontes:
- TradeMap (2025, atualizado em outubro de 2026)
- Banco Mundial | Economy & Growth (1960–2025, atualizado em outubro de 2026)
Creative Commons Atribuição (CC BY): você pode copiar, compartilhar, adaptar e reutilizar este conteúdo, inclusive para fins comerciais, desde que cite o statistics.wiki e indique as alterações que fizer. As fontes listadas acima podem ter suas próprias condições de licença.