
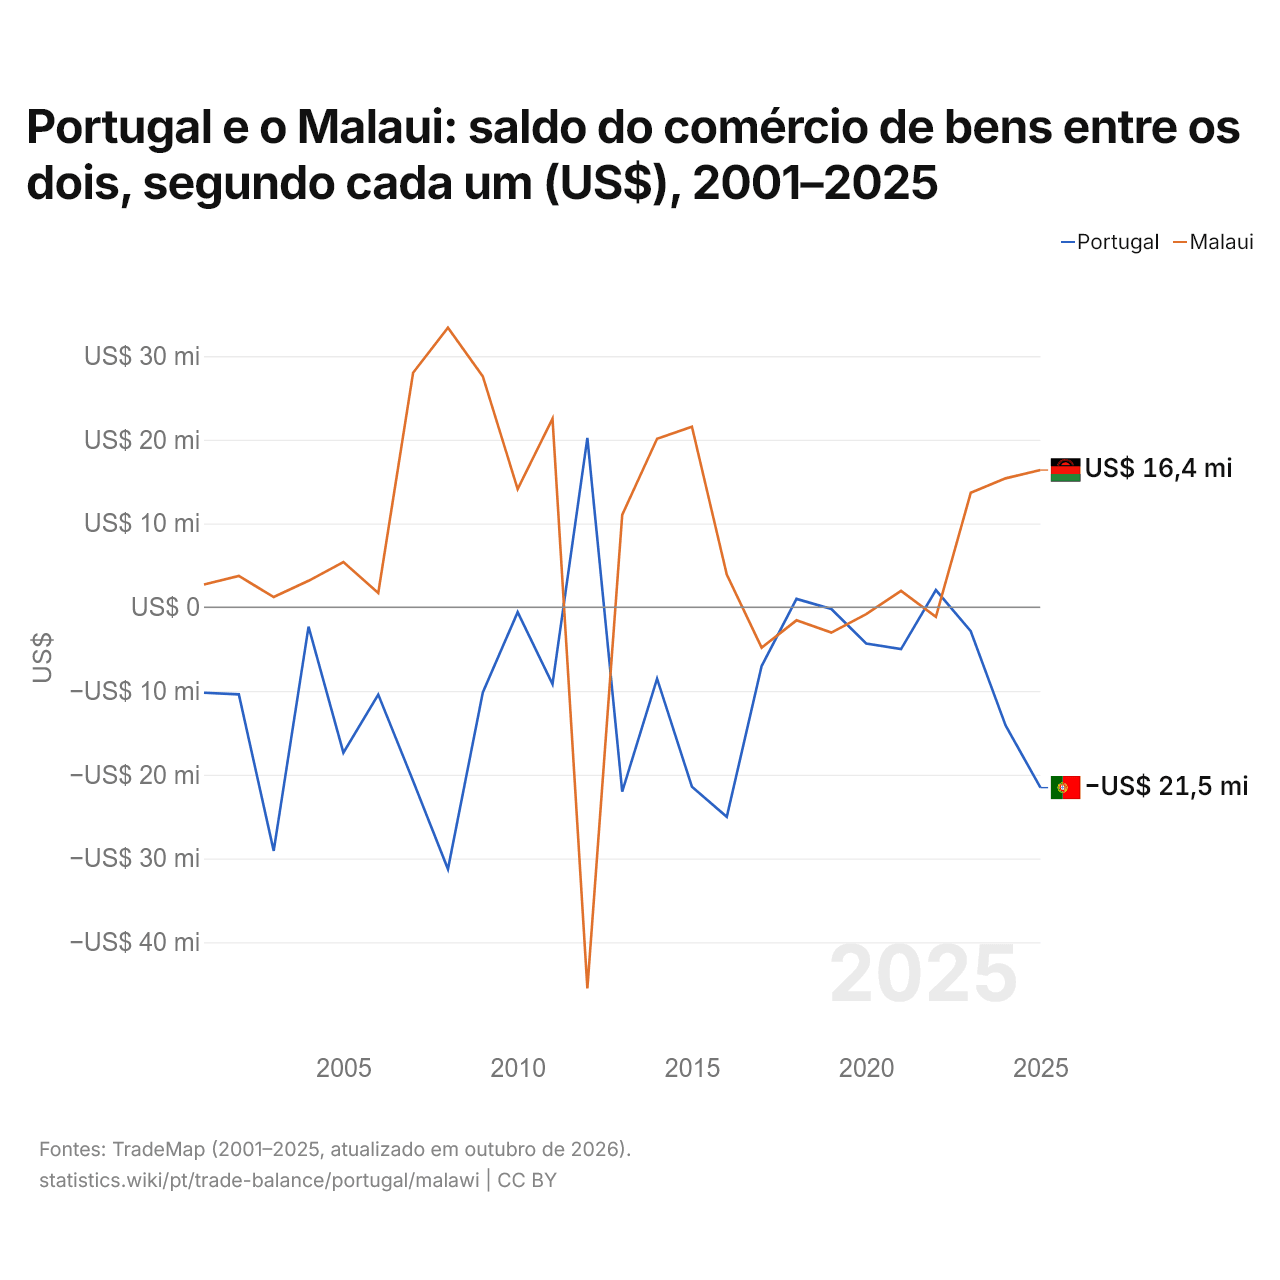
Portugal e o Malaui: saldo do comércio de bens entre os dois, segundo cada um (US$), 2001–2025
| Ano | US$ | |
|---|---|---|
| Portugal | Malaui | |
| 2025 | US$ −21.544.000 | US$ 16.383.000 |
| 2024 | US$ −14.122.000 | US$ 15.392.000 |
| 2023 | US$ −2.866.000 | US$ 13.662.000 |
| 2022 | US$ 2.049.000 | US$ −1.152.000 |
| 2021 | US$ −5.002.000 | US$ 1.960.000 |
| 2020 | US$ −4.340.000 | US$ −822.000 |
| 2019 | US$ −210.000 | US$ −3.032.000 |
| 2018 | US$ 991.000 | US$ −1.566.000 |
| 2017 | US$ −7.025.000 | US$ −4.824.000 |
| 2016 | US$ −25.041.000 | US$ 3.907.000 |
| 2015 | US$ −21.438.000 | US$ 21.558.000 |
| 2014 | US$ −8.530.000 | US$ 20.125.000 |
| 2013 | US$ −22.016.000 | US$ 11.035.000 |
| 2012 | US$ 20.224.000 | US$ −45.513.000 |
| 2011 | US$ −9.195.000 | US$ 22.533.000 |
| 2010 | US$ −585.000 | US$ 14.115.000 |
| 2009 | US$ −10.176.000 | US$ 27.576.000 |
| 2008 | US$ −31.275.000 | US$ 33.386.000 |
| 2007 | US$ −20.752.000 | US$ 28.006.000 |
| 2006 | US$ −10.425.000 | US$ 1.702.000 |
| 2005 | US$ −17.374.000 | US$ 5.394.000 |
| 2004 | US$ −2.314.000 | US$ 3.155.000 |
| 2003 | US$ −29.100.000 | US$ 1.217.000 |
| 2002 | US$ −10.404.000 | US$ 3.734.000 |
| 2001 | US$ −10.213.000 | US$ 2.723.000 |
Em 2025, segundo Portugal, o seu comércio de bens com o Malaui teve um déficit de US$ 21,5 milhões; segundo o Malaui, o seu comércio de bens com Portugal teve um superávit de US$ 16,4 milhões. Em 2001, os valores foram um déficit de US$ 10,2 milhões de Portugal e um superávit de US$ 2,72 milhões do Malaui.
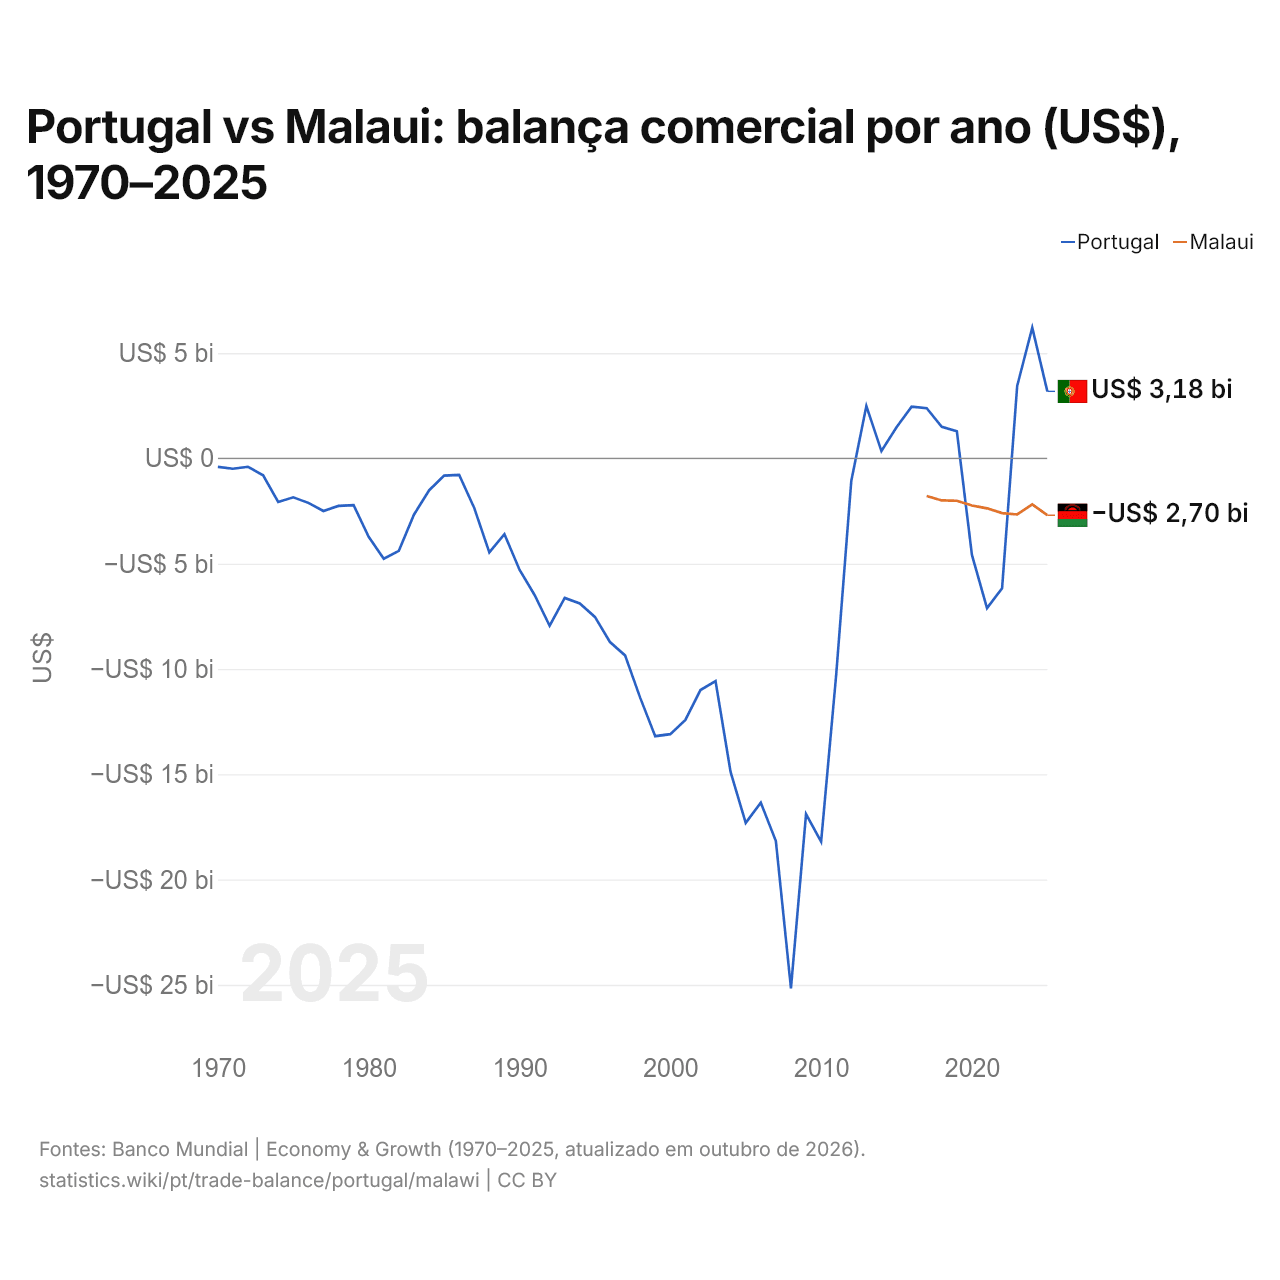
Portugal vs Malaui: balança comercial por ano (US$), 1970–2025
| Ano | US$ | |
|---|---|---|
 Portugal |
 Malaui |
|
| 2025 | US$ 3.179.729.609 | US$ −2.700.469.202 |
| 2024 | US$ 6.203.529.441 | US$ −2.186.909.316 |
| 2023 | US$ 3.435.097.440 | US$ −2.665.730.786 |
| 2022 | US$ −6.167.577.402 | US$ −2.601.633.817 |
| 2021 | US$ −7.109.880.156 | US$ −2.373.114.320 |
| 2020 | US$ −4.584.592.430 | US$ −2.238.857.165 |
| 2019 | US$ 1.285.251.893 | US$ −2.013.265.090 |
| 2018 | US$ 1.499.682.322 | US$ −1.998.883.478 |
| 2017 | US$ 2.379.942.262 | US$ −1.784.242.184 |
| 2016 | US$ 2.450.560.626 | - |
| 2015 | US$ 1.474.193.135 | - |
| 2014 | US$ 343.995.351 | - |
| 2013 | US$ 2.487.546.494 | - |
| 2012 | US$ −1.069.897.488 | - |
| 2011 | US$ −10.270.004.539 | - |
| 2010 | US$ −18.202.971.435 | - |
| 2009 | US$ −16.894.818.154 | - |
| 2008 | US$ −25.165.708.546 | - |
| 2007 | US$ −18.176.093.820 | - |
| 2006 | US$ −16.350.314.966 | - |
| 2005 | US$ −17.311.334.503 | - |
| 2004 | US$ −14.905.302.070 | - |
| 2003 | US$ −10.582.015.649 | - |
| 2002 | US$ −11.001.387.196 | - |
| 2001 | US$ −12.424.660.029 | - |
| 2000 | US$ −13.098.469.052 | - |
| 1999 | US$ −13.193.669.762 | - |
| 1998 | US$ −11.362.958.593 | - |
| 1997 | US$ −9.357.416.810 | - |
| 1996 | US$ −8.722.525.344 | - |
| 1995 | US$ −7.530.287.913 | - |
| 1994 | US$ −6.888.712.560 | - |
| 1993 | US$ −6.626.869.468 | - |
| 1992 | US$ −7.950.987.526 | - |
| 1991 | US$ −6.488.605.522 | - |
| 1990 | US$ −5.287.396.991 | - |
| 1989 | US$ −3.598.389.356 | - |
| 1988 | US$ −4.466.105.850 | - |
| 1987 | US$ −2.360.348.655 | - |
| 1986 | US$ −786.655.944 | - |
| 1985 | US$ −822.089.658 | - |
| 1984 | US$ −1.526.440.701 | - |
| 1983 | US$ −2.676.254.072 | - |
| 1982 | US$ −4.394.442.482 | - |
| 1981 | US$ −4.769.358.306 | - |
| 1980 | US$ −3.725.442.531 | - |
| 1979 | US$ −2.220.319.672 | - |
| 1978 | US$ −2.256.546.533 | - |
| 1977 | US$ −2.499.565.217 | - |
| 1976 | US$ −2.113.779.841 | - |
| 1975 | US$ −1.851.043.137 | - |
| 1974 | US$ −2.073.433.307 | - |
| 1973 | US$ −808.299.264 | - |
| 1972 | US$ −399.770.200 | - |
| 1971 | US$ −494.459.364 | - |
| 1970 | US$ −404.839.609 | - |
Em 2025, a balança comercial de Portugal teve um superávit de US$ 3,18 bilhões e a do Malaui, um déficit de US$ 2,7 bilhões. Em 2017, a balança comercial de Portugal teve um superávit de US$ 2,38 bilhões e a do Malaui, um déficit de US$ 1,78 bilhão.
Portugal vs Malaui: dados da balança comercial
|
Portugal
|
Malaui
|
|
|---|---|---|
| Bens e serviços, US$ | +US$ 3,18 bi (2025) | -US$ 2,70 bi (2025) |
| % do PIB | +0,9% (2025) | −18,1% (2025) |
| Anos com superávit desde 2000 | 10 de 26 | 0 de 9 |
| Saldo de bens entre os dois, dados próprios | -US$ 21,5 mi (2025) | +US$ 16,4 mi (2025) |
| Maior superávit em bens com | Reino Unido (+US$ 2,72 bi, 2025) | Bélgica (+US$ 132 mi, 2025) |
| Maior déficit em bens com | Espanha (-US$ 18,1 bi, 2025) | China (-US$ 735 mi, 2025) |
Comparar a balança comercial de 2 países quaisquer
Fontes:
- Banco Mundial | Economy & Growth (1970–2025, atualizado em outubro de 2026)
- TradeMap (2001–2025, atualizado em outubro de 2026)
Creative Commons Atribuição (CC BY): você pode copiar, compartilhar, adaptar e reutilizar este conteúdo, inclusive para fins comerciais, desde que cite o statistics.wiki e indique as alterações que fizer. As fontes listadas acima podem ter suas próprias condições de licença.