
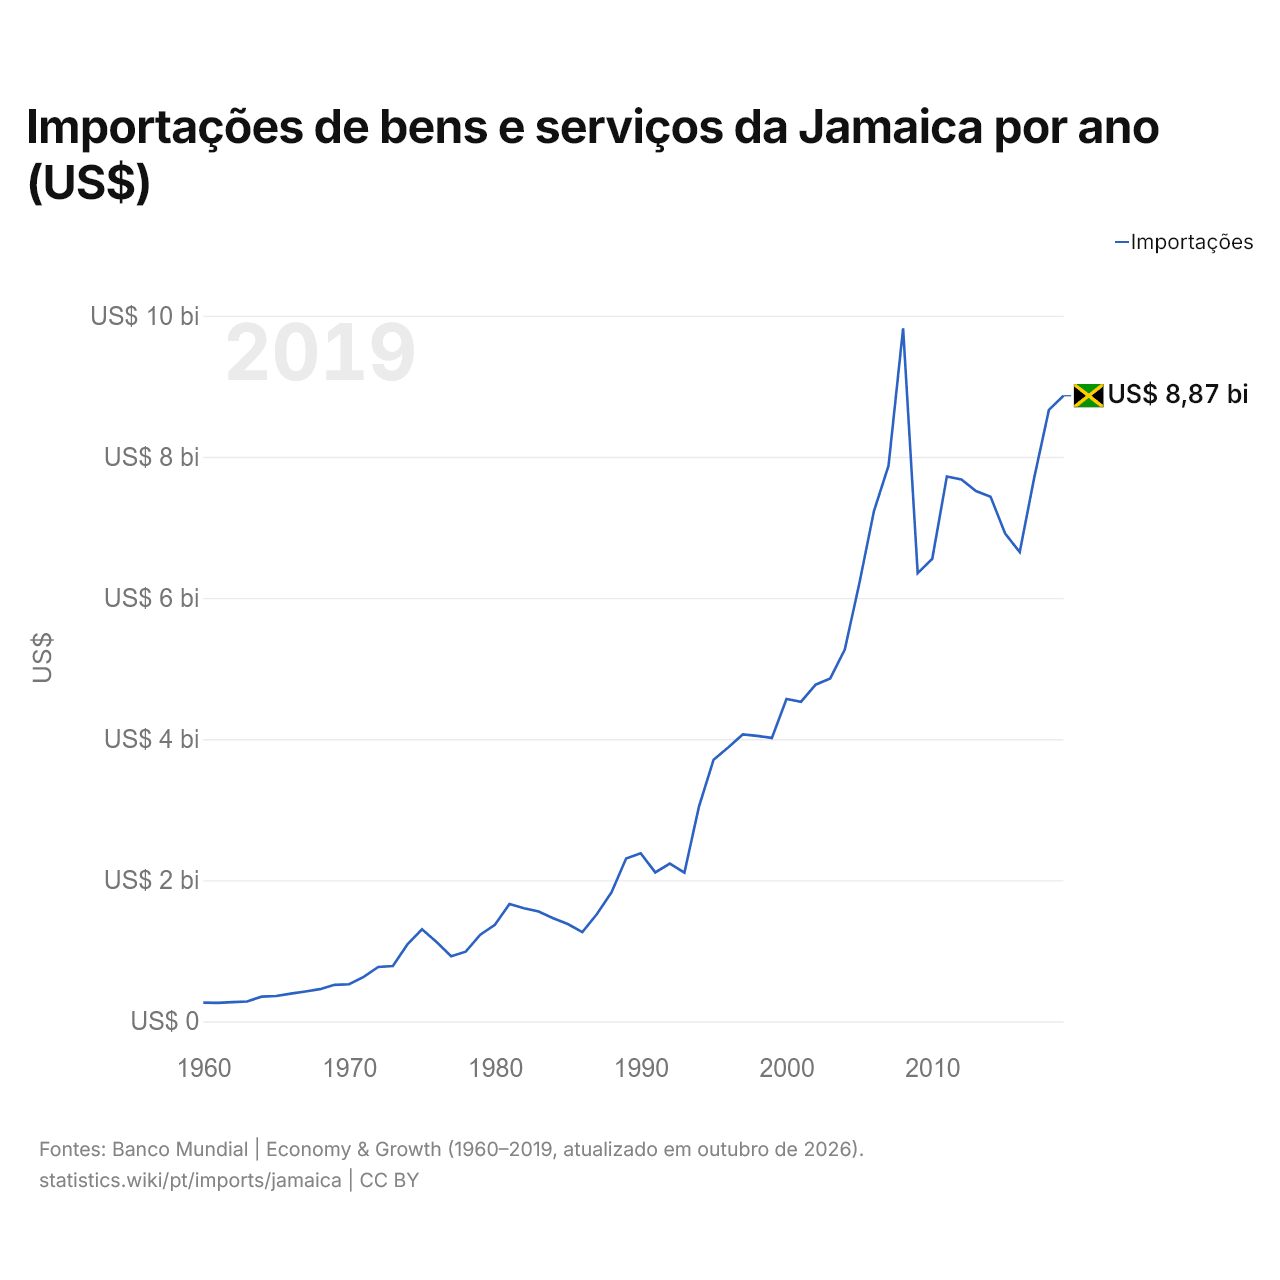
Importações de bens e serviços da Jamaica por ano (US$)
| Ano | US$ |
|---|---|
| Importações | |
| 2019 | US$ 8.866.349.165 |
| 2018 | US$ 8.666.069.763 |
| 2017 | US$ 7.712.823.138 |
| 2016 | US$ 6.651.173.740 |
| 2015 | US$ 6.912.558.477 |
| 2014 | US$ 7.434.187.504 |
| 2013 | US$ 7.514.909.453 |
| 2012 | US$ 7.678.417.130 |
| 2011 | US$ 7.721.134.727 |
| 2010 | US$ 6.555.427.347 |
| 2009 | US$ 6.351.790.086 |
| 2008 | US$ 9.820.605.949 |
| 2007 | US$ 7.873.767.552 |
| 2006 | US$ 7.231.367.529 |
| 2005 | US$ 6.208.262.060 |
| 2004 | US$ 5.267.839.051 |
| 2003 | US$ 4.860.075.377 |
| 2002 | US$ 4.770.556.772 |
| 2001 | US$ 4.529.651.874 |
| 2000 | US$ 4.567.635.283 |
| 1999 | US$ 4.016.518.287 |
| 1998 | US$ 4.045.800.274 |
| 1997 | US$ 4.065.249.732 |
| 1996 | US$ 3.879.895.337 |
| 1995 | US$ 3.708.143.138 |
| 1994 | US$ 3.045.100.768 |
| 1993 | US$ 2.108.459.209 |
| 1992 | US$ 2.235.110.186 |
| 1991 | US$ 2.110.239.657 |
| 1990 | US$ 2.382.299.630 |
| 1989 | US$ 2.308.098.660 |
| 1988 | US$ 1.829.425.309 |
| 1987 | US$ 1.520.814.039 |
| 1986 | US$ 1.263.966.992 |
| 1985 | US$ 1.379.728.376 |
| 1984 | US$ 1.462.360.264 |
| 1983 | US$ 1.557.278.453 |
| 1982 | US$ 1.602.036.578 |
| 1981 | US$ 1.662.493.965 |
| 1980 | US$ 1.367.560.654 |
| 1979 | US$ 1.227.859.821 |
| 1978 | US$ 987.222.432 |
| 1977 | US$ 922.350.922 |
| 1976 | US$ 1.123.871.124 |
| 1975 | US$ 1.304.711.305 |
| 1974 | US$ 1.090.321.090 |
| 1973 | US$ 783.909.574 |
| 1972 | US$ 770.072.707 |
| 1971 | US$ 630.401.944 |
| 1970 | US$ 525.600.210 |
| 1969 | US$ 517.679.586 |
| 1968 | US$ 455.999.635 |
| 1967 | US$ 422.531.127 |
| 1966 | US$ 393.399.843 |
| 1965 | US$ 358.399.857 |
| 1964 | US$ 349.999.860 |
| 1963 | US$ 281.399.887 |
| 1962 | US$ 271.599.891 |
| 1961 | US$ 261.799.895 |
| 1960 | US$ 265.999.894 |
As importações de bens e serviços da Jamaica são de US$ 8,87 bilhões (2019), ante US$ 266 milhões em 1960. O máximo foi de US$ 9,82 bilhões, em 2008.
As importações da Jamaica superam as exportações em US$ 2,39 bilhões, um déficit comercial (2019). O comércio da Jamaica, exportações e importações somadas, equivale a 90,1% do seu PIB (2019).
Importações de bens da Jamaica por categoria, 2025
Importações de bens, 2025: US$ 7,52 bi
Em 2025, a maior categoria das importações de bens da Jamaica foi petróleo, gás, minérios e outras matérias-primas, com 26,9%, seguida de máquinas, eletrônicos e veículos, com 23,4%.
Origens das importações de bens da Jamaica: as 10 principais, 2025
| Posição | País | Importações de bens | Participação | |
|---|---|---|---|---|
| 1 |
 Estados Unidos |
US$ 2,85 bi | 37,9% | |
| 2 |
 China |
US$ 879 mi | 11,7% | |
| 3 |
 Brasil |
US$ 397 mi | 5,27% | vs Brasil |
| 4 |
 Japão |
US$ 300 mi | 3,98% | |
| 5 |
 Trindade e Tobago |
US$ 279 mi | 3,71% | |
| 6 |
 Nigéria |
US$ 203 mi | 2,7% | |
| 7 |
 Colômbia |
US$ 194 mi | 2,57% | |
| 8 |
 México |
US$ 175 mi | 2,33% | |
| 9 |
 Alemanha |
US$ 140 mi | 1,87% | |
| 10 |
 Índia |
US$ 130 mi | 1,72% | |
| Outros parceiros e não especificados | US$ 1,98 bi | 26,3% |
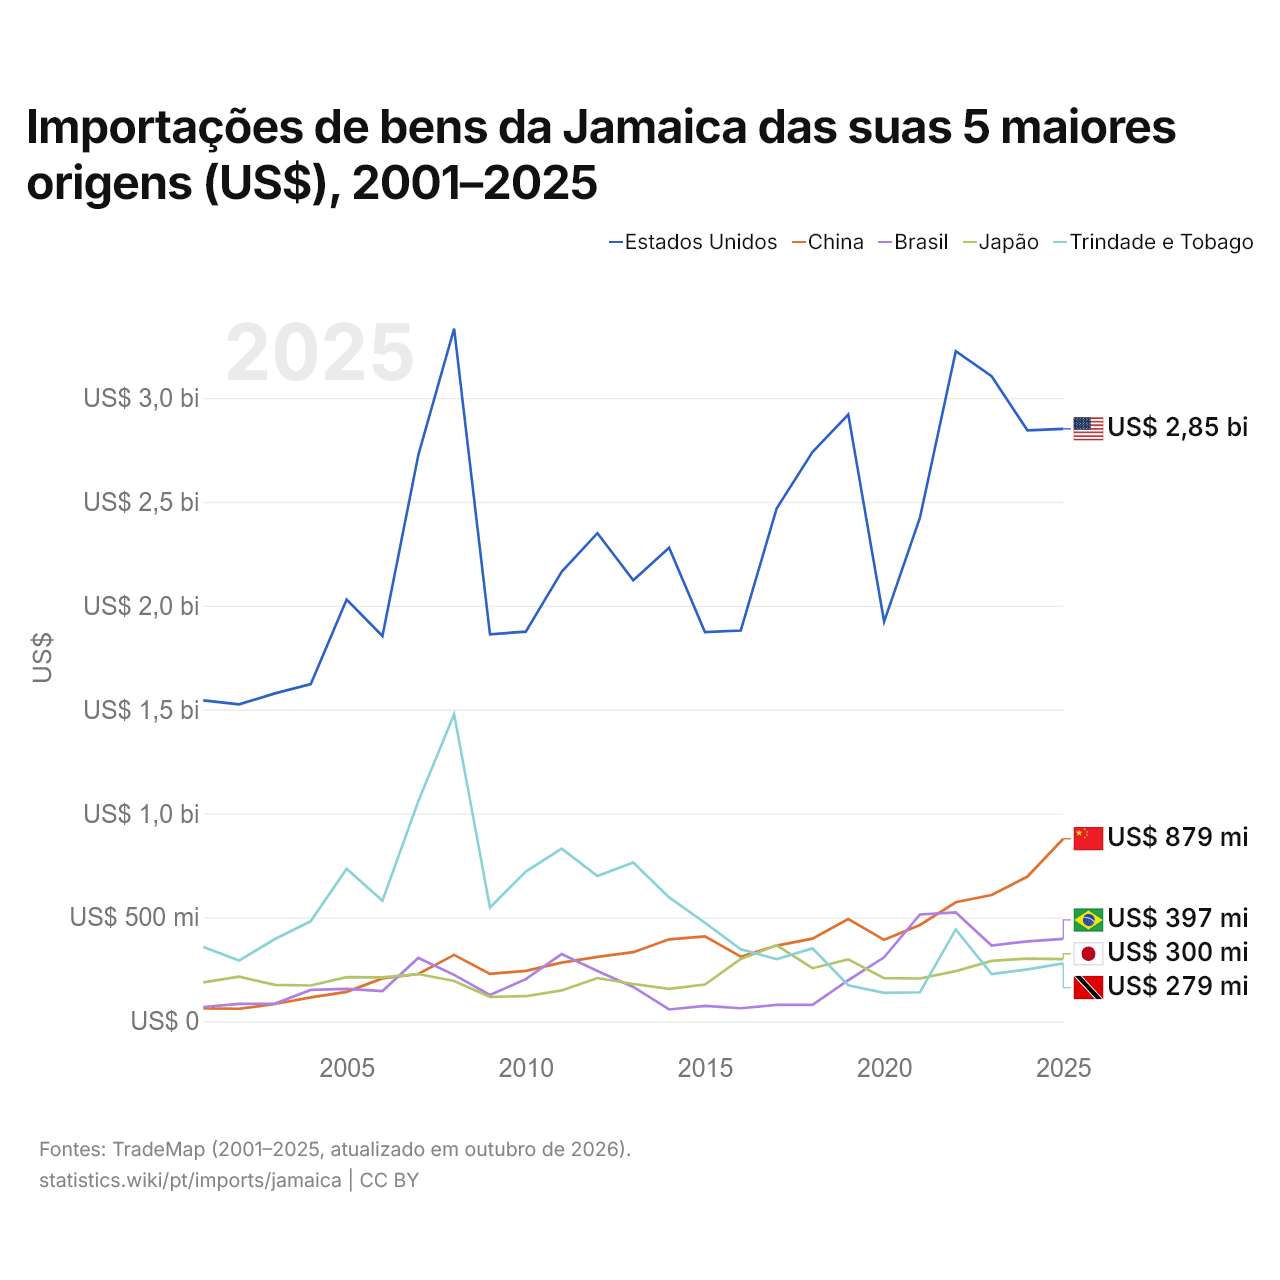
Importações de bens da Jamaica das suas 5 maiores origens (US$), 2001–2025
| Ano | US$ | ||||
|---|---|---|---|---|---|
| Estados Unidos | China | Brasil | Japão | Trindade e Tobago | |
| 2025 | US$ 2.851.144.000 | US$ 878.647.000 | US$ 396.834.000 | US$ 299.703.000 | US$ 279.124.000 |
| 2024 | US$ 2.843.842.000 | US$ 696.808.000 | US$ 385.060.000 | US$ 302.097.000 | US$ 249.745.000 |
| 2023 | US$ 3.104.461.000 | US$ 607.680.000 | US$ 364.684.000 | US$ 290.875.000 | US$ 227.228.000 |
| 2022 | US$ 3.224.581.000 | US$ 572.963.000 | US$ 523.924.000 | US$ 241.766.000 | US$ 442.211.000 |
| 2021 | US$ 2.423.848.000 | US$ 463.767.000 | US$ 514.337.000 | US$ 206.305.000 | US$ 140.115.000 |
| 2020 | US$ 1.923.629.000 | US$ 392.084.000 | US$ 308.109.000 | US$ 208.060.000 | US$ 137.339.000 |
| 2019 | US$ 2.920.202.000 | US$ 491.802.000 | US$ 197.724.000 | US$ 297.889.000 | US$ 173.389.000 |
| 2018 | US$ 2.739.831.000 | US$ 397.834.000 | US$ 79.473.000 | US$ 255.682.000 | US$ 351.120.000 |
| 2017 | US$ 2.467.558.000 | US$ 364.574.000 | US$ 79.211.000 | US$ 365.946.000 | US$ 298.942.000 |
| 2016 | US$ 1.880.873.000 | US$ 311.083.000 | US$ 62.833.000 | US$ 300.357.000 | US$ 346.667.000 |
| 2015 | US$ 1.873.113.000 | US$ 408.995.000 | US$ 74.492.000 | US$ 177.253.000 | US$ 474.415.000 |
| 2014 | US$ 2.278.714.000 | US$ 394.773.000 | US$ 57.167.000 | US$ 155.912.000 | US$ 596.014.000 |
| 2013 | US$ 2.122.704.000 | US$ 332.839.000 | US$ 165.549.000 | US$ 179.831.000 | US$ 764.541.000 |
| 2012 | US$ 2.349.156.000 | US$ 310.452.000 | US$ 241.946.000 | US$ 208.387.000 | US$ 698.991.000 |
| 2011 | US$ 2.163.324.000 | US$ 282.318.000 | US$ 323.700.000 | US$ 148.724.000 | US$ 831.343.000 |
| 2010 | US$ 1.875.095.000 | US$ 242.896.000 | US$ 203.172.000 | US$ 120.952.000 | US$ 721.031.000 |
| 2009 | US$ 1.862.886.000 | US$ 228.355.000 | US$ 126.870.000 | US$ 117.864.000 | US$ 547.395.000 |
| 2008 | US$ 3.333.043.000 | US$ 319.555.000 | US$ 223.825.000 | US$ 194.265.000 | US$ 1.477.598.000 |
| 2007 | US$ 2.724.333.000 | US$ 227.574.000 | US$ 305.056.000 | US$ 227.859.000 | US$ 1.059.452.000 |
| 2006 | US$ 1.853.926.000 | US$ 206.657.000 | US$ 145.896.000 | US$ 211.548.000 | US$ 580.599.000 |
| 2005 | US$ 2.029.718.000 | US$ 141.754.000 | US$ 155.928.000 | US$ 212.523.000 | US$ 734.366.000 |
| 2004 | US$ 1.622.860.000 | US$ 115.454.000 | US$ 151.306.000 | US$ 172.427.000 | US$ 482.403.000 |
| 2003 | US$ 1.578.020.000 | US$ 83.201.000 | US$ 85.482.000 | US$ 175.588.000 | US$ 396.325.000 |
| 2002 | US$ 1.525.638.000 | US$ 60.390.000 | US$ 83.782.000 | US$ 214.886.000 | US$ 292.403.000 |
| 2001 | US$ 1.544.294.000 | US$ 62.213.000 | US$ 68.812.000 | US$ 187.519.000 | US$ 357.952.000 |
Em 2025, as importações de bens foram de US$ 2,85 bilhões dos Estados Unidos, US$ 879 milhões da China, US$ 397 milhões do Brasil, US$ 300 milhões do Japão e US$ 279 milhões de Trindade e Tobago. O primeiro lugar dos cinco fornecedores da Jamaica ficou com os Estados Unidos em todos os anos desde 2001. A mudança mais recente nessa ordem foi em 2023, quando as importações da Jamaica vindas do Japão superaram as vindas de Trindade e Tobago.
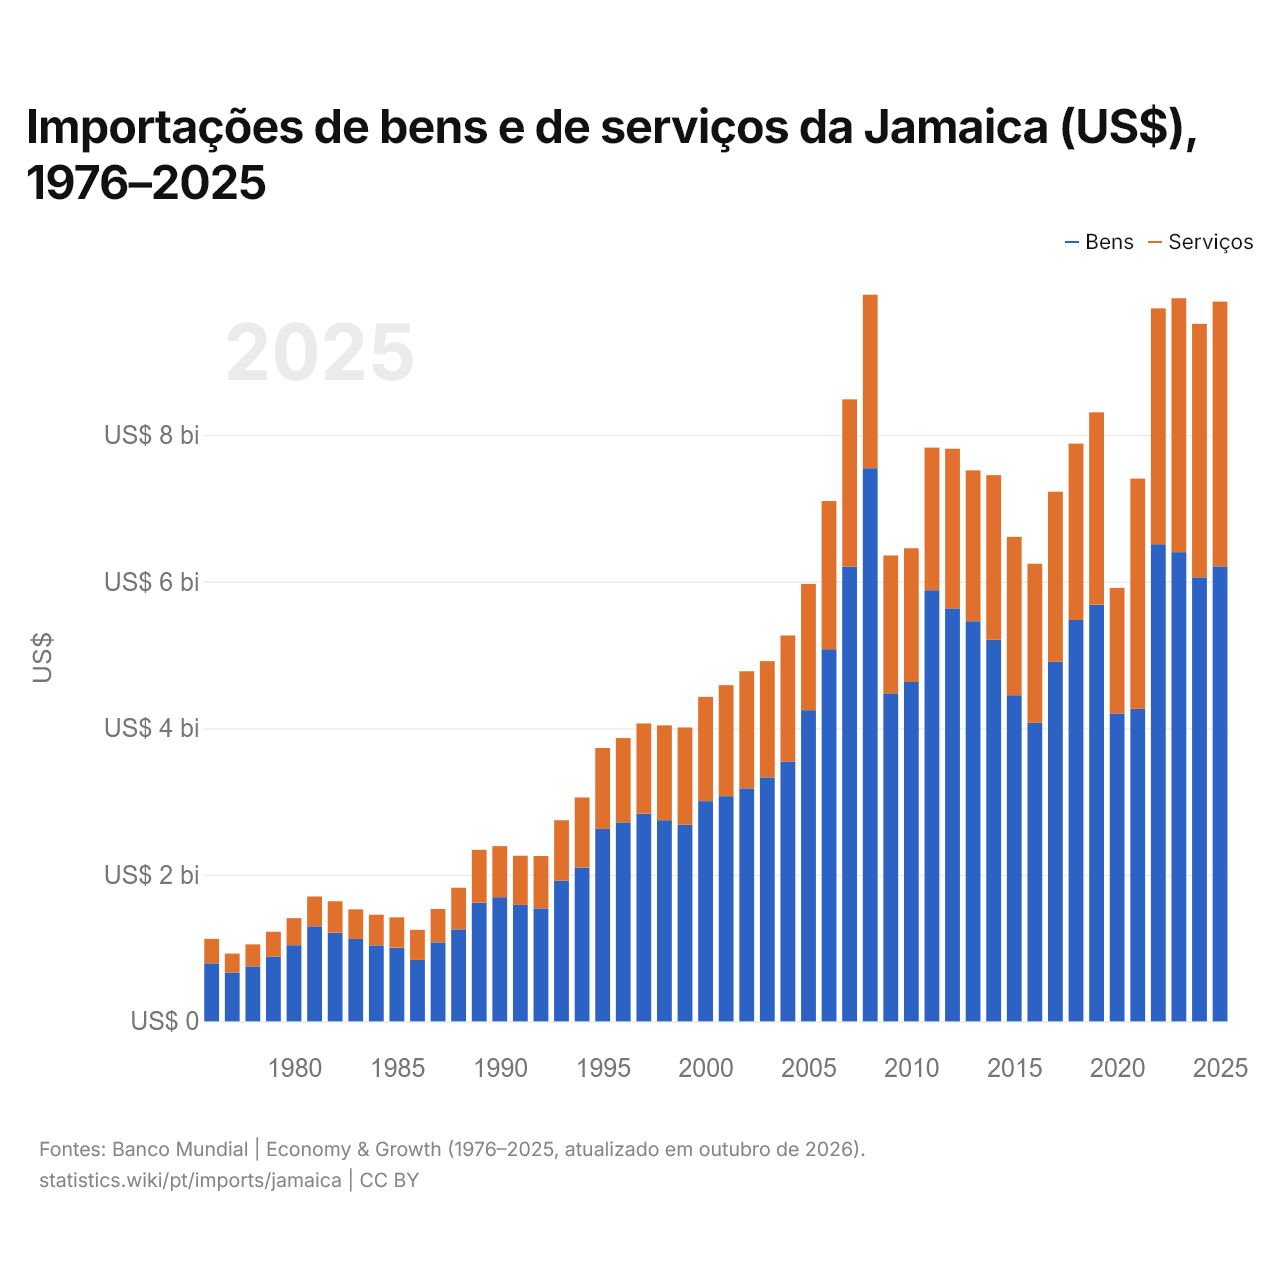
Importações de bens e de serviços da Jamaica (US$), 1976–2025
| Ano | US$ | |
|---|---|---|
| Bens | Serviços | |
| 2025 | US$ 6.207.598.281 | US$ 3.612.481.612 |
| 2024 | US$ 6.057.484.498 | US$ 3.458.566.308 |
| 2023 | US$ 6.401.446.208 | US$ 3.464.229.600 |
| 2022 | US$ 6.509.542.707 | US$ 3.216.946.864 |
| 2021 | US$ 4.262.601.766 | US$ 3.142.711.481 |
| 2020 | US$ 4.199.096.279 | US$ 1.714.152.923 |
| 2019 | US$ 5.684.506.220 | US$ 2.624.006.921 |
| 2018 | US$ 5.475.744.137 | US$ 2.405.794.487 |
| 2017 | US$ 4.904.331.412 | US$ 2.320.429.635 |
| 2016 | US$ 4.072.005.711 | US$ 2.170.632.752 |
| 2015 | US$ 4.449.380.910 | US$ 2.160.746.711 |
| 2014 | US$ 5.207.612.913 | US$ 2.244.698.613 |
| 2013 | US$ 5.458.172.289 | US$ 2.058.550.271 |
| 2012 | US$ 5.634.166.724 | US$ 2.177.419.874 |
| 2011 | US$ 5.881.414.416 | US$ 1.946.040.829 |
| 2010 | US$ 4.629.377.587 | US$ 1.824.399.341 |
| 2009 | US$ 4.475.657.390 | US$ 1.880.636.334 |
| 2008 | US$ 7.546.787.549 | US$ 2.367.116.079 |
| 2007 | US$ 6.203.893.770 | US$ 2.281.682.536 |
| 2006 | US$ 5.077.027.291 | US$ 2.021.063.142 |
| 2005 | US$ 4.245.511.575 | US$ 1.722.027.977 |
| 2004 | US$ 3.545.335.424 | US$ 1.718.690.903 |
| 2003 | US$ 3.328.244.000 | US$ 1.586.142.367 |
| 2002 | US$ 3.179.600.000 | US$ 1.597.395.000 |
| 2001 | US$ 3.072.600.000 | US$ 1.513.900.000 |
| 2000 | US$ 3.004.300.000 | US$ 1.422.500.000 |
| 1999 | US$ 2.685.600.000 | US$ 1.323.000.000 |
| 1998 | US$ 2.743.900.000 | US$ 1.293.600.000 |
| 1997 | US$ 2.832.600.000 | US$ 1.231.700.000 |
| 1996 | US$ 2.715.200.000 | US$ 1.149.200.000 |
| 1995 | US$ 2.625.300.000 | US$ 1.103.800.000 |
| 1994 | US$ 2.099.200.000 | US$ 955.300.000 |
| 1993 | US$ 1.920.500.000 | US$ 823.500.000 |
| 1992 | US$ 1.541.100.000 | US$ 714.400.000 |
| 1991 | US$ 1.588.300.000 | US$ 670.300.000 |
| 1990 | US$ 1.692.700.000 | US$ 697.400.000 |
| 1989 | US$ 1.618.700.000 | US$ 720.800.000 |
| 1988 | US$ 1.255.300.000 | US$ 567.600.000 |
| 1987 | US$ 1.077.300.000 | US$ 455.000.000 |
| 1986 | US$ 837.400.000 | US$ 411.400.000 |
| 1985 | US$ 1.004.200.000 | US$ 414.900.000 |
| 1984 | US$ 1.037.000.000 | US$ 418.000.000 |
| 1983 | US$ 1.124.200.000 | US$ 403.300.000 |
| 1982 | US$ 1.208.900.000 | US$ 430.000.000 |
| 1981 | US$ 1.296.700.000 | US$ 407.100.000 |
| 1980 | US$ 1.038.200.000 | US$ 369.900.000 |
| 1979 | US$ 882.500.000 | US$ 339.500.000 |
| 1978 | US$ 750.100.000 | US$ 299.700.000 |
| 1977 | US$ 666.700.000 | US$ 257.000.000 |
| 1976 | US$ 791.600.000 | US$ 332.800.000 |
Em 2025, as importações de bens da Jamaica foram de US$ 6,21 bilhões e as de serviços, de US$ 3,61 bilhões; os serviços representaram 36,8% do total, ante 29,6% em 1976.
Importações de bens e serviços da Jamaica, % do PIB
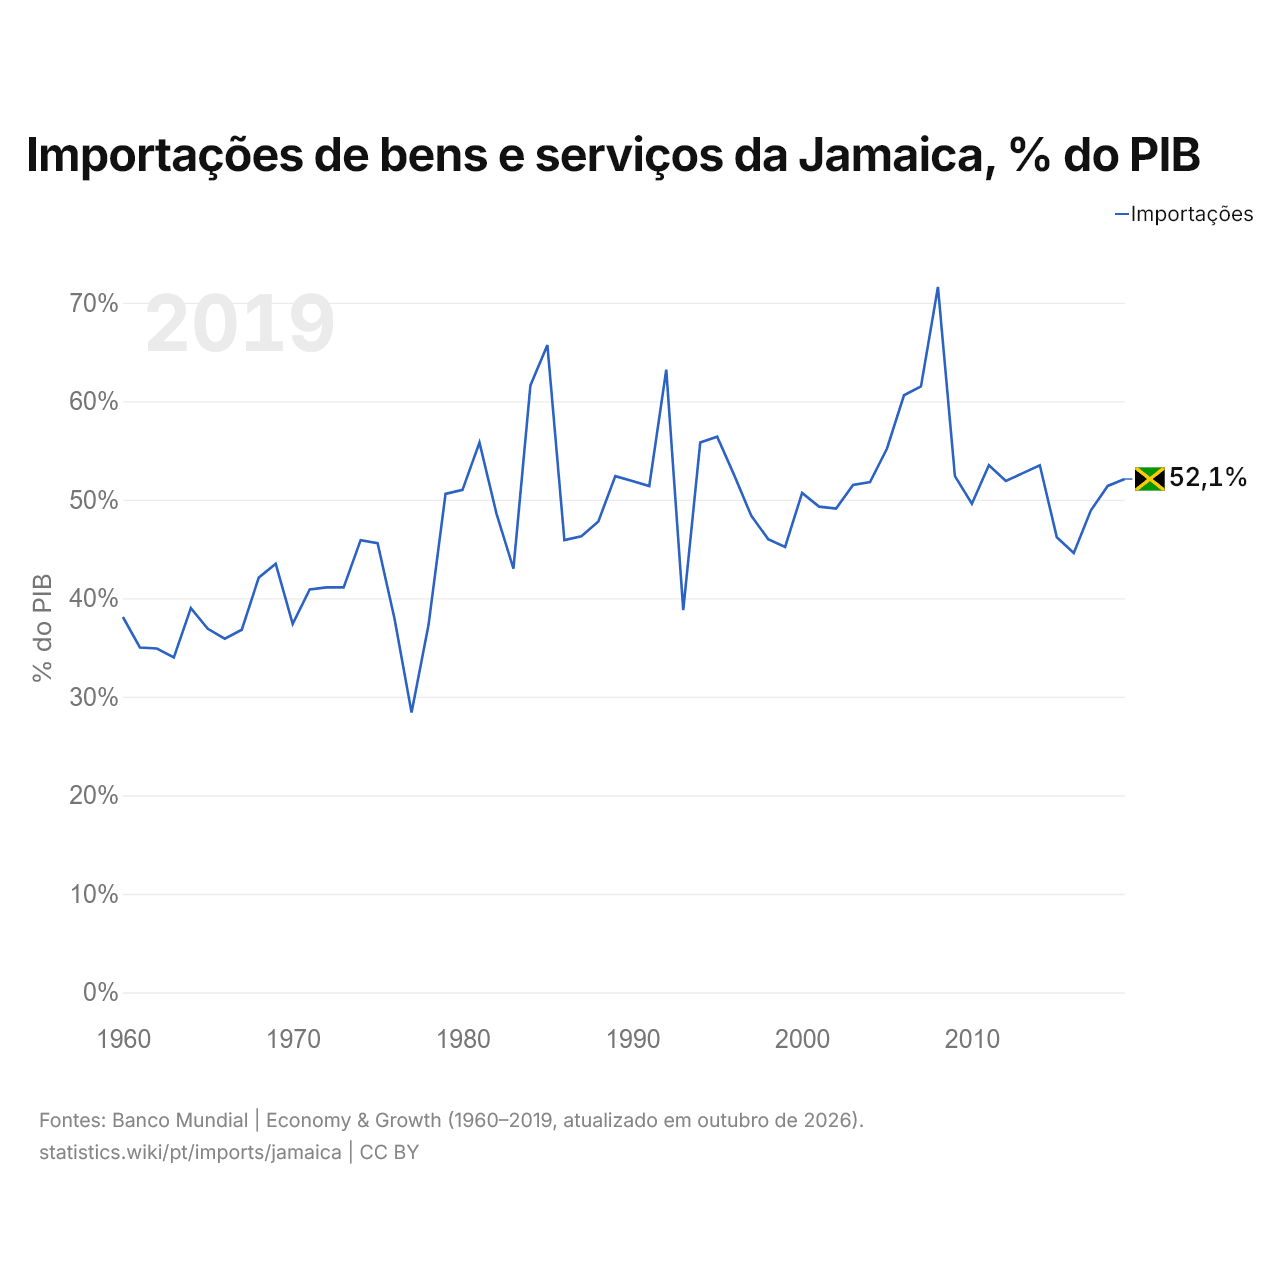
As importações de bens e serviços da Jamaica equivalem a 52,1% do seu PIB (2019), ante 38,1% em 1960. A maior participação foi de 71,6%, em 2008.
Comparar as importações da Jamaica com as de outros países
Fontes:
- TradeMap (2001–2025, atualizado em outubro de 2026)
- Banco Mundial | Economy & Growth (1960–2025, atualizado em outubro de 2026)
Creative Commons Atribuição (CC BY): você pode copiar, compartilhar, adaptar e reutilizar este conteúdo, inclusive para fins comerciais, desde que cite o statistics.wiki e indique as alterações que fizer. As fontes listadas acima podem ter suas próprias condições de licença.