
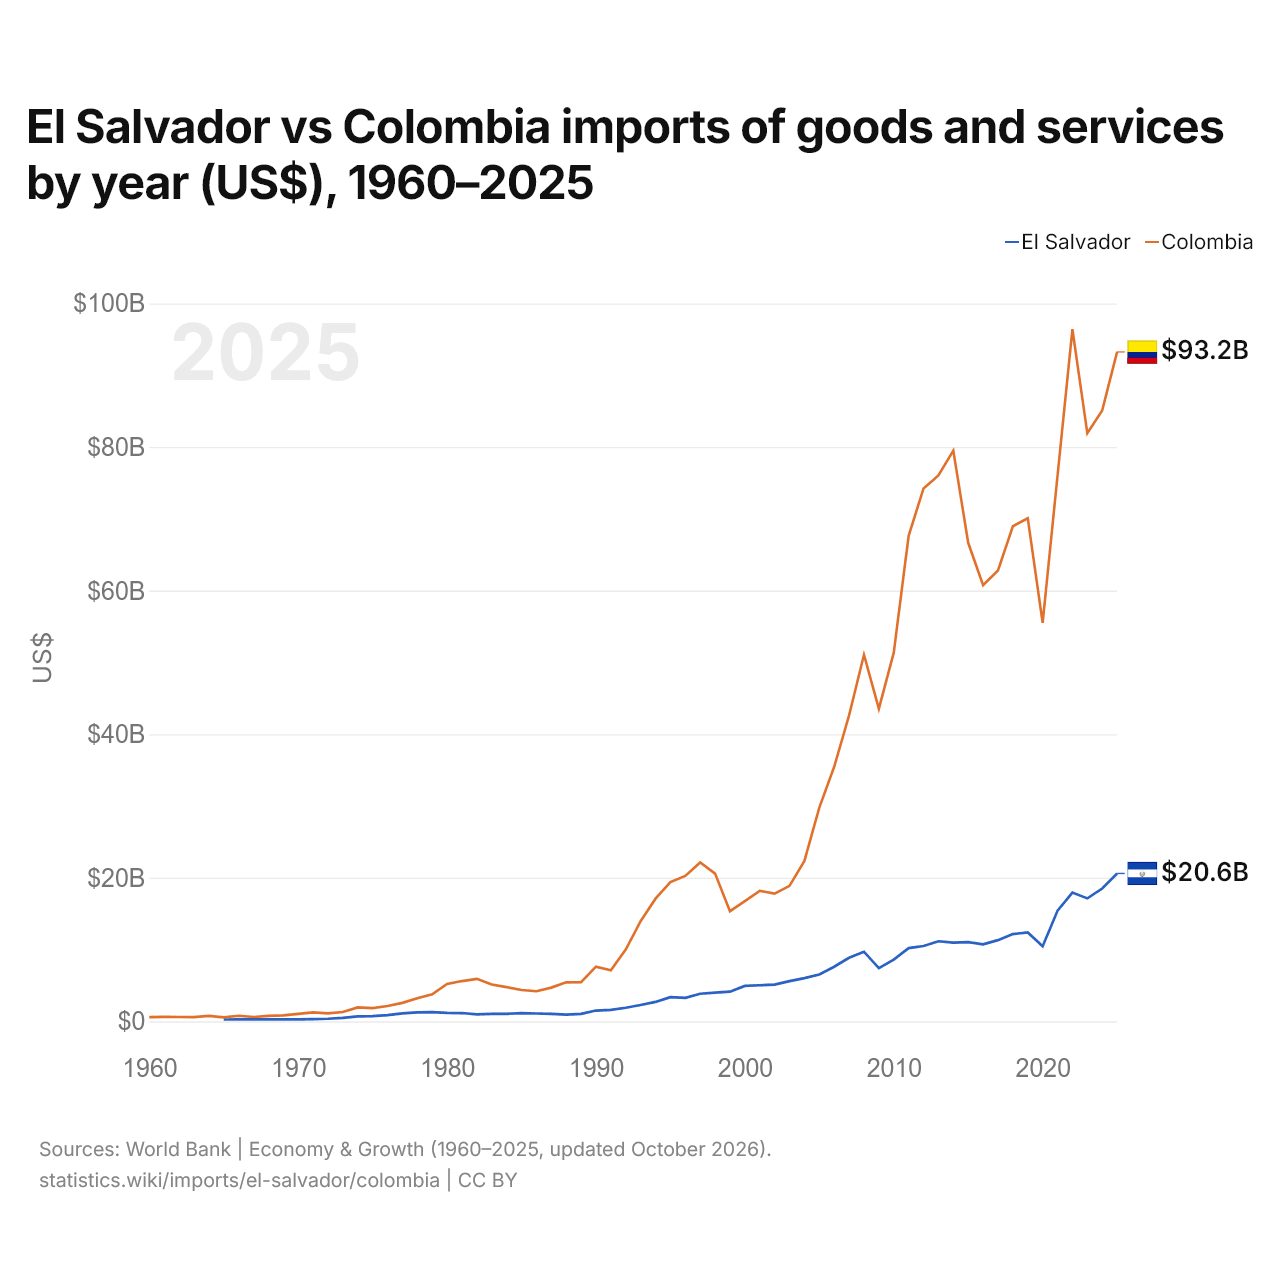
El Salvador vs Colômbia: importações de bens e serviços por ano (US$), 1960–2025
1x
| Ano | US$ | |
|---|---|---|
 El Salvador |
 Colômbia |
|
| 2025 | US$ 20.597.470.000 | US$ 93.242.618.943 |
| 2024 | US$ 18.494.180.000 | US$ 85.099.669.252 |
| 2023 | US$ 17.125.220.000 | US$ 81.912.779.953 |
| 2022 | US$ 17.932.560.000 | US$ 96.411.719.931 |
| 2021 | US$ 15.411.330.000 | US$ 76.006.795.312 |
| 2020 | US$ 10.450.130.000 | US$ 55.511.423.807 |
| 2019 | US$ 12.388.470.000 | US$ 70.067.176.051 |
| 2018 | US$ 12.151.540.000 | US$ 68.961.912.989 |
| 2017 | US$ 11.309.300.000 | US$ 62.802.582.424 |
| 2016 | US$ 10.731.440.000 | US$ 60.743.865.897 |
| 2015 | US$ 11.033.340.000 | US$ 66.653.739.136 |
| 2014 | US$ 10.969.480.000 | US$ 79.499.076.760 |
| 2013 | US$ 11.155.200.000 | US$ 76.037.444.586 |
| 2012 | US$ 10.495.790.000 | US$ 74.226.993.322 |
| 2011 | US$ 10.201.700.000 | US$ 67.642.788.202 |
| 2010 | US$ 8.595.000.000 | US$ 51.351.305.097 |
| 2009 | US$ 7.413.800.000 | US$ 43.545.176.395 |
| 2008 | US$ 9.699.500.000 | US$ 51.066.655.641 |
| 2007 | US$ 8.855.300.000 | US$ 42.618.891.608 |
| 2006 | US$ 7.602.490.000 | US$ 35.453.316.065 |
| 2005 | US$ 6.533.150.000 | US$ 29.777.716.182 |
| 2004 | US$ 6.021.905.400 | US$ 22.356.075.160 |
| 2003 | US$ 5.603.962.500 | US$ 18.873.043.327 |
| 2002 | US$ 5.117.092.900 | US$ 17.793.883.920 |
| 2001 | US$ 5.021.277.400 | US$ 18.180.843.172 |
| 2000 | US$ 4.935.859.900 | US$ 16.731.018.377 |
| 1999 | US$ 4.129.349.000 | US$ 15.343.463.758 |
| 1998 | US$ 3.990.321.100 | US$ 20.576.289.396 |
| 1997 | US$ 3.836.743.500 | US$ 22.137.740.206 |
| 1996 | US$ 3.272.855.600 | US$ 20.252.680.332 |
| 1995 | US$ 3.373.053.900 | US$ 19.392.751.884 |
| 1994 | US$ 2.705.134.100 | US$ 17.091.698.826 |
| 1993 | US$ 2.281.645.100 | US$ 13.949.161.891 |
| 1992 | US$ 1.891.815.600 | US$ 9.985.578.591 |
| 1991 | US$ 1.603.417.100 | US$ 7.098.679.409 |
| 1990 | US$ 1.499.153.633 | US$ 7.614.454.665 |
| 1989 | US$ 1.035.800.000 | US$ 5.464.066.789 |
| 1988 | US$ 933.715.700 | US$ 5.433.539.691 |
| 1987 | US$ 1.033.141.700 | US$ 4.697.932.910 |
| 1986 | US$ 1.095.515.800 | US$ 4.190.788.878 |
| 1985 | US$ 1.135.807.500 | US$ 4.370.638.535 |
| 1984 | US$ 1.044.917.600 | US$ 4.767.852.803 |
| 1983 | US$ 1.048.723.500 | US$ 5.127.945.979 |
| 1982 | US$ 967.760.600 | US$ 5.919.610.897 |
| 1981 | US$ 1.154.480.000 | US$ 5.610.414.541 |
| 1980 | US$ 1.188.160.000 | US$ 5.209.514.725 |
| 1979 | US$ 1.286.440.000 | US$ 3.756.624.824 |
| 1978 | US$ 1.236.480.000 | US$ 3.210.026.858 |
| 1977 | US$ 1.102.320.000 | US$ 2.569.926.742 |
| 1976 | US$ 857.200.000 | US$ 2.131.690.445 |
| 1975 | US$ 720.040.000 | US$ 1.835.324.549 |
| 1974 | US$ 680.200.000 | US$ 1.933.488.606 |
| 1973 | US$ 475.720.000 | US$ 1.306.397.078 |
| 1972 | US$ 355.440.000 | US$ 1.109.769.650 |
| 1971 | US$ 315.680.000 | US$ 1.252.577.345 |
| 1970 | US$ 278.120.000 | US$ 1.047.700.632 |
| 1969 | US$ 270.680.000 | US$ 839.120.872 |
| 1968 | US$ 273.680.000 | US$ 763.579.000 |
| 1967 | US$ 279.760.000 | US$ 602.411.300 |
| 1966 | US$ 276.800.000 | US$ 778.814.815 |
| 1965 | US$ 252.880.000 | US$ 559.333.333 |
| 1964 | - | US$ 755.727.700 |
| 1963 | - | US$ 597.285.656 |
| 1962 | - | US$ 605.929.809 |
| 1961 | - | US$ 627.934.716 |
| 1960 | - | US$ 594.894.695 |
Em 2025, as importações de bens e serviços de El Salvador foram de US$ 20,6 bilhões e as da Colômbia, de US$ 93,2 bilhões: as da Colômbia foram 4,5 vezes maiores. Em 1965, as importações da Colômbia foram 2,2 vezes maiores: US$ 253 milhões de El Salvador e US$ 559 milhões da Colômbia.
As importações de bens e serviços da Colômbia têm sido maiores que as de El Salvador todos os anos desde 1965.
El Salvador vs Colômbia: dados de importações
|
El Salvador
|
Colômbia
|
|
|---|---|---|
| Importações | US$ 20,6 bi (2025) | US$ 93,2 bi (2025) |
| Posição mundial | 91/174 | 52/174 |
| Participação mundial | 0,06% | 0,28% |
| % do PIB | 56,1% | 20,4% |
| Maior categoria de bens | Máquinas, eletrônicos e veículos (23,5%, 2025) | Máquinas, eletrônicos e veículos (34%, 2025) |
| Principal origem dos bens | Estados Unidos (26,3%, 2025) | China (27,5%, 2025) |
Comparar as importações de 2 países quaisquer
Fontes:
- Banco Mundial | Economy & Growth (1960–2025, atualizado em outubro de 2026)
- TradeMap (2001–2025, atualizado em outubro de 2026)
Creative Commons Atribuição (CC BY): você pode copiar, compartilhar, adaptar e reutilizar este conteúdo, inclusive para fins comerciais, desde que cite o statistics.wiki e indique as alterações que fizer. As fontes listadas acima podem ter suas próprias condições de licença.