
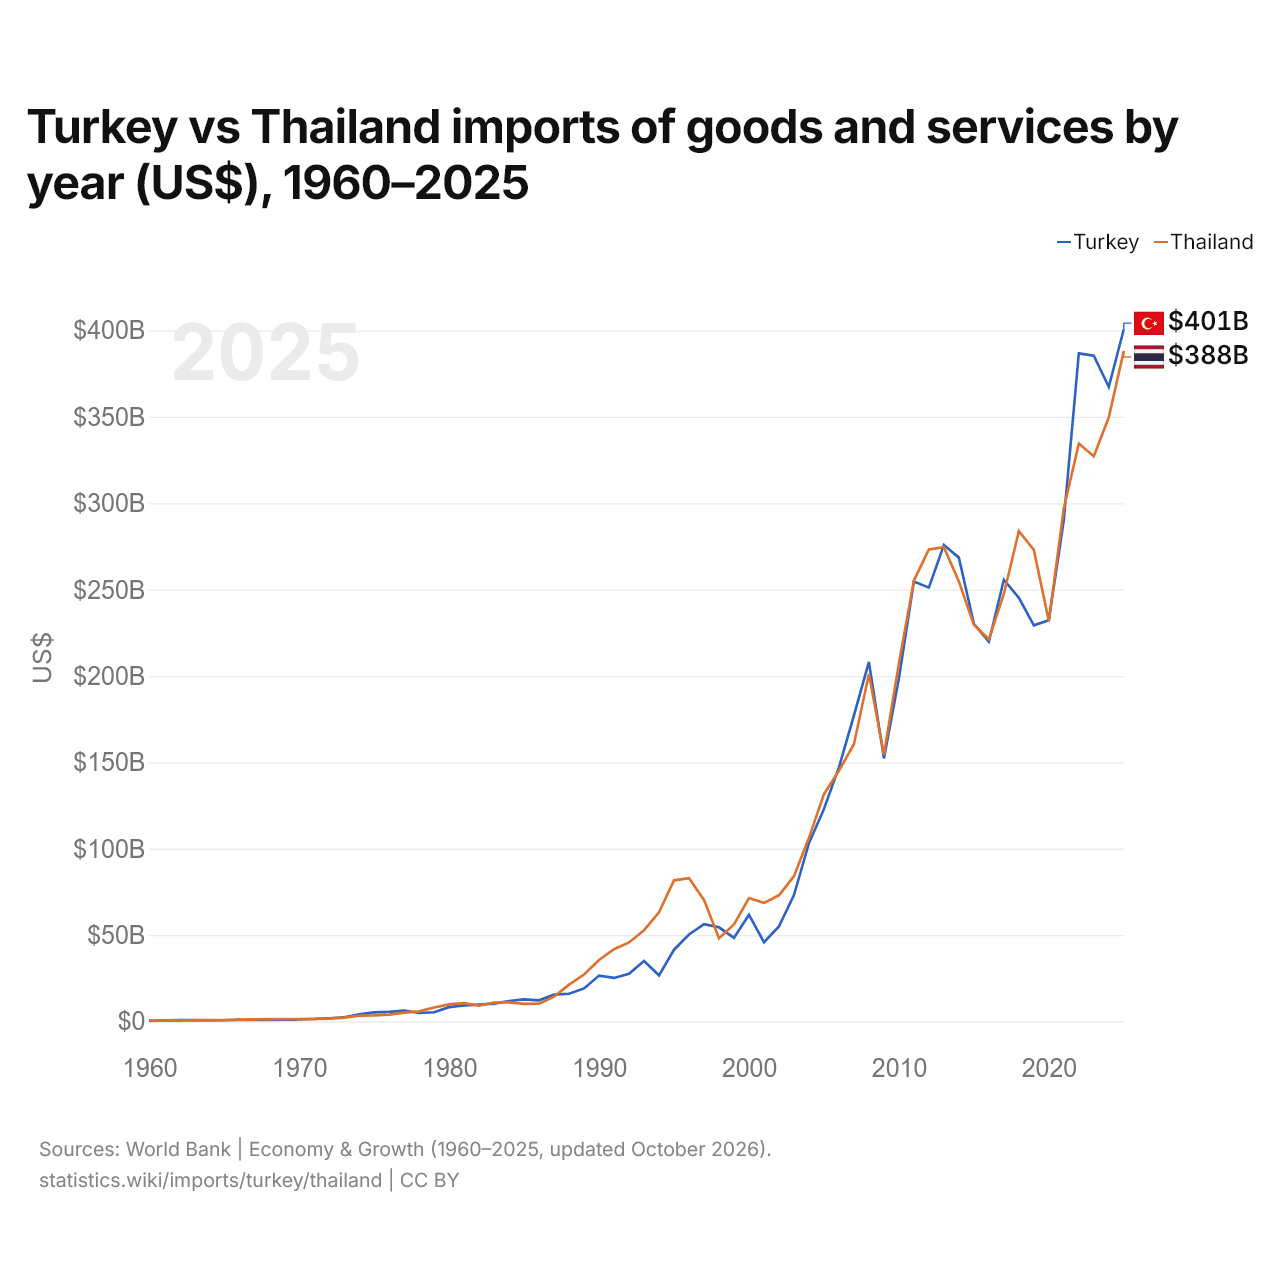
Turquia vs Tailândia: importações de bens e serviços por ano (US$), 1960–2025
1x
| Ano | US$ | |
|---|---|---|
 Turquia |
 Tailândia |
|
| 2025 | US$ 400.679.511.057 | US$ 388.129.158.917 |
| 2024 | US$ 367.379.077.169 | US$ 349.671.347.769 |
| 2023 | US$ 385.393.330.659 | US$ 327.159.708.259 |
| 2022 | US$ 386.711.092.837 | US$ 334.490.999.348 |
| 2021 | US$ 290.243.026.943 | US$ 297.103.648.540 |
| 2020 | US$ 232.192.230.751 | US$ 231.745.471.361 |
| 2019 | US$ 229.253.569.686 | US$ 272.916.501.195 |
| 2018 | US$ 245.157.569.263 | US$ 283.801.450.352 |
| 2017 | US$ 255.673.681.716 | US$ 247.430.252.337 |
| 2016 | US$ 219.776.888.914 | US$ 221.168.950.938 |
| 2015 | US$ 230.161.663.399 | US$ 229.553.374.317 |
| 2014 | US$ 268.468.454.798 | US$ 254.633.174.992 |
| 2013 | US$ 275.806.251.707 | US$ 274.440.605.889 |
| 2012 | US$ 251.096.117.263 | US$ 273.216.802.241 |
| 2011 | US$ 254.618.813.879 | US$ 255.199.302.709 |
| 2010 | US$ 198.401.861.132 | US$ 207.270.092.302 |
| 2009 | US$ 152.234.991.548 | US$ 154.464.210.142 |
| 2008 | US$ 208.120.647.288 | US$ 201.114.263.639 |
| 2007 | US$ 177.062.270.987 | US$ 160.397.501.827 |
| 2006 | US$ 147.024.766.163 | US$ 145.055.658.781 |
| 2005 | US$ 122.961.373.358 | US$ 131.483.811.713 |
| 2004 | US$ 103.109.391.408 | US$ 106.227.137.282 |
| 2003 | US$ 73.087.556.675 | US$ 84.013.623.652 |
| 2002 | US$ 54.987.639.146 | US$ 72.957.610.440 |
| 2001 | US$ 45.792.581.438 | US$ 68.589.774.464 |
| 2000 | US$ 61.657.012.663 | US$ 71.358.148.623 |
| 1999 | US$ 48.346.453.175 | US$ 56.073.604.732 |
| 1998 | US$ 54.441.094.414 | US$ 48.088.381.968 |
| 1997 | US$ 56.251.261.318 | US$ 70.306.578.166 |
| 1996 | US$ 50.297.738.468 | US$ 82.833.928.831 |
| 1995 | US$ 41.468.208.092 | US$ 81.632.776.746 |
| 1994 | US$ 26.631.422.878 | US$ 63.084.056.781 |
| 1993 | US$ 34.898.334.092 | US$ 52.752.864.173 |
| 1992 | US$ 27.596.929.569 | US$ 45.675.754.075 |
| 1991 | US$ 25.124.448.706 | US$ 41.756.458.834 |
| 1990 | US$ 26.482.062.093 | US$ 35.545.811.133 |
| 1989 | US$ 19.048.020.735 | US$ 27.083.485.883 |
| 1988 | US$ 15.951.195.499 | US$ 21.214.461.460 |
| 1987 | US$ 15.482.730.455 | US$ 14.318.700.036 |
| 1986 | US$ 12.184.888.889 | US$ 10.157.503.648 |
| 1985 | US$ 12.751.532.567 | US$ 10.091.466.561 |
| 1984 | US$ 11.791.825.613 | US$ 10.937.559.289 |
| 1983 | US$ 10.233.333.333 | US$ 10.920.988.398 |
| 1982 | US$ 9.666.257.669 | US$ 9.012.215.417 |
| 1981 | US$ 9.185.585.586 | US$ 10.496.074.713 |
| 1980 | US$ 8.209.210.526 | US$ 9.824.991.784 |
| 1979 | US$ 5.270.967.742 | US$ 8.019.027.044 |
| 1978 | US$ 4.804.166.667 | US$ 5.788.768.871 |
| 1977 | US$ 6.283.333.333 | US$ 5.019.533.480 |
| 1976 | US$ 5.487.500.000 | US$ 3.856.500.136 |
| 1975 | US$ 5.171.428.571 | US$ 3.419.308.121 |
| 1974 | US$ 3.992.857.143 | US$ 3.282.633.712 |
| 1973 | US$ 2.364.285.714 | US$ 2.172.743.954 |
| 1972 | US$ 1.764.285.714 | US$ 1.568.843.967 |
| 1971 | US$ 1.333.333.333 | US$ 1.387.451.923 |
| 1970 | US$ 1.136.363.636 | US$ 1.373.509.615 |
| 1969 | US$ 922.222.222 | US$ 1.343.125.000 |
| 1968 | US$ 888.888.889 | US$ 1.257.644.231 |
| 1967 | US$ 777.777.778 | US$ 1.139.615.385 |
| 1966 | US$ 800.000.000 | US$ 947.403.846 |
| 1965 | US$ 644.444.444 | US$ 792.692.308 |
| 1964 | US$ 611.111.111 | US$ 730.192.308 |
| 1963 | US$ 722.222.222 | US$ 650.552.088 |
| 1962 | US$ 711.111.111 | US$ 584.003.831 |
| 1961 | US$ 544.444.444 | US$ 519.126.773 |
| 1960 | US$ 277.777.778 | US$ 480.790.702 |
Em 2025, as importações de bens e serviços da Turquia foram de US$ 401 bilhões e as da Tailândia, de US$ 388 bilhões: as da Turquia foram 3,2% maiores. Em 1960, as importações da Tailândia foram 1,7 vezes maiores: US$ 278 milhões da Turquia e US$ 481 milhões da Tailândia.
As importações de bens e serviços da Turquia têm sido maiores que as da Tailândia todos os anos desde 2022.
Turquia vs Tailândia: dados de importações
|
Turquia
|
Tailândia
|
|
|---|---|---|
| Importações | US$ 401 bi (2025) | US$ 388 bi (2025) |
| Posição mundial | 23/174 | 26/174 |
| Participação mundial | 1,19% | 1,15% |
| % do PIB | 25,1% | 67,3% |
| Maior categoria de bens | Máquinas, eletrônicos e veículos (33,7%, 2025) | Máquinas, eletrônicos e veículos (44,6%, 2025) |
| Principal origem dos bens | China (13,6%, 2025) | China (31%, 2025) |
Comparar as importações de 2 países quaisquer
Fontes:
- Banco Mundial | Economy & Growth (1960–2025, atualizado em outubro de 2026)
- TradeMap (2001–2025, atualizado em outubro de 2026)
Creative Commons Atribuição (CC BY): você pode copiar, compartilhar, adaptar e reutilizar este conteúdo, inclusive para fins comerciais, desde que cite o statistics.wiki e indique as alterações que fizer. As fontes listadas acima podem ter suas próprias condições de licença.