
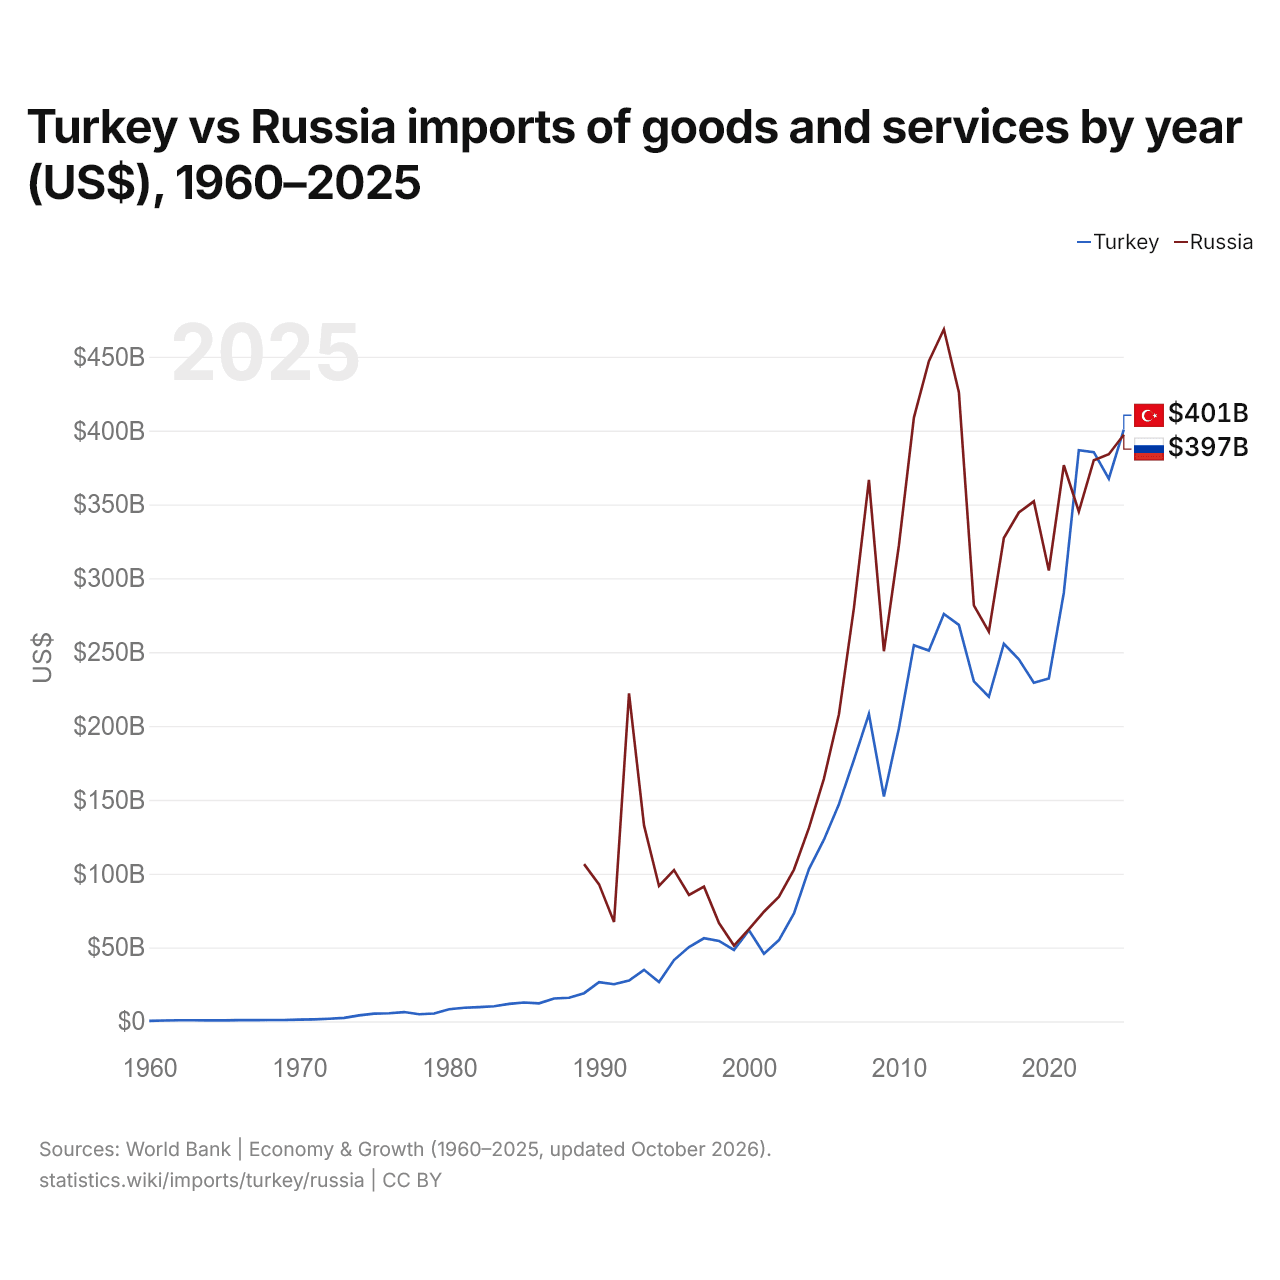
Turquia vs Rússia: importações de bens e serviços por ano (US$), 1960–2025
1x
| Ano | US$ | |
|---|---|---|
 Turquia |
 Rússia |
|
| 2025 | US$ 400.679.511.057 | US$ 397.181.687.664 |
| 2024 | US$ 367.379.077.169 | US$ 383.987.377.510 |
| 2023 | US$ 385.393.330.659 | US$ 379.986.343.206 |
| 2022 | US$ 386.711.092.837 | US$ 345.173.687.962 |
| 2021 | US$ 290.243.026.943 | US$ 376.515.695.621 |
| 2020 | US$ 232.192.230.751 | US$ 305.255.226.177 |
| 2019 | US$ 229.253.569.686 | US$ 352.088.733.269 |
| 2018 | US$ 245.157.569.263 | US$ 344.519.598.182 |
| 2017 | US$ 255.673.681.716 | US$ 327.207.464.722 |
| 2016 | US$ 219.776.888.914 | US$ 263.830.495.059 |
| 2015 | US$ 230.161.663.399 | US$ 281.640.332.373 |
| 2014 | US$ 268.468.454.798 | US$ 426.062.113.845 |
| 2013 | US$ 275.806.251.707 | US$ 468.622.436.736 |
| 2012 | US$ 251.096.117.263 | US$ 447.048.493.878 |
| 2011 | US$ 254.618.813.879 | US$ 408.776.142.105 |
| 2010 | US$ 198.401.861.132 | US$ 322.366.550.354 |
| 2009 | US$ 152.234.991.548 | US$ 250.605.238.920 |
| 2008 | US$ 208.120.647.288 | US$ 366.597.425.851 |
| 2007 | US$ 177.062.270.987 | US$ 279.982.932.542 |
| 2006 | US$ 147.024.766.163 | US$ 207.914.704.587 |
| 2005 | US$ 122.961.373.358 | US$ 164.341.230.419 |
| 2004 | US$ 103.109.391.408 | US$ 130.992.710.864 |
| 2003 | US$ 73.087.556.675 | US$ 102.759.593.086 |
| 2002 | US$ 54.987.639.146 | US$ 84.408.293.461 |
| 2001 | US$ 45.792.581.438 | US$ 74.250.942.749 |
| 2000 | US$ 61.657.012.663 | US$ 62.417.348.027 |
| 1999 | US$ 48.346.453.175 | US$ 51.275.385.865 |
| 1998 | US$ 54.441.094.414 | US$ 66.522.411.128 |
| 1997 | US$ 56.251.261.318 | US$ 91.218.668.971 |
| 1996 | US$ 50.297.738.468 | US$ 85.589.979.710 |
| 1995 | US$ 41.468.208.092 | US$ 102.419.980.064 |
| 1994 | US$ 26.631.422.878 | US$ 91.639.498.027 |
| 1993 | US$ 34.898.334.092 | US$ 132.673.769.660 |
| 1992 | US$ 27.596.929.569 | US$ 222.111.380.145 |
| 1991 | US$ 25.124.448.706 | US$ 67.259.259.259 |
| 1990 | US$ 26.482.062.093 | US$ 92.776.886.035 |
| 1989 | US$ 19.048.020.735 | US$ 106.454.465.075 |
| 1988 | US$ 15.951.195.499 | - |
| 1987 | US$ 15.482.730.455 | - |
| 1986 | US$ 12.184.888.889 | - |
| 1985 | US$ 12.751.532.567 | - |
| 1984 | US$ 11.791.825.613 | - |
| 1983 | US$ 10.233.333.333 | - |
| 1982 | US$ 9.666.257.669 | - |
| 1981 | US$ 9.185.585.586 | - |
| 1980 | US$ 8.209.210.526 | - |
| 1979 | US$ 5.270.967.742 | - |
| 1978 | US$ 4.804.166.667 | - |
| 1977 | US$ 6.283.333.333 | - |
| 1976 | US$ 5.487.500.000 | - |
| 1975 | US$ 5.171.428.571 | - |
| 1974 | US$ 3.992.857.143 | - |
| 1973 | US$ 2.364.285.714 | - |
| 1972 | US$ 1.764.285.714 | - |
| 1971 | US$ 1.333.333.333 | - |
| 1970 | US$ 1.136.363.636 | - |
| 1969 | US$ 922.222.222 | - |
| 1968 | US$ 888.888.889 | - |
| 1967 | US$ 777.777.778 | - |
| 1966 | US$ 800.000.000 | - |
| 1965 | US$ 644.444.444 | - |
| 1964 | US$ 611.111.111 | - |
| 1963 | US$ 722.222.222 | - |
| 1962 | US$ 711.111.111 | - |
| 1961 | US$ 544.444.444 | - |
| 1960 | US$ 277.777.778 | - |
Em 2025, as importações de bens e serviços da Turquia foram de US$ 401 bilhões e as da Rússia, de US$ 397 bilhões: as da Turquia foram 0,88% maiores. Em 1989, as importações da Rússia foram 5,6 vezes maiores: US$ 19 bilhões da Turquia e US$ 106 bilhões da Rússia.
Turquia vs Rússia: dados de importações
|
Turquia
|
Rússia
|
|
|---|---|---|
| Importações | US$ 401 bi (2025) | US$ 397 bi (2025) |
| Posição mundial | 23/174 | 25/174 |
| Participação mundial | 1,19% | 1,18% |
| % do PIB | 25,1% | 15,5% |
| Maior categoria de bens | Máquinas, eletrônicos e veículos (33,7%, 2025) | Máquinas, eletrônicos e veículos (45,2%, 2021) |
| Principal origem dos bens | China (13,6%, 2025) | China (24,8%, 2021) |
Comparar as importações de 2 países quaisquer
Fontes:
- Banco Mundial | Economy & Growth (1960–2025, atualizado em outubro de 2026)
- TradeMap (2001–2025, atualizado em outubro de 2026)
Creative Commons Atribuição (CC BY): você pode copiar, compartilhar, adaptar e reutilizar este conteúdo, inclusive para fins comerciais, desde que cite o statistics.wiki e indique as alterações que fizer. As fontes listadas acima podem ter suas próprias condições de licença.