
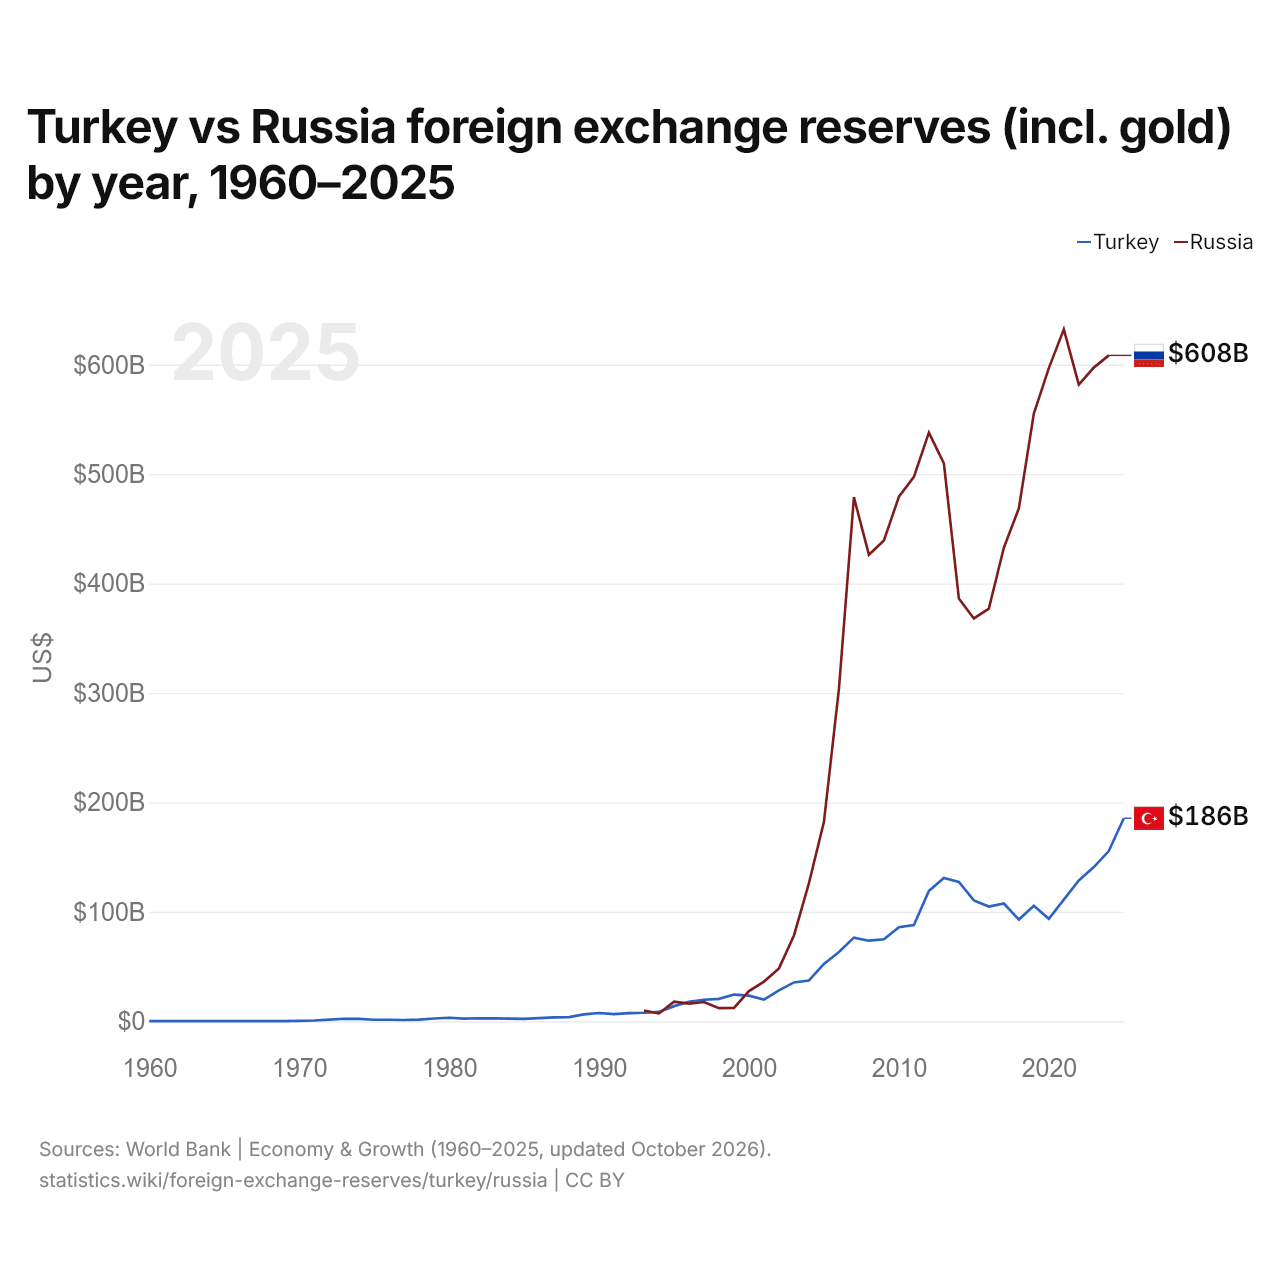
Turquia vs Rússia: reservas internacionais (incluindo ouro) por ano, 1960–2025
1x
| Ano | US$ | |
|---|---|---|
 Turquia |
 Rússia |
|
| 2025 | US$ 185.567.690.700 | - |
| 2024 | US$ 155.548.682.878 | US$ 608.360.767.885 |
| 2023 | US$ 140.868.480.002 | US$ 597.217.063.819 |
| 2022 | US$ 128.735.003.396 | US$ 581.709.956.946 |
| 2021 | US$ 111.184.882.382 | US$ 632.241.824.796 |
| 2020 | US$ 93.584.577.917 | US$ 596.769.862.770 |
| 2019 | US$ 105.619.672.448 | US$ 555.179.461.639 |
| 2018 | US$ 92.997.230.041 | US$ 468.645.216.083 |
| 2017 | US$ 107.657.025.385 | US$ 432.730.507.964 |
| 2016 | US$ 104.810.530.764 | US$ 377.052.204.308 |
| 2015 | US$ 110.489.628.113 | US$ 368.042.950.259 |
| 2014 | US$ 127.421.921.236 | US$ 386.216.337.149 |
| 2013 | US$ 131.053.847.401 | US$ 509.692.074.389 |
| 2012 | US$ 119.182.965.975 | US$ 537.816.372.807 |
| 2011 | US$ 87.937.253.858 | US$ 497.410.212.789 |
| 2010 | US$ 85.959.461.666 | US$ 479.222.324.221 |
| 2009 | US$ 74.933.099.954 | US$ 439.341.754.765 |
| 2008 | US$ 73.674.684.816 | US$ 426.278.773.722 |
| 2007 | US$ 76.496.127.491 | US$ 478.822.286.132 |
| 2006 | US$ 63.264.841.174 | US$ 303.773.185.900 |
| 2005 | US$ 52.493.941.950 | US$ 182.272.103.918 |
| 2004 | US$ 37.304.121.309 | US$ 126.257.956.296 |
| 2003 | US$ 35.548.509.276 | US$ 78.409.347.971 |
| 2002 | US$ 28.348.030.217 | US$ 48.325.637.167 |
| 2001 | US$ 19.911.331.847 | US$ 36.302.524.269 |
| 2000 | US$ 23.514.529.510 | US$ 27.656.266.696 |
| 1999 | US$ 24.432.663.964 | US$ 12.325.102.379 |
| 1998 | US$ 20.567.605.389 | US$ 12.042.972.908 |
| 1997 | US$ 19.746.043.484 | US$ 17.624.090.270 |
| 1996 | US$ 17.819.437.052 | US$ 16.257.617.319 |
| 1995 | US$ 13.890.900.402 | US$ 18.023.640.710 |
| 1994 | US$ 8.633.212.506 | US$ 7.206.227.228 |
| 1993 | US$ 7.846.358.557 | US$ 9.817.681.551 |
| 1992 | US$ 7.507.926.869 | - |
| 1991 | US$ 6.616.201.216 | - |
| 1990 | US$ 7.626.099.814 | - |
| 1989 | US$ 6.298.197.326 | - |
| 1988 | US$ 3.912.434.398 | - |
| 1987 | US$ 3.630.665.151 | - |
| 1986 | US$ 2.912.507.103 | - |
| 1985 | US$ 2.317.544.643 | - |
| 1984 | US$ 2.442.157.927 | - |
| 1983 | US$ 2.728.450.851 | - |
| 1982 | US$ 2.802.367.063 | - |
| 1981 | US$ 2.425.976.885 | - |
| 1980 | US$ 3.298.027.746 | - |
| 1979 | US$ 2.586.031.059 | - |
| 1978 | US$ 1.630.117.686 | - |
| 1977 | US$ 1.237.511.840 | - |
| 1976 | US$ 1.471.465.350 | - |
| 1975 | US$ 1.444.445.641 | - |
| 1974 | US$ 2.227.397.999 | - |
| 1973 | US$ 2.386.716.877 | - |
| 1972 | US$ 1.493.838.677 | - |
| 1971 | US$ 781.035.857 | - |
| 1970 | US$ 439.755.730 | - |
| 1969 | US$ 245.673.600 | - |
| 1968 | US$ 142.104.900 | - |
| 1967 | US$ 119.539.200 | - |
| 1966 | US$ 131.543.660 | - |
| 1965 | US$ 141.387.680 | - |
| 1964 | US$ 142.339.680 | - |
| 1963 | US$ 178.272.880 | - |
| 1962 | US$ 190.280.000 | - |
| 1961 | US$ 195.570.000 | - |
| 1960 | US$ 205.127.600 | - |
As reservas internacionais da Turquia foram de US$ 156 bilhões (2024) e as da Rússia, de US$ 608 bilhões (2024): as da Rússia foram 3,9 vezes maiores. Em 1993, as reservas da Rússia foram 25% maiores: US$ 7,85 bilhões da Turquia e US$ 9,82 bilhões da Rússia.
As reservas internacionais da Rússia têm sido maiores que as da Turquia todos os anos desde 2000.
Turquia vs Rússia: reservas, incluindo ouro, e meses de importações cobertos
|
Turquia
|
Rússia
|
|
|---|---|---|
| Reservas, incluindo ouro | US$ 186 bi (2025) | US$ 608 bi (2024) |
| Meses de importações | 5,6 (2025) | 19,0 (2024) |
| Posição mundial | 20/168 | 6/168 |
Comparar as reservas internacionais de 2 países quaisquer
Fontes:
- Banco Mundial | Economy & Growth (1960–2025, atualizado em outubro de 2026)
Creative Commons Atribuição (CC BY): você pode copiar, compartilhar, adaptar e reutilizar este conteúdo, inclusive para fins comerciais, desde que cite o statistics.wiki e indique as alterações que fizer. As fontes listadas acima podem ter suas próprias condições de licença.